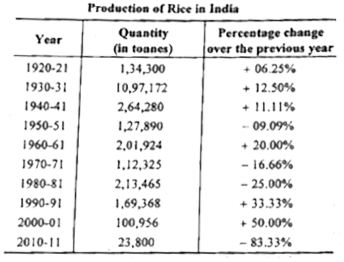
Solve the following questions on the basis of given data in the following table :

Out of the given years which year has shown least increase (in amount) over the previous year :
1940-41
1960-61
1920-21
2000-01
The correct Answer is:C
Step by step video, text & image solution for Solve the following questions on the basis of given data in the following table : Out of the given years which year has shown least increase (in amount) over the previous year : by Maths experts to help you in doubts & scoring excellent marks in Class 14 exams.
Updated on:21/07/2023Topper's Solved these Questions
Similar Questions
An alloy of gold and silver weighs 50 g. It contains 80% gold. How much gold should be added to the alloy so that percentage of gold is increased to 90? 30 g b. 40 g c. 50 g d. 60
View SolutionFind the area of the figure given below.

View SolutionThe area of the shaded part in the figure given below is ______.

View SolutionThe inequation represented by the graph given below is :
View SolutionThe inequation that best describes the graph given below is _________
View SolutionThe inequation that best describes the following graph is _________
View SolutionWhich inequations represent the shaded region in the given figure
View Solution
