Which of the following graphs correctly represents the relation between In (E) and In (T), where E is the amount of radiation emitted per unit time from a unit area of the body and T is the absolute temperature ?
A

B

C

D

Video Solution
Text Solution
The correct Answer is:C
We know
E=eT4
⇒ln E=ln e+4ln T
∴ ln e is negative
because e < 1

|
Similar Questions
Knowledge Check
The amount of heat enerrgy radiated per unit time per unit area by a body depends upon
Aarea of the bodyBtemperature and nature of the bodyCnature of the body onlyDall of theseWhich one of the following correctly represents the variation between linear momentum (P) and kinetic energy (E) ofa body?
A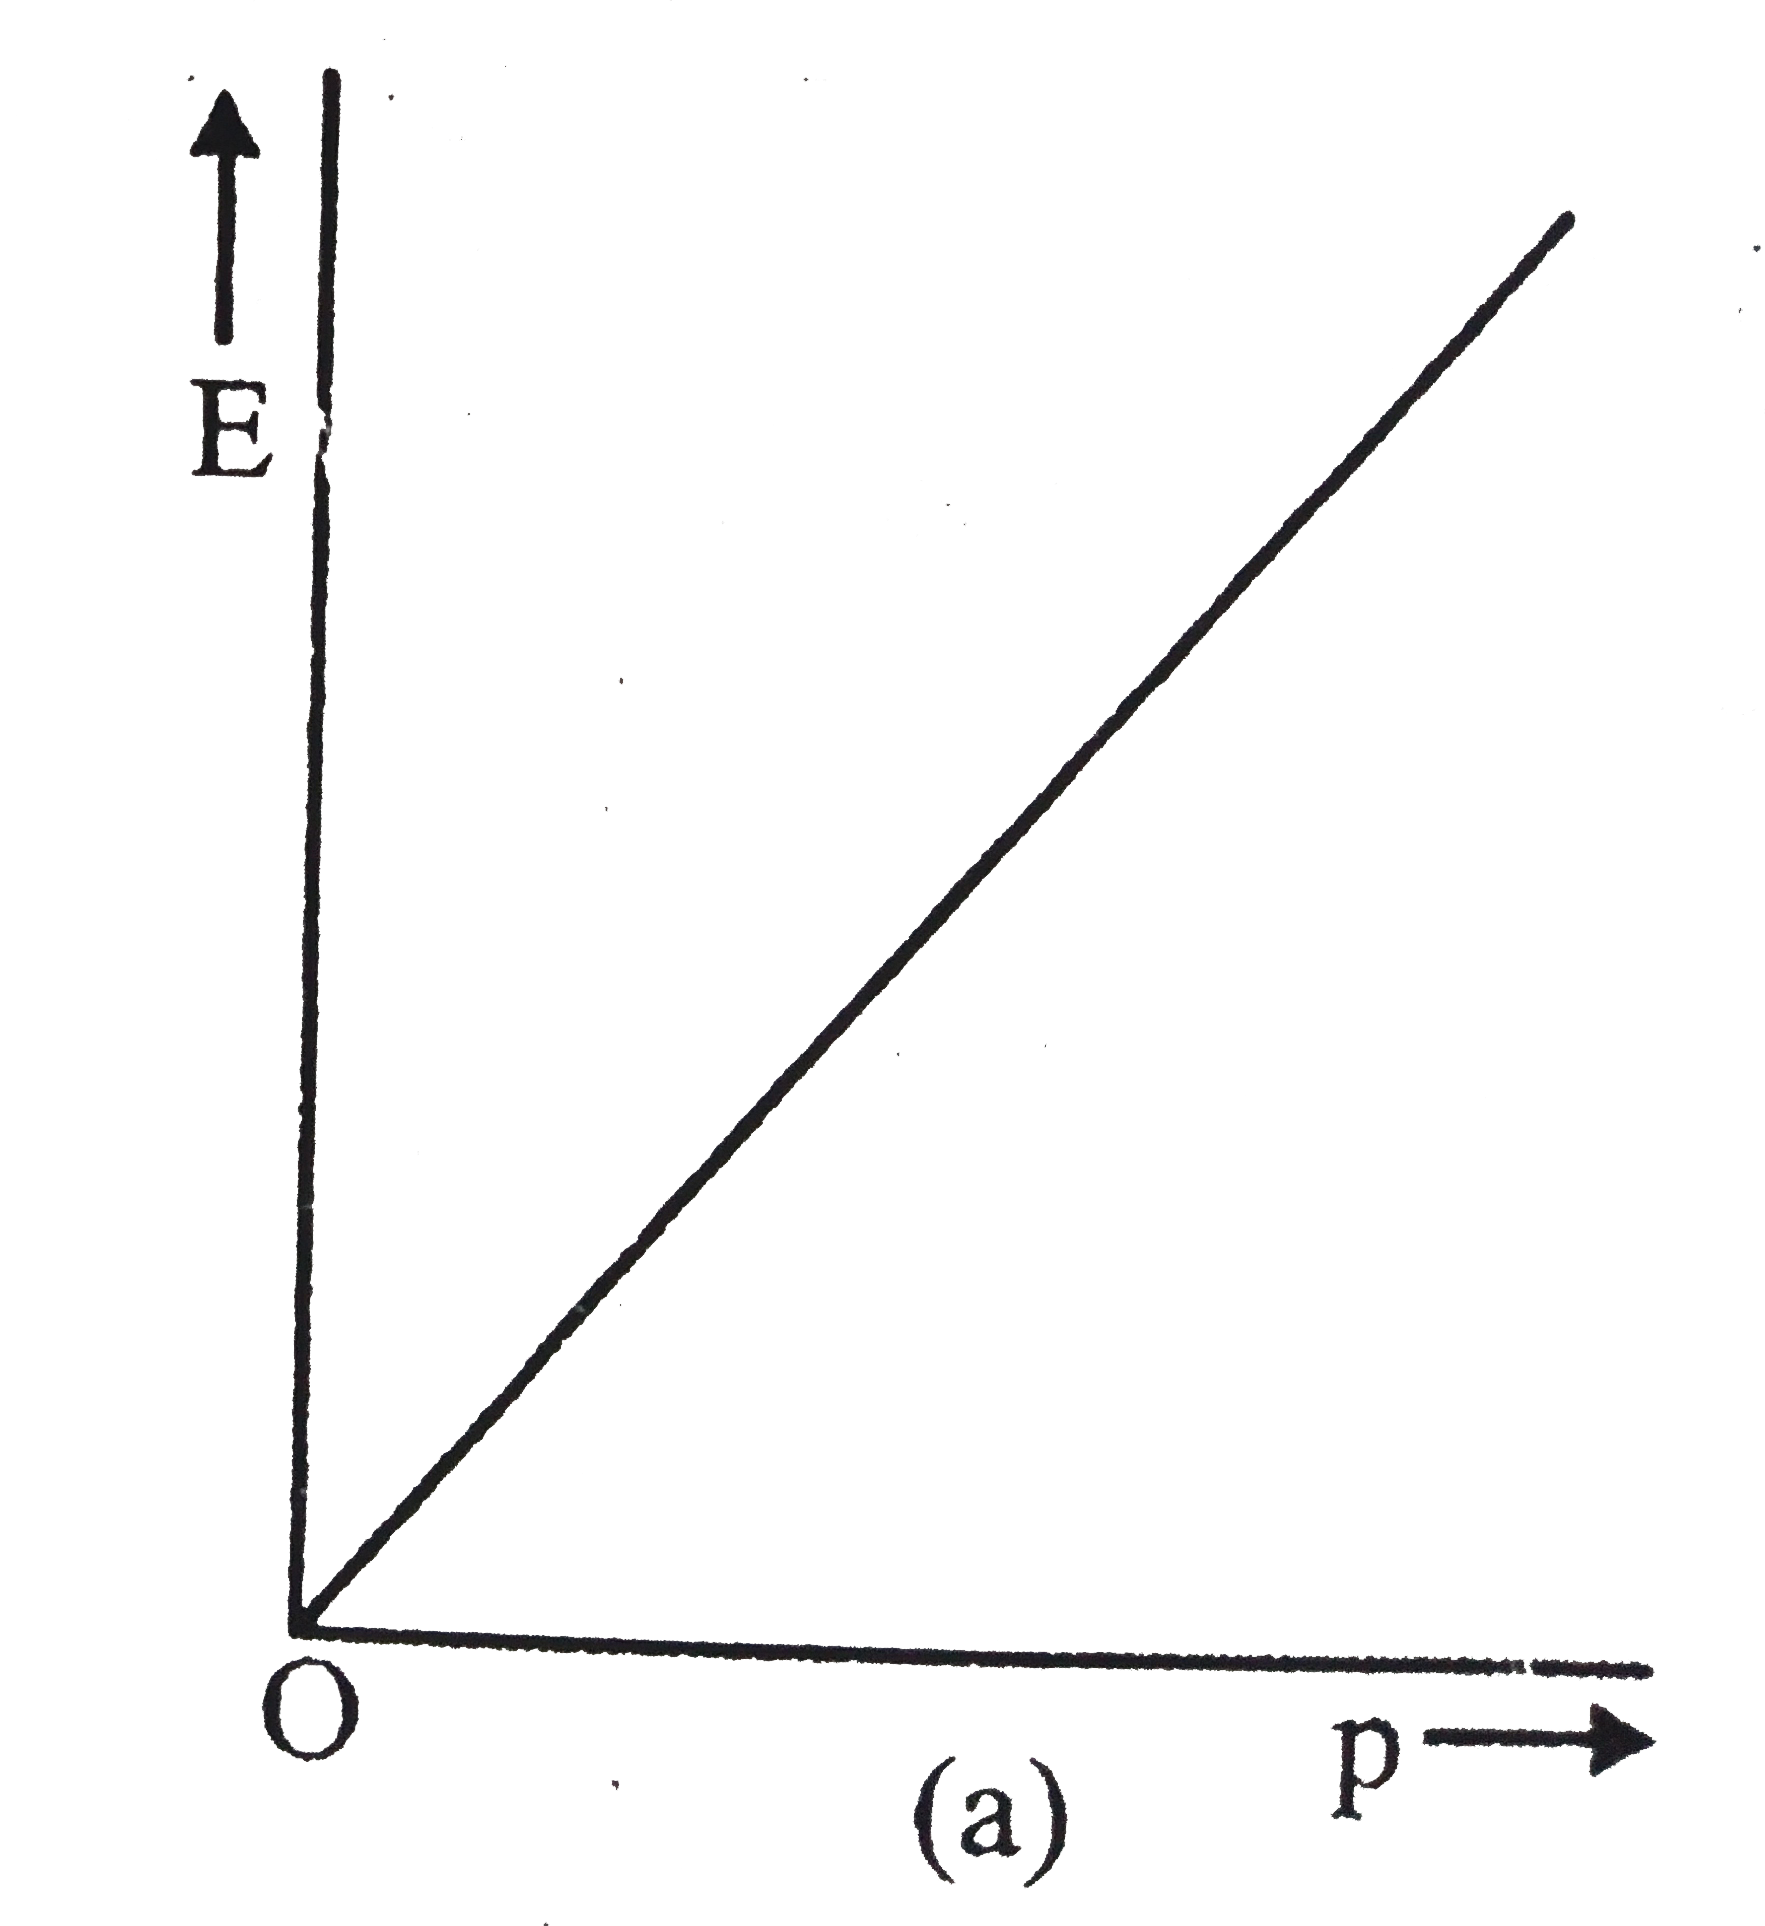 B
B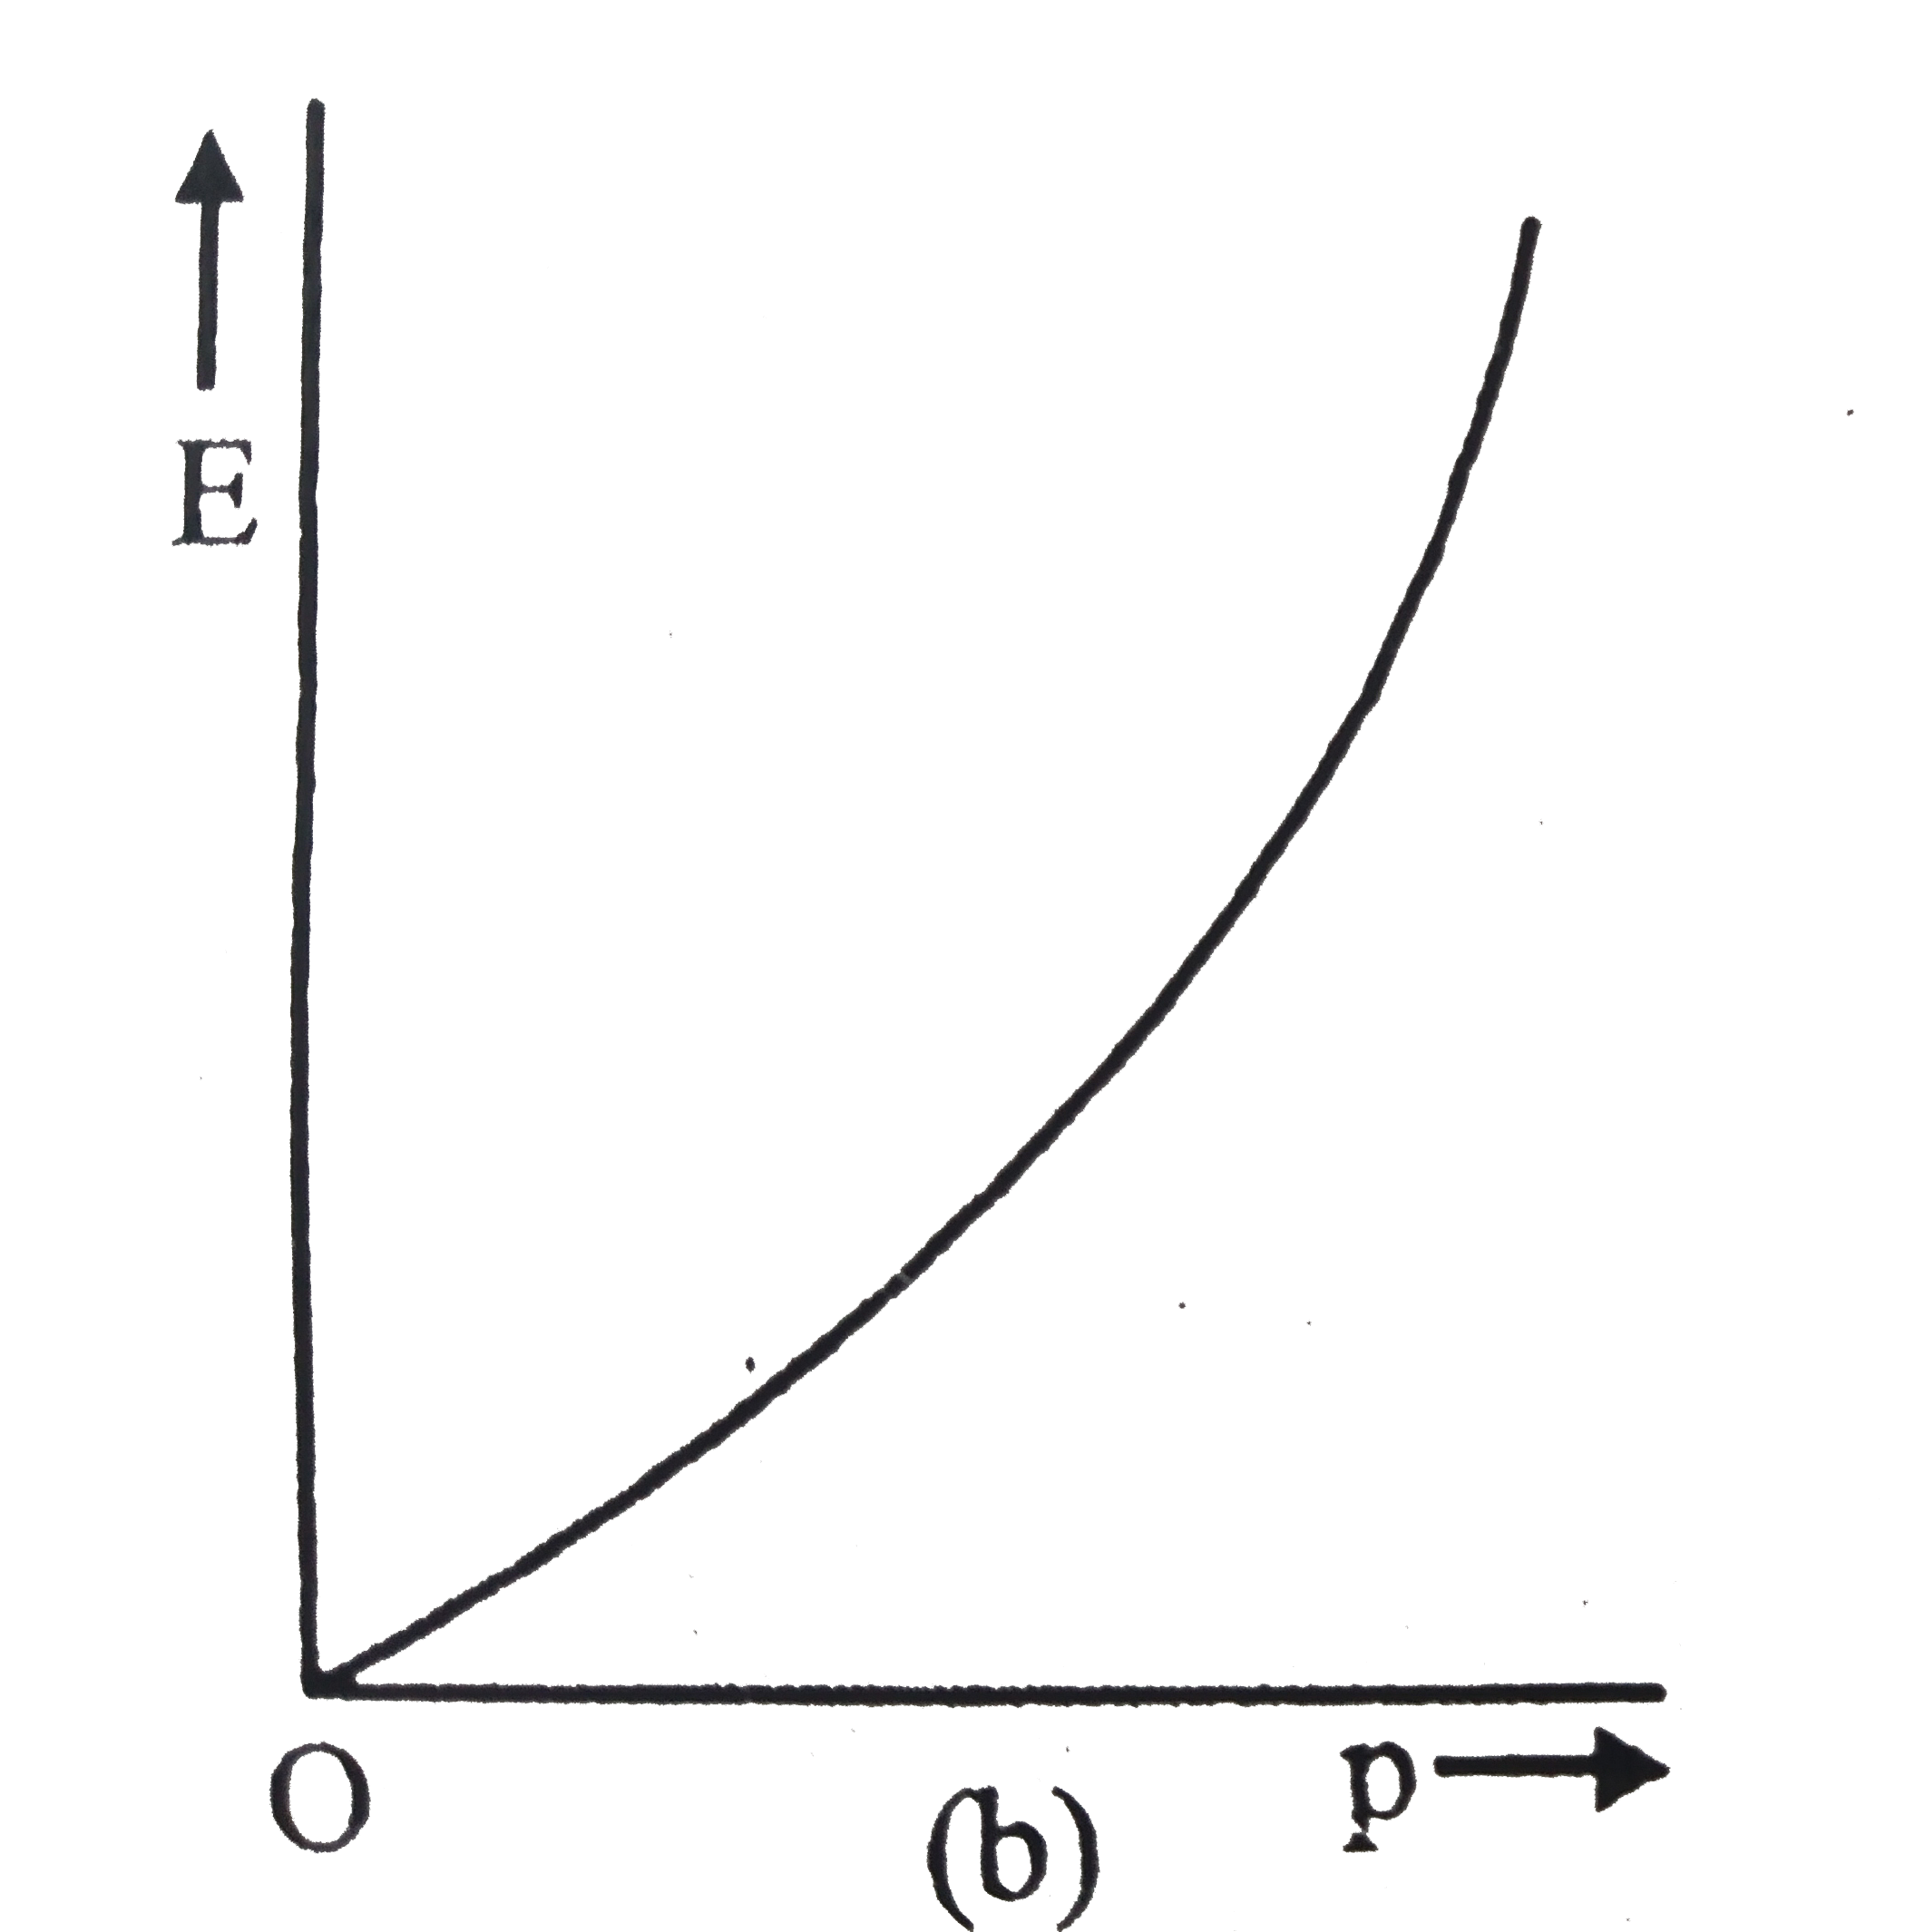 C
C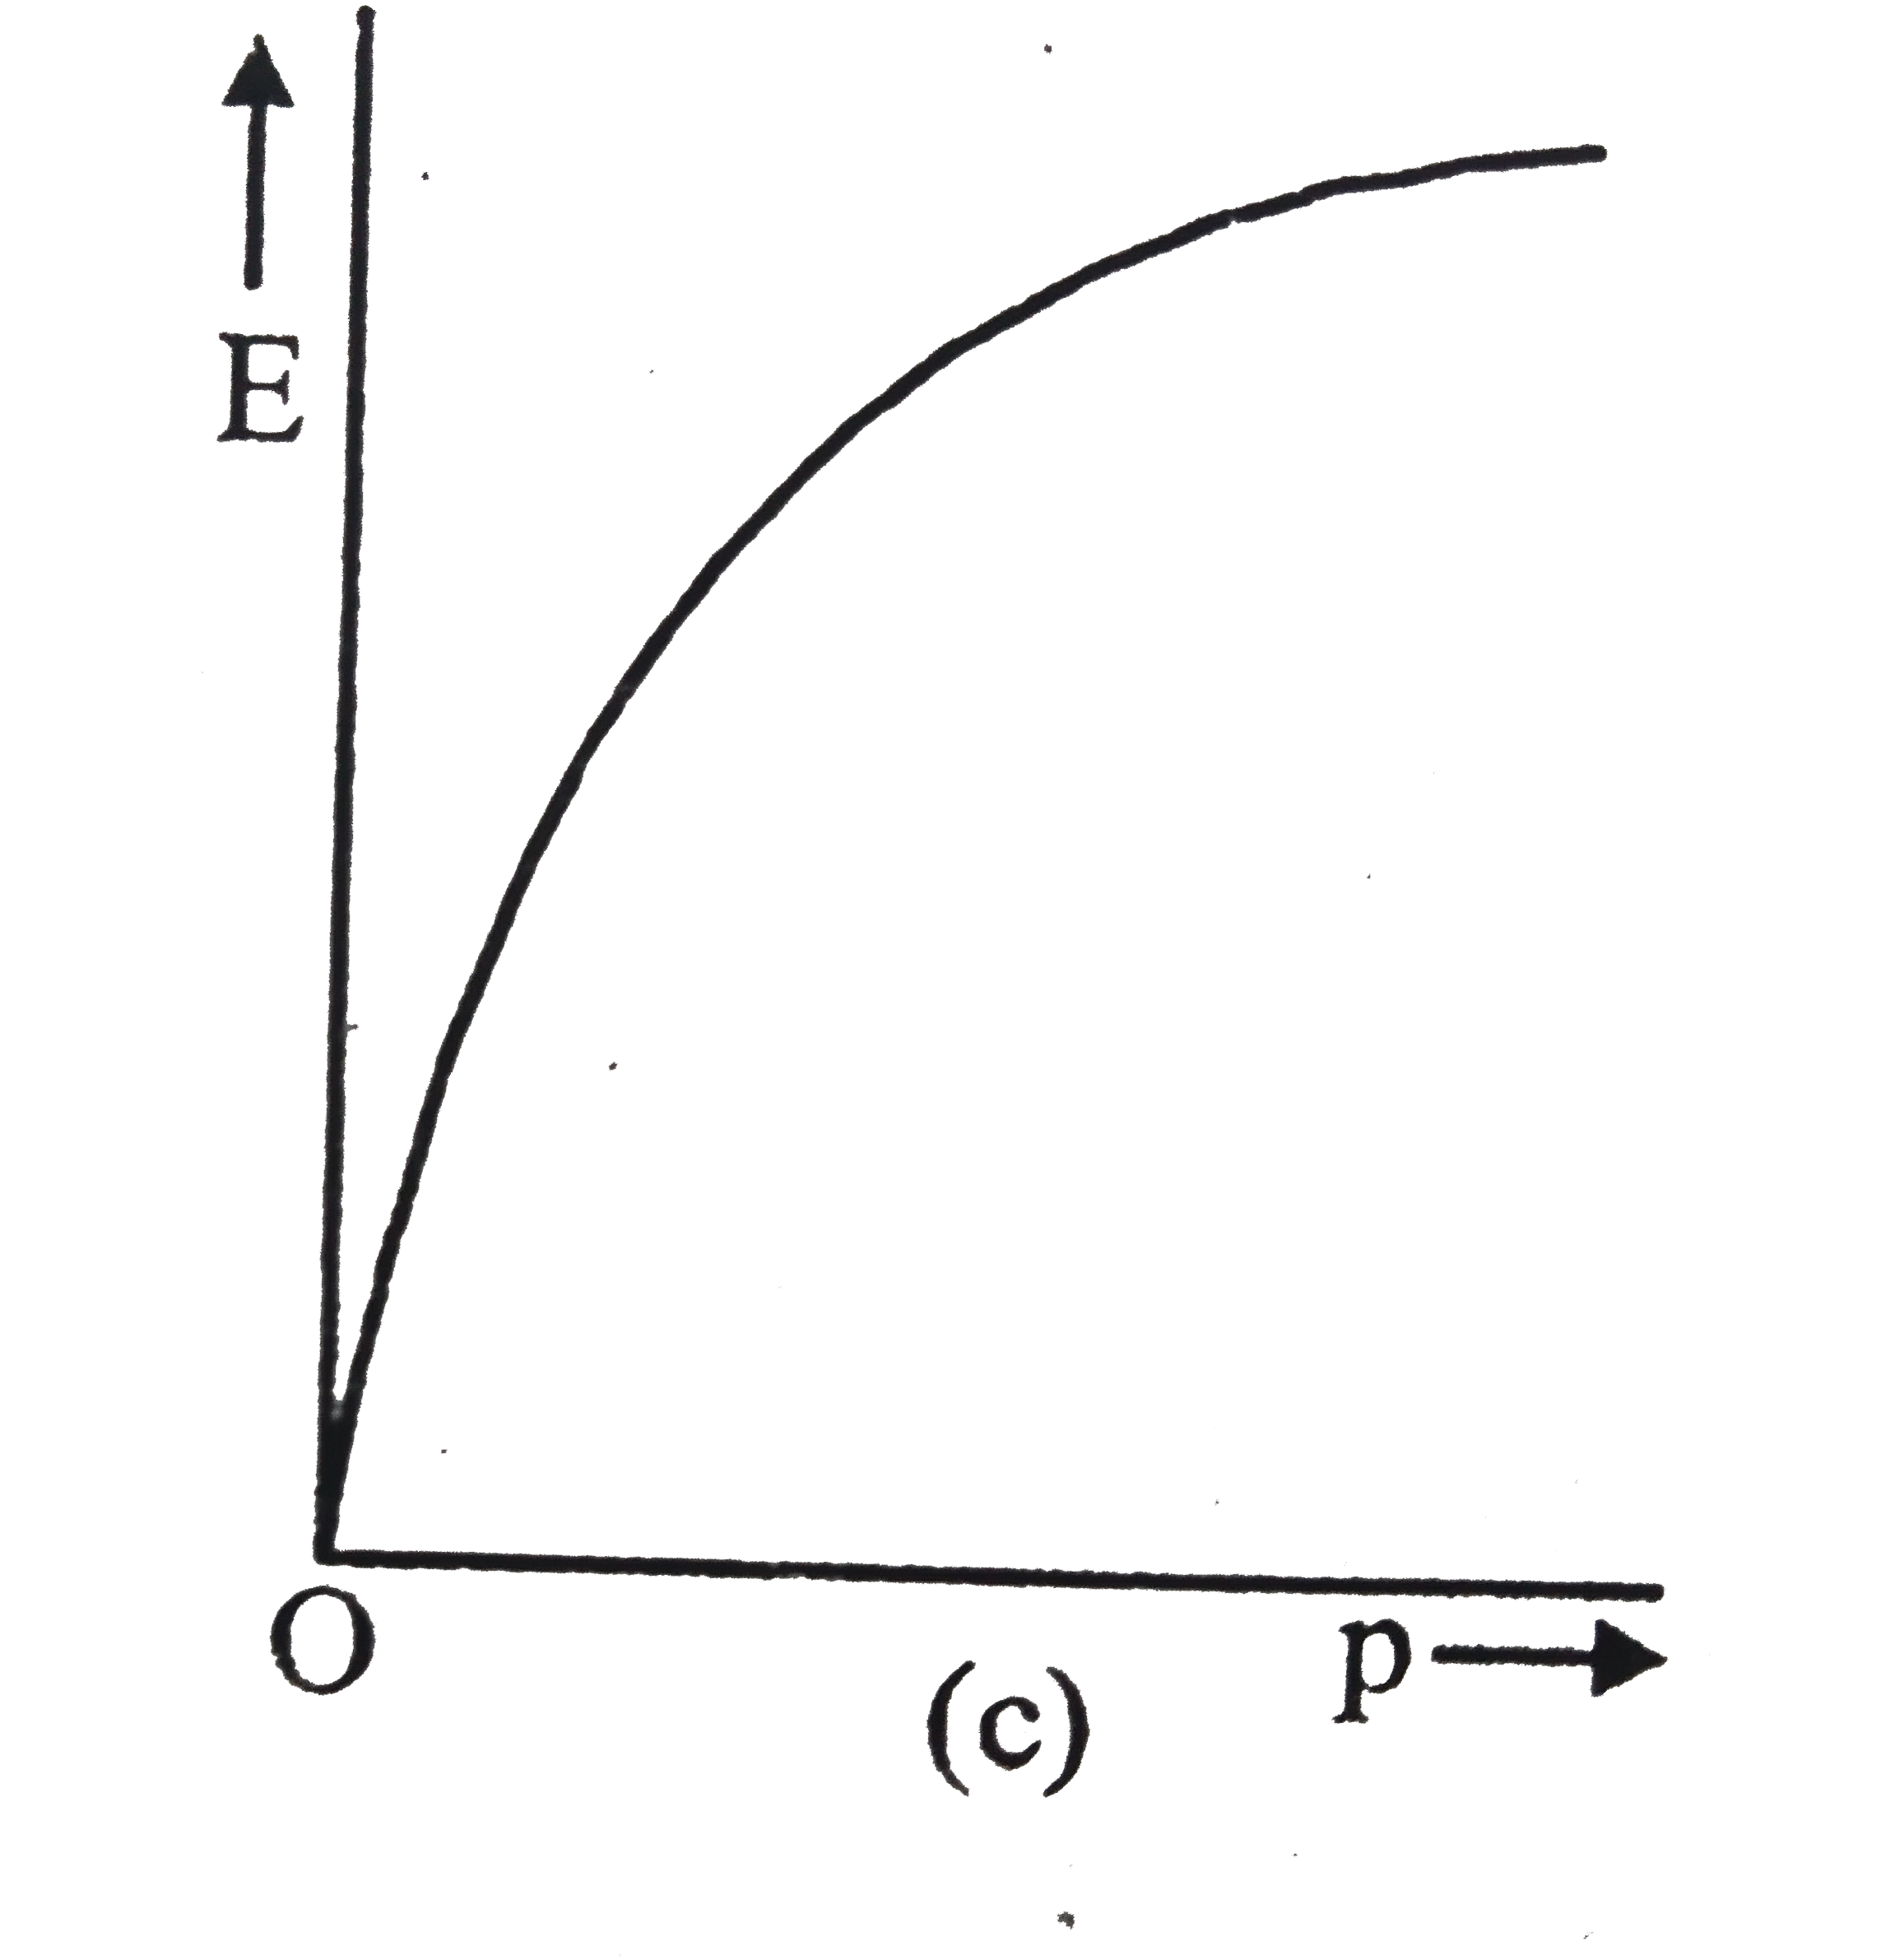 D
D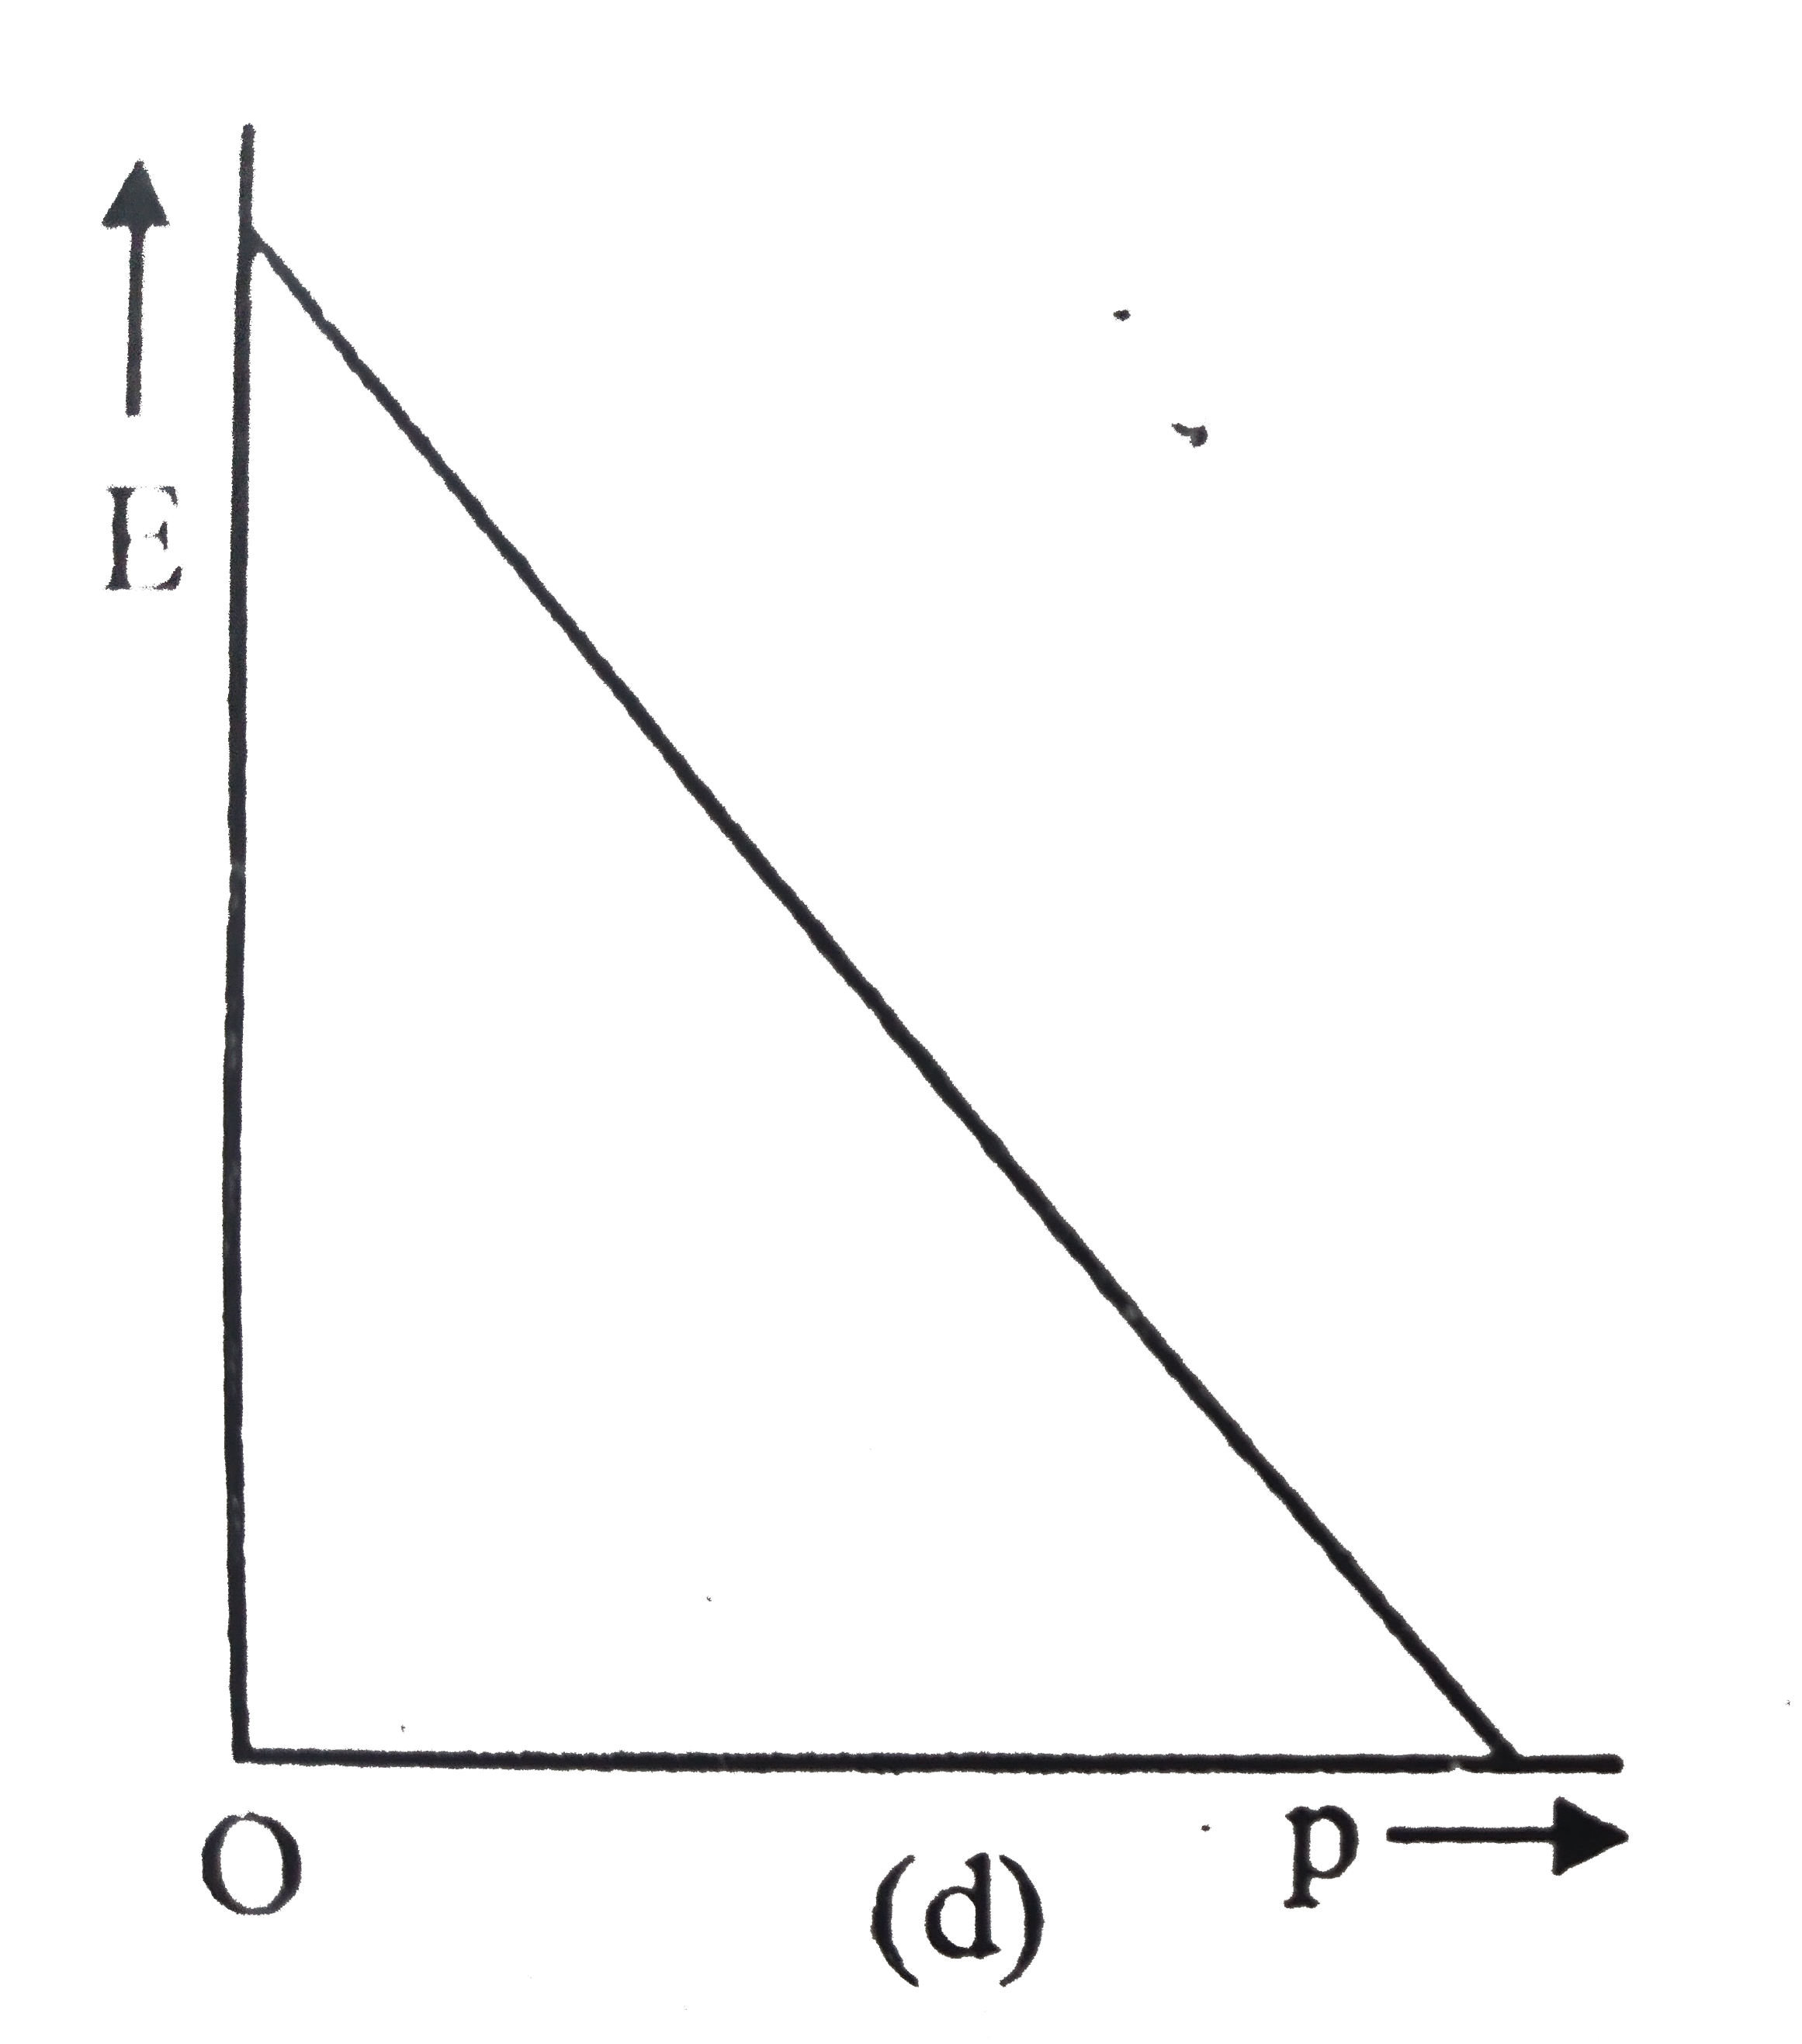
which of the following graphs correctly represents the vatiation β=−(dVdP)T/V with P for an ideal gas at constant temperature ? .
A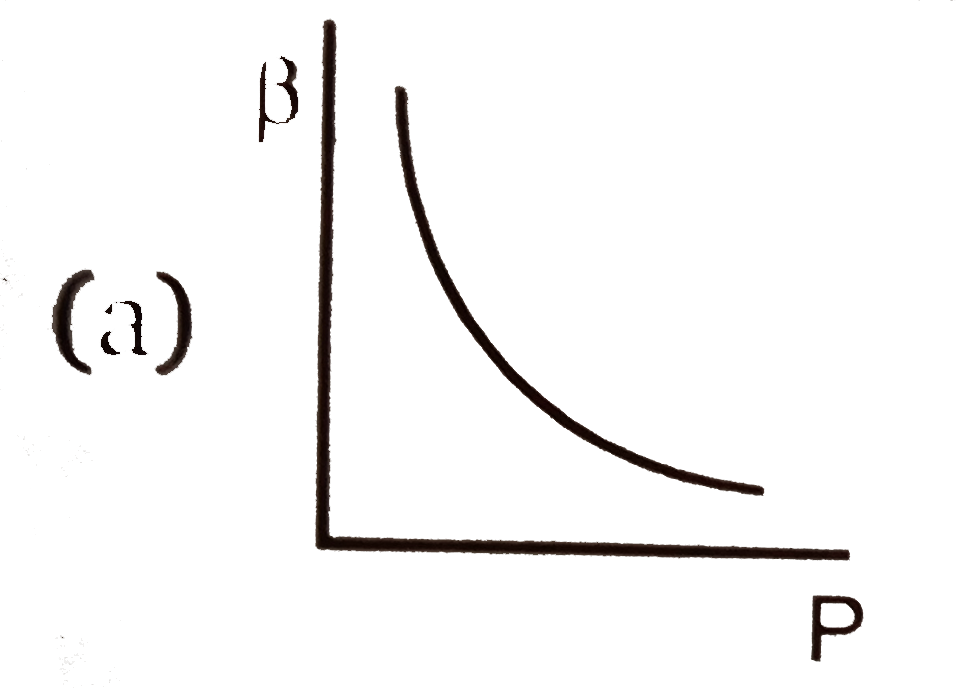 B
B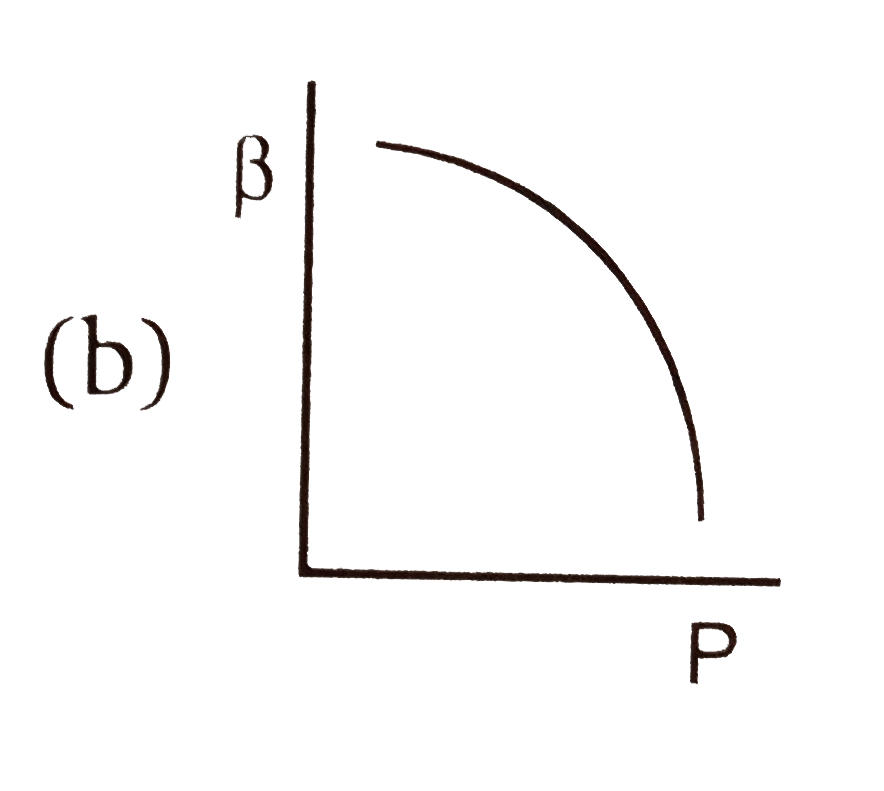 C
C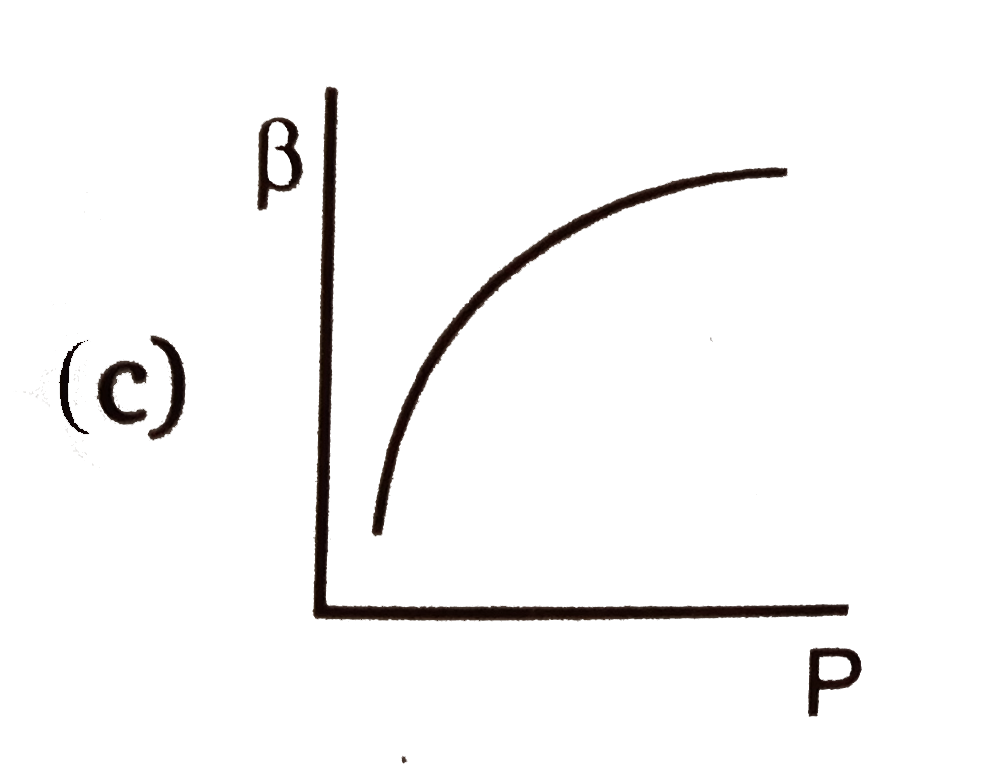 D
D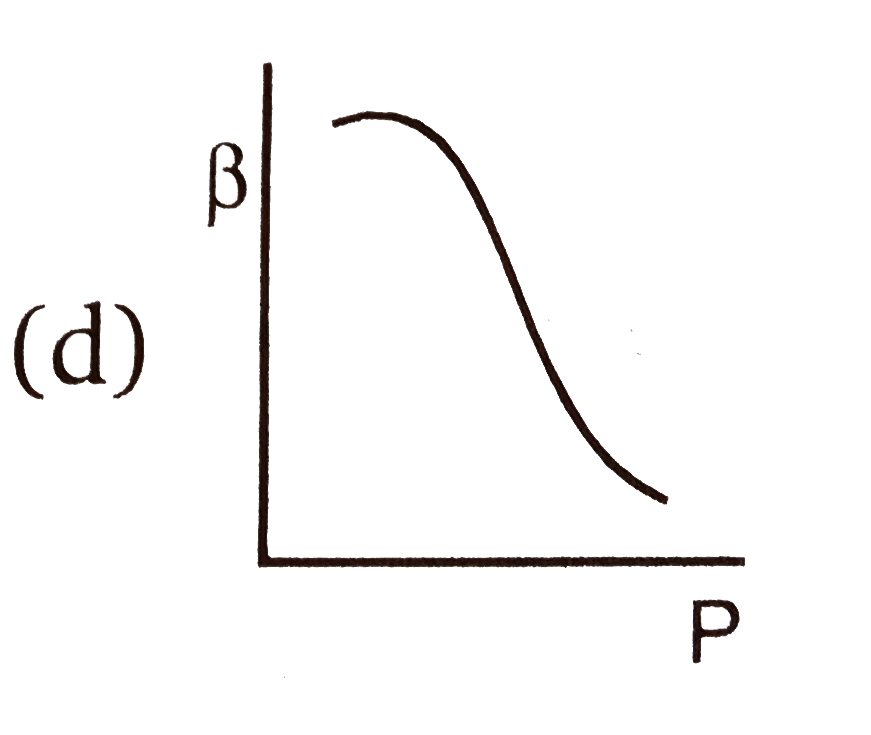
The amount of radiations emitted per second by unit area of a hollow container at 103∘ K will be-
View Solutionwhich of the following graph represents the variation of resistivity (ρ) with temperature (T) for copper?
View SolutionWhich of following graphs correctly represent variation of α=−(dV/dP)TV with P for fixed amount of an ideal gas at constant temperature ?
View SolutionWhich of the following graphs represents the variation of activity (A) of a radioactive substance with time (t).
View SolutionThe amount of thermal radiations emitted from one square metre area of a black body in one second when at a temperature of 100 K is
View Solution

