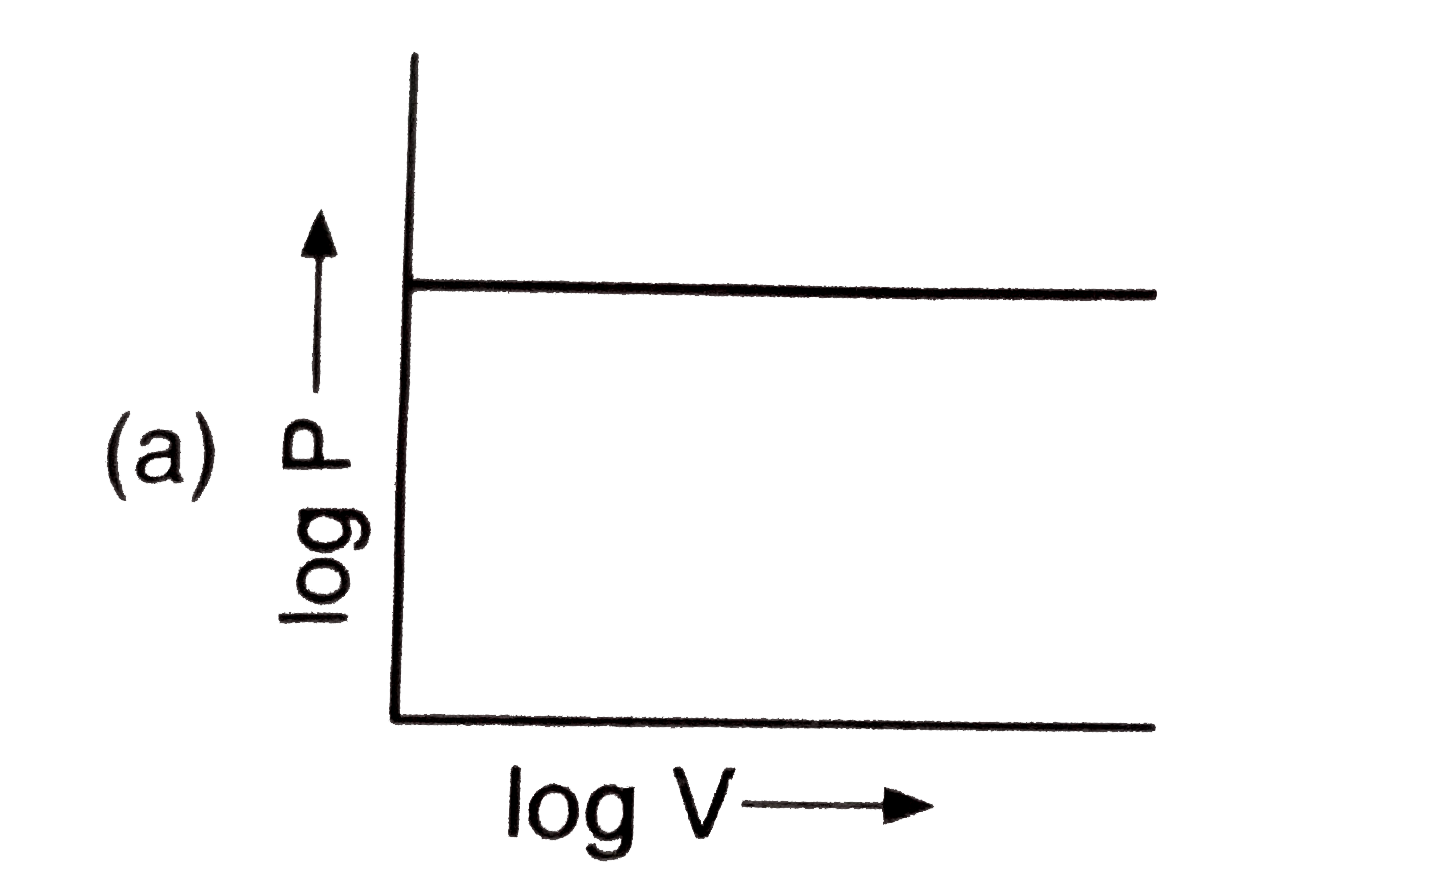
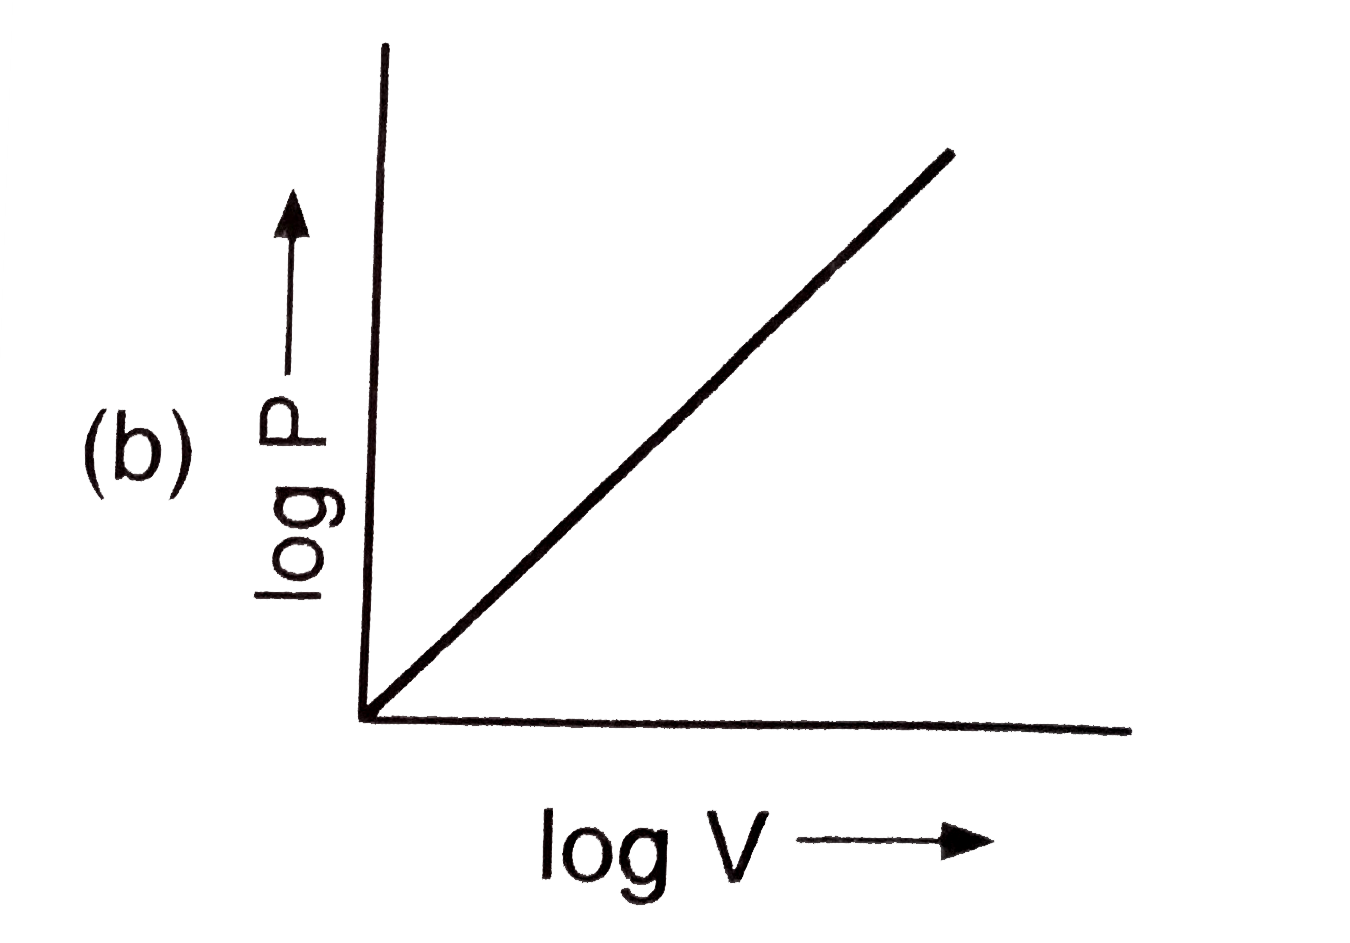
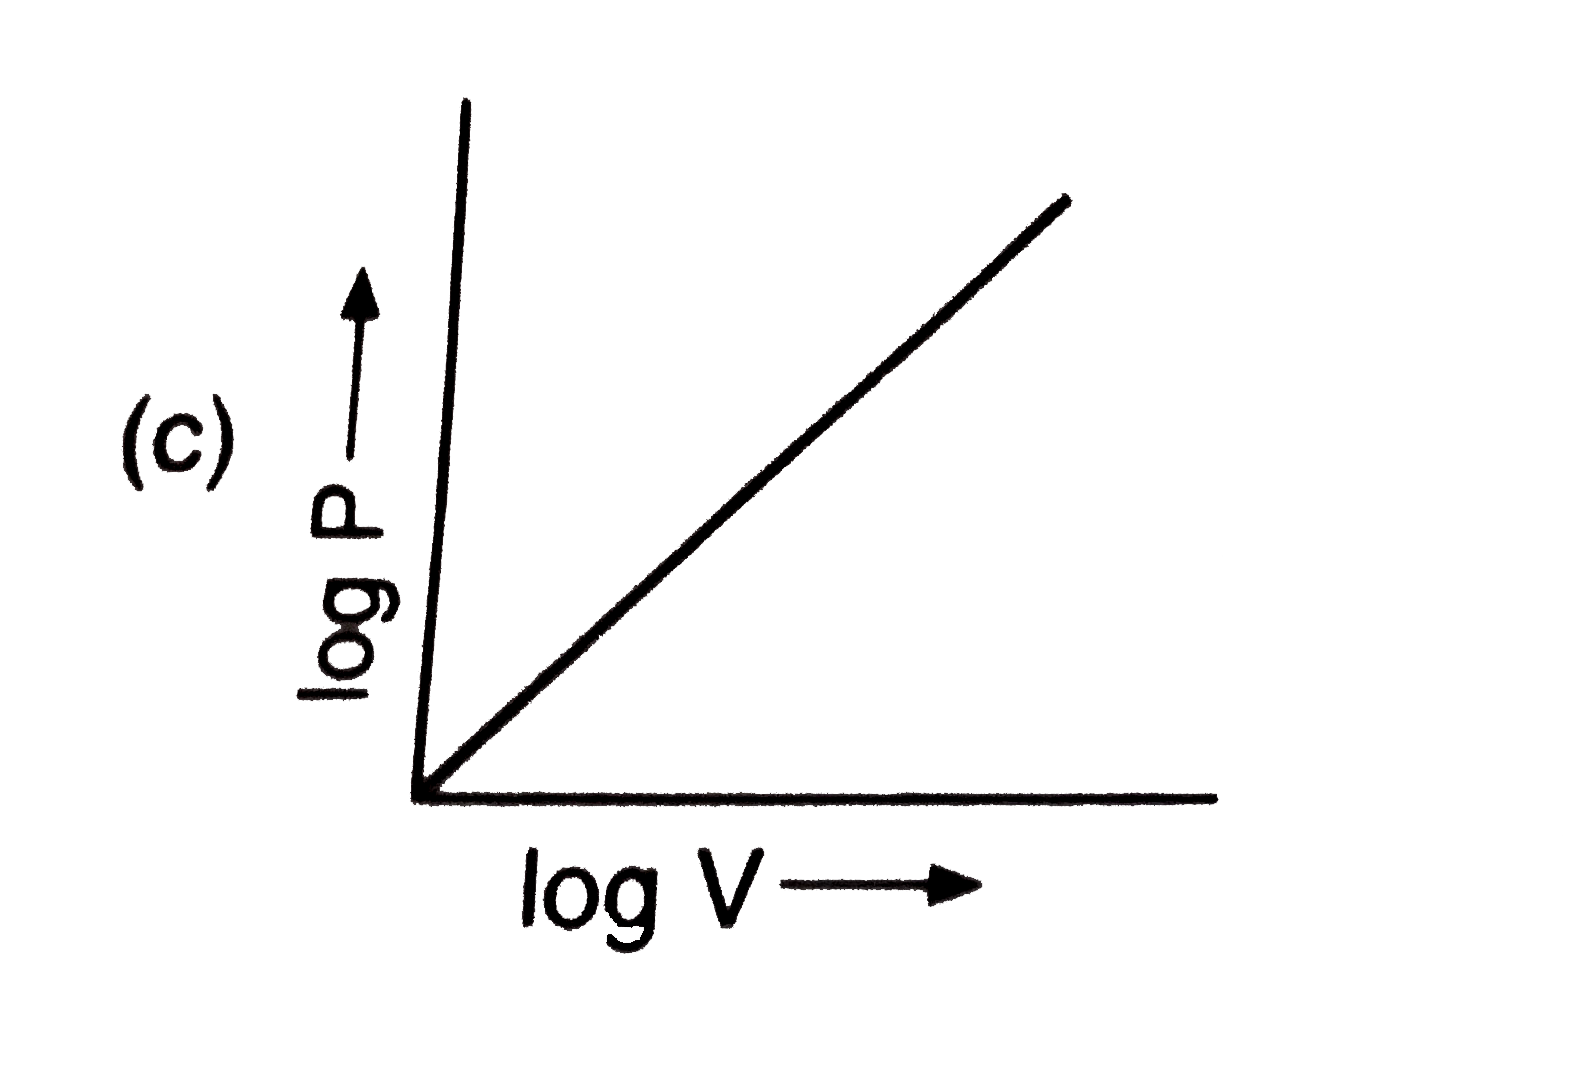
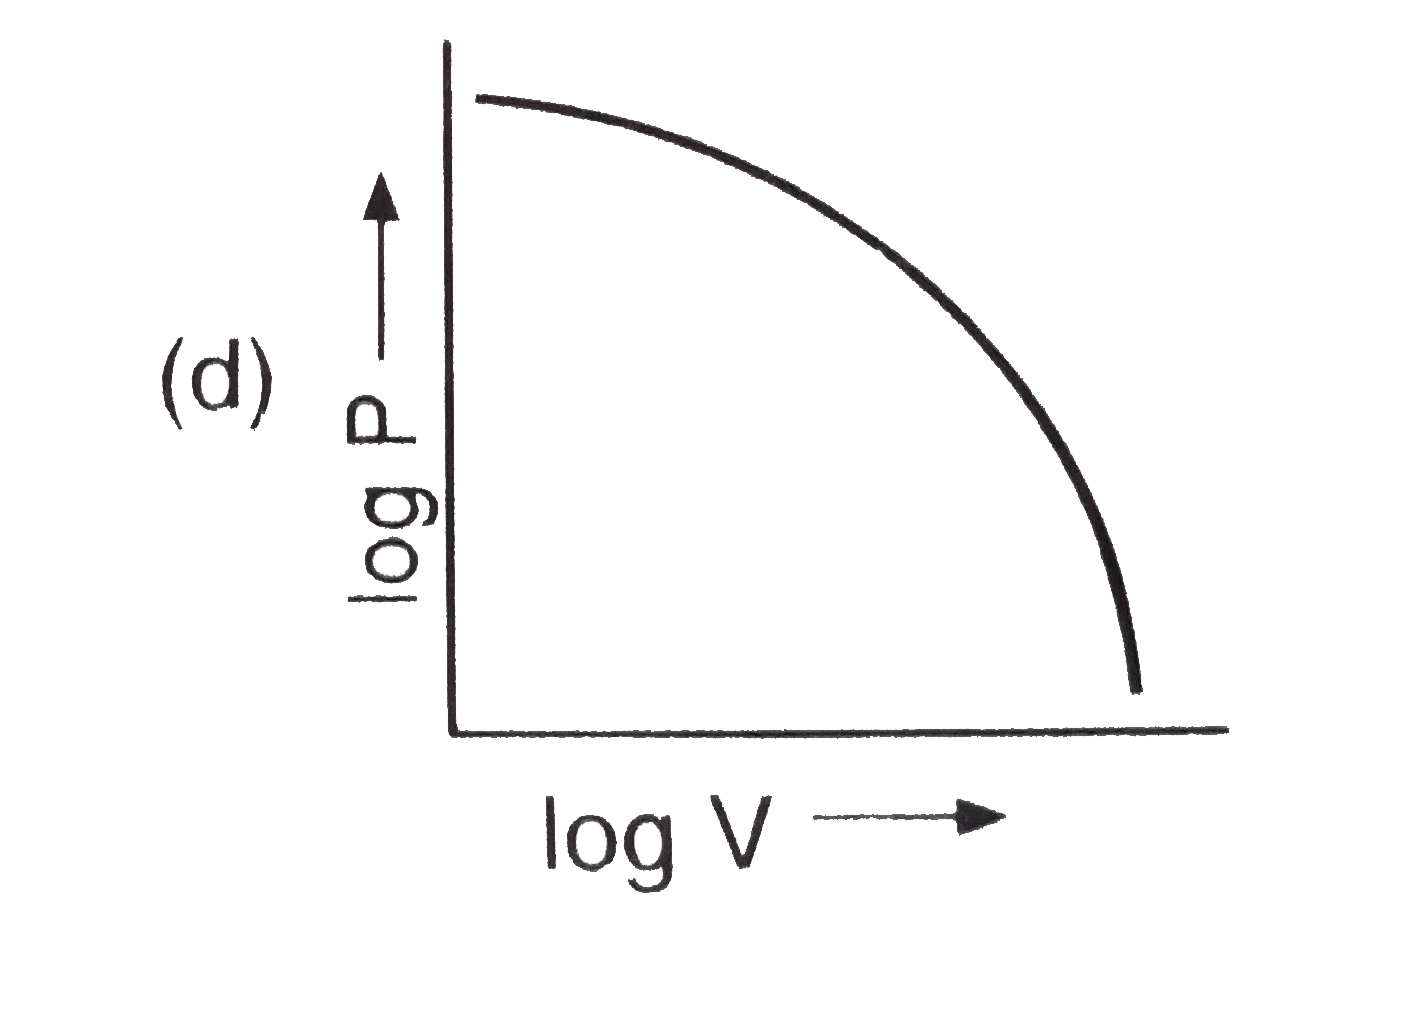
For 1 mol ofan ideal gas at a constant temperature T, the plot of (log P) against (log V) is a (P: Pressure, V: Volume)
Straight line parallel to x-axis.
Straight line with a negative slope.
Curve starting at origin.
Straight line passing through origin.
The correct Answer is:B
According to Boyle.s law, PV = constant
∴logp+logV =constant
logP=-logV+ constant
Hence, the plot of logP vs log V is straight line with negative slope.

Similar Questions
Knowledge Check
For the adsorption of a gas on a solid, the plot of log (x/m) against log P will have a intercept of
AhBlog KCnD1/nThe plot of log V against log P at constant temperature for a fixed mass of gas is :
A B
B C
C D
D
An inflated rubber balloon contains one mole of an ideal gas has a pressure p, volume V and temperature T. if the temperature rises to 1.1 T, and the volume is increased to 1.05 V, the final pressure will be
A1.1pBpCless than pDbetween p and 1.1p
Which one of the following is the correct PV vs P plot at constant temperature for an ideal gas ? (P and V stand for pressure and volume of the gas respectively)
View SolutionIf x gram of gas is adsobed by m gram of adsorbent at pressure P the plot of log xm versus log P is linear .the slope of the plot is :
(n and k are constant and n > 1)
View SolutionThe slope of the graph between log P and log V at constant temperature for a given mass of gas is
View SolutionAn inflated rubber ballon contains one mole of an ideal gas , has a pressure P, volume V and temperature T. If the temperature rises to 1.1 T, and the volume isincreased to 1.05 V, the final pressure will be
View SolutionFor a closed container containing 10 moles of an ideal gas, at constant pressure of 0.82 atm, which graph correctly represent, variation of log V us log T where volume is in litre and temp. in kelvin :
View Solution

