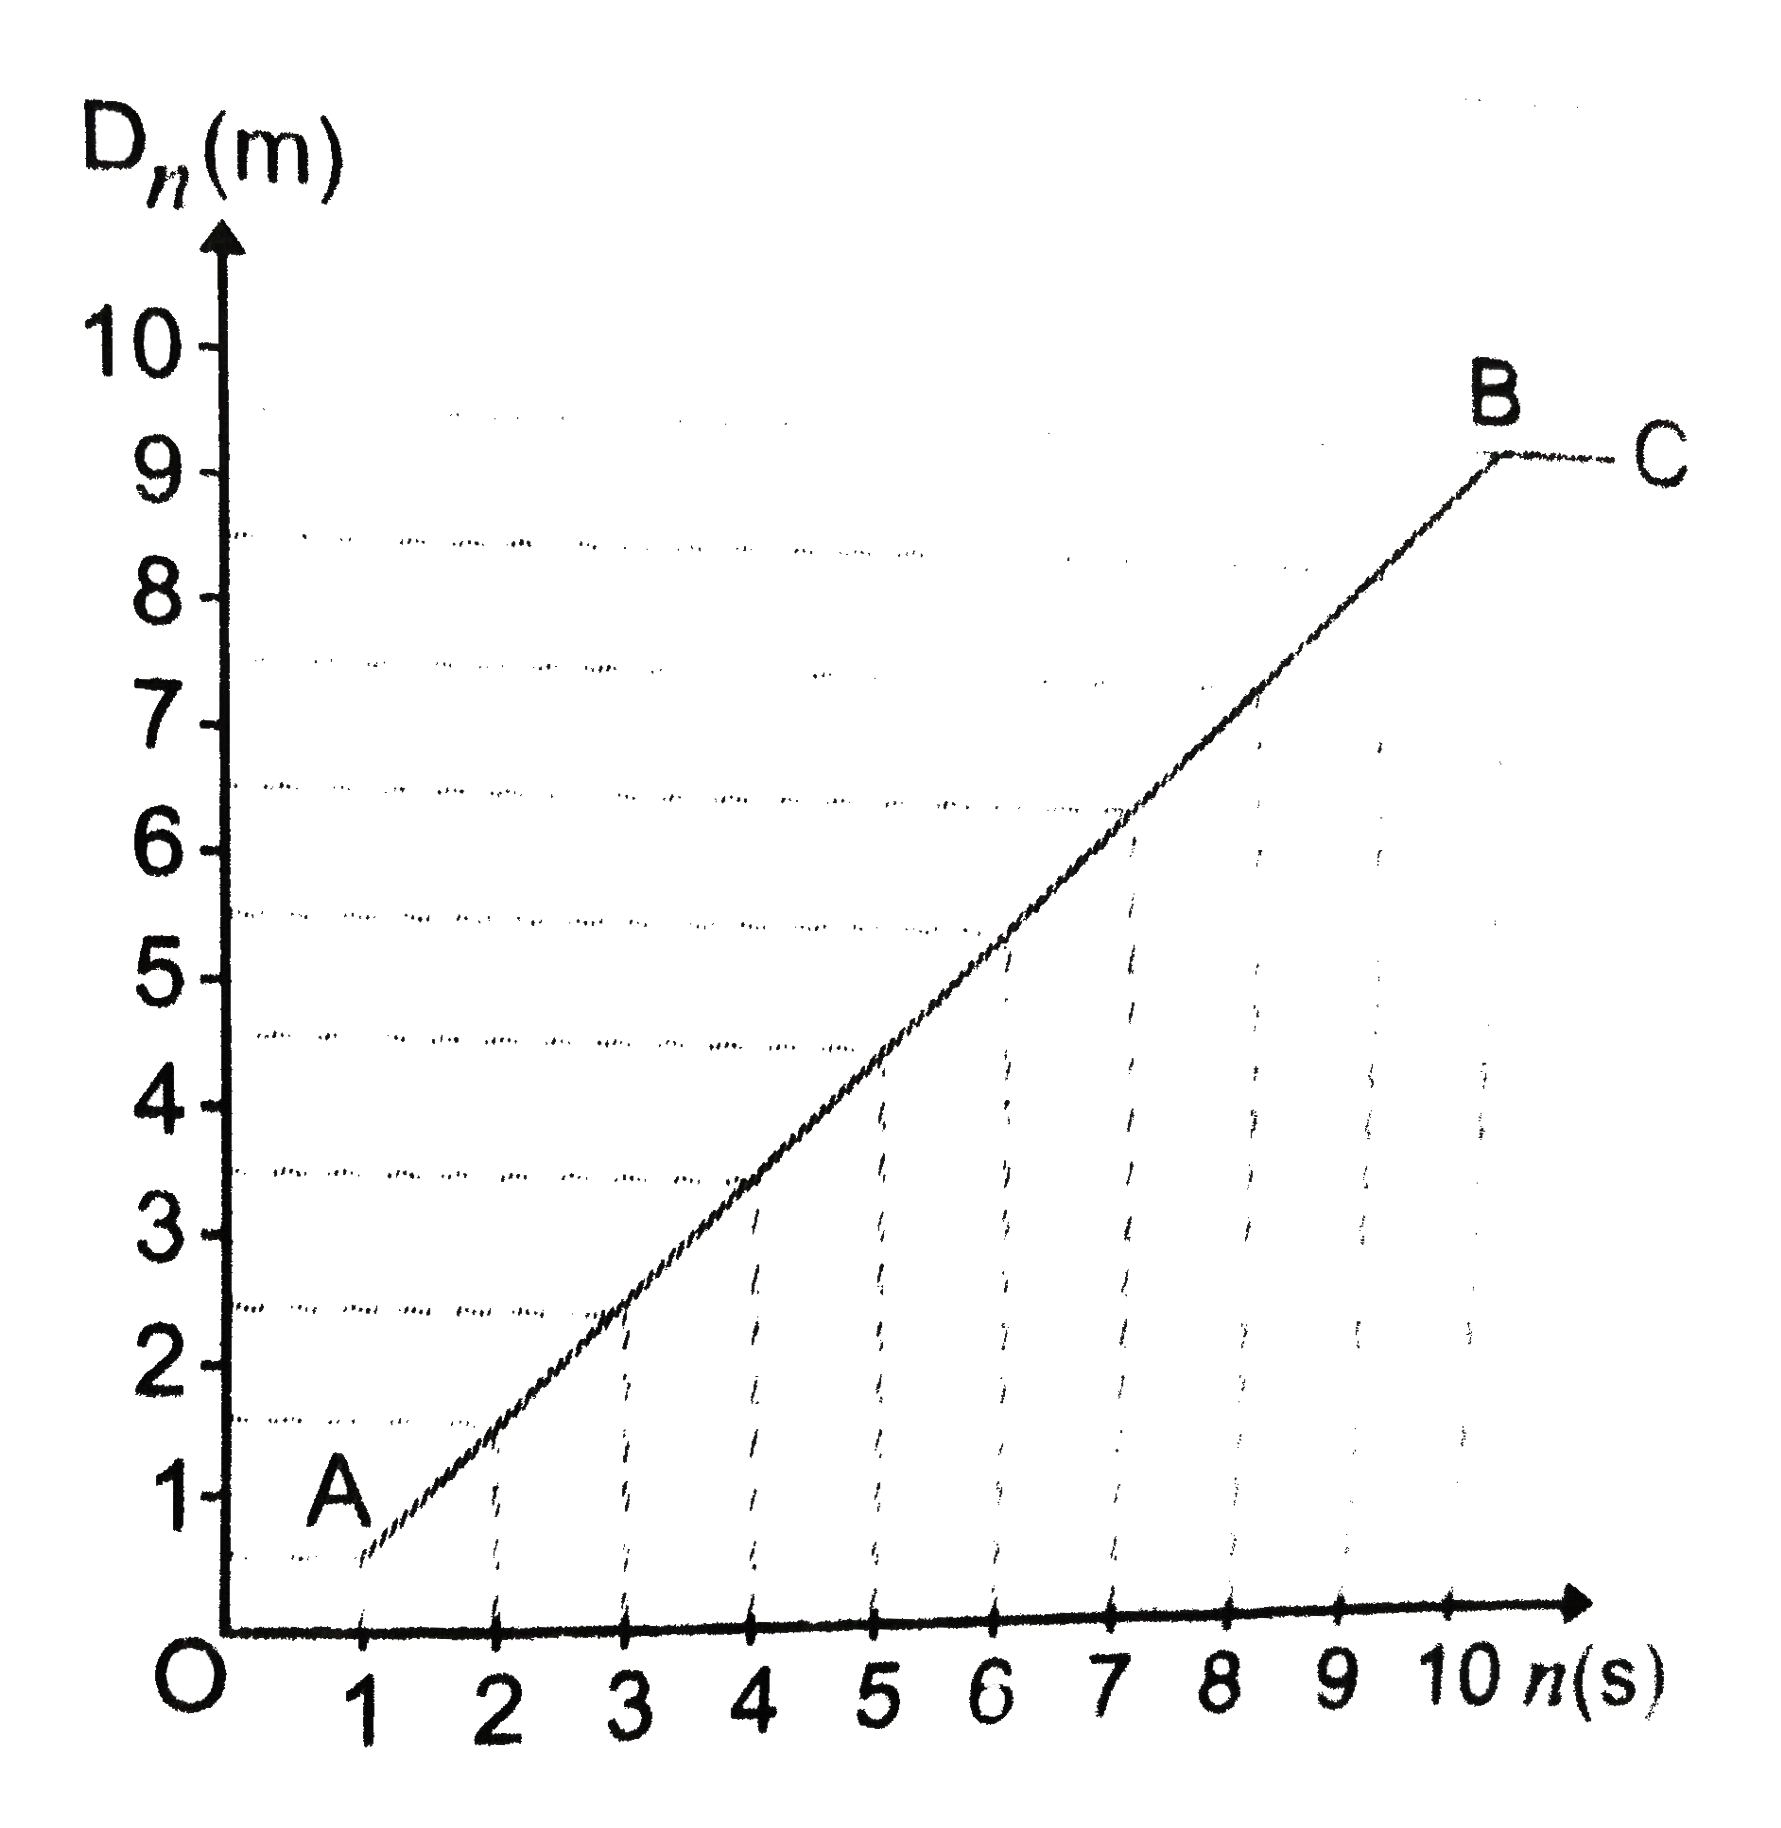
A three wheeler starts from rest, accelerates uniformly with 1ms−2 on a straight road for 10s and then moves with uniform velocity . Plot a graph between the distance covered by the vehicle during the nth second ( n = 1,2,3, ……..) versus (n) What do you expect the plot to be during accelerated motion: a straight line or a parabola ?
 .
.
As u=0, a=1ms−2
Dn=distance covered in nth sec =u+a2(2n−1)
=0+12(2n−1)
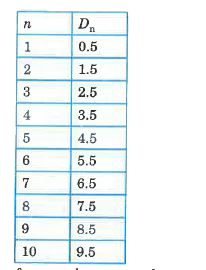
By putting n=1,2,3, . . . . . We can get different values of Dn like

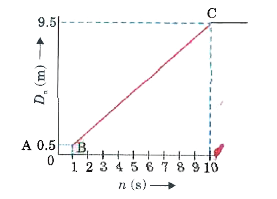
As Dn∝n, therefore graph comes to be a straight line BC upto t=10 sec. After 10sec., the graph is a straight line CD parallel to time axis as shown.

Similar Questions
A three-wheeler starts from rest, accelerates uniformly with 1ms−2 on a straight road for 10 s, and then moves with uniform velocity. Plot the distance covered by the vehicle during the nth second (n = 1,2,3….) versus n. What do you expect this plot to be during accelerated motion : a straight line or a parabola ?
View SolutionA three-wheeler starts from rest, accelerates uniformly with 1ms−2 on a straight road for 10 s, and then moves with uniform velocity. Plot the distance covered by the vehicle during the nth second (n = 1,2,3….) versus n. What do you expect this plot to be during accelerated motion : a straight line or a parabola ?
View SolutionA three wheeler starts from rest, accelerates uniformly with 1 ms^(-2) on a straight road for 10 s and then moves with uniform velocity. Plot a graph between the distance covered by the vehicle during the n_(th) second ( n = 1,2,3, ……..) versus n. What do you expect the plot to be during accelerated motion: a straight line or a parabola? .
View SolutionA three wheeler starts from rest, accelerates uniformly with 1 ms-2 on a straight road for 10 s and then moves with uniform velocity. Plot the distance covered by the vehicle during the nth second (n = 1, 2, 3, ...) versus n. What do you expect this plot to be during accelerated motion : a straight line or a parabola ?
View SolutionA particle moving along a straight line with initial velocity u and acceleration a continues its motion for n seconds. What is the distance covered by it in the last nth second ?
View SolutionA car starts from rest and moves with constant acceleration. The ratio of the distance covered in the nth second to that covered in n seconds is
View SolutionA body starts from rest and moves with a uniform acceleration. The ratio of the distance covered in the nth sec to the distance covered in n sec is
View SolutionA three-wheeler starts from rest, accelerates uniformly with 1 ms^(-2) on a straight road for 10 s and then moves with uniform velocity. Plot the distance covered by the vehicle during the n^(th) second (n = 1, 2, 3 …………) versus n. What do you expect this plot to be during accelerated motion : a straight line or a parabola ?
View Solution
