Explain the procedure of tabulating and making frequency distribution with the help of an example.
Marks obtained by students in Geography are given below.

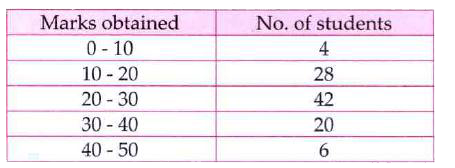
Make a frequency distribution.
Find the difference between the largest and the smallest items. Highest value is 97 and lowest value is 7. Therefore, the difference is 90 (97-7).
Step-2: Keeping in mind the range the class interval will be 10 and classes will be 0-10, 10-20, 20-30, etc.
Step-3: It is to be noted that upper limit is excluded and lower limit is included in the class. i.e. the value 30 will be included in 30-40 not in 20-30.


Conclusions derived from analysis:
(a) The highest number of students lie in the class interval 50-60, i.e. 10.
(b) Only 3 students have got marks between 0-10.
(c) Only 14 students have got marks less than 40%.
(d) 2 students have got marks more than 90.
(e) 48 students have got marks less than 90.
Topper's Solved these Questions
- DATA-ITS SOURCE AND COMPLIATIONBOOK - FULL MARKSCHAPTER - DATA-ITS SOURCE AND COMPLIATIONEXERCISE - ADDITIONAL QUESTION SOLVED (IV. VIVA-VOCE QUESTIONS)
8 Videos
- DATA-ITS SOURCE AND COMPLIATIONBOOK - FULL MARKSCHAPTER - DATA-ITS SOURCE AND COMPLIATIONEXERCISE - ADDITIONAL QUESTION SOLVED (II. SHORT ANSWER QUESTIONS)
3 Videos
- GRAPHICAL REPRESENTATION OF DATABOOK - FULL MARKSCHAPTER - GRAPHICAL REPRESENTATION OF DATAEXERCISE - TEST ASSIGNMENT
3 Videos
Similar Questions
Find the median marks for the following frequency distribution :

View SolutionFind the median for the given frequency distribution.

View SolutionFor the given frequency distribution find the median.

View SolutionThe frequency distribution of marks obtained by students in a class test is given below .
Draw frequency polygon and ogive.

View SolutionFind the median for the given frequency distribution:

View SolutionFind the mean and variance of the frequency distribution given below

View SolutionThe weights of 20 students in a class are given below.

Find the median of the above frequency distribution .
View SolutionThe median of a frequency distribution is found graphically with the help of
View SolutionFind the variance and SD for the given frequency distribution .

View SolutionThe marks of students of a class are given in following frequency distribution. Find the mean.

View Solution
