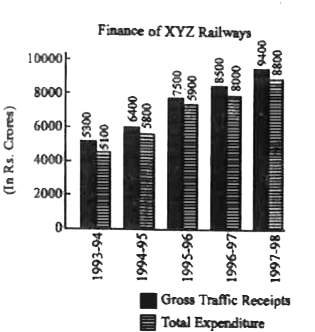
In the following questions are based on the following bar graph,Read the graphs and answer the questions.

By what amount (in Rs. crores) has the expenditure increased over the period 1993-94 to 1997-98?
4100
3900
3850
3700
The correct Answer is:D
Step by step video & image solution for In the following questions are based on the following bar graph,Read the graphs and answer the questions. By what amount (in Rs. crores) has the expenditure increased over the period 1993-94 to 1997-98? by Maths experts to help you in doubts & scoring excellent marks in Class 14 exams.
Updated on:21/07/2023Similar Questions
The inequation that best describes the graph given below is _________
View SolutionThe inequation that best describes the following graph is _________
View SolutionWhich of the following statement is not correc for following straight line graph :-
ltimg src="https://d10lpgp6xz60nq.cloudfront.net/physics_images/ALN_PHY_R04_E01_015_Q01.png" width="80%"gt
View SolutionFrom the following figure, the correct observation is :- ltimg src="https://d10lpgp6xz60nq.cloudfront.net/physics_images/ALN_PHY_R03_E08_015_Q01.png" width="80%"gt
View SolutionMatch the followings (column I with column II)
ltimg src="https://d10lpgp6xz60nq.cloudfront.net/physics_images/NCERT_BIO_XI_C03_E01_011_Q01.png" width="80%"gt
View SolutionMatch the following:
ltimg src="https://d10lpgp6xz60nq.cloudfront.net/physics_images/NCERT_BIO_XI_C04_E01_014_Q01.png" width="80%"gt
View SolutionWhich of the following statement is not correct for following straight line graph :-
ltimg src="https://d10lpgp6xz60nq.cloudfront.net/physics_images/ALN_PHY_R04_E01_015_Q01.png" width="80%"gt
View Solution
