If a graph is plotted between log V and log T for 2 moles of a gas of constant pressure of 0.0821 atm, then which of the following statements are correct?
The curve is straight line with slope -1.
The curve is straight line with slope +1
The intercept on y-axis is equal to 2.
The intercept on y-axis is equal to 0.3010.
PV=nRT
logV=logT+lognRP
slope =1
intercept =lognRP=log[2×0.08210.0821]=0.3010
Topper's Solved these Questions
- STATES OF MATTER (SOLIDS, LIQUIDS AND GASES)Book:MTG-WBJEEChapter:STATES OF MATTER (SOLIDS, LIQUIDS AND GASES)Exercise:WB JEE Previous Years Questions (Category 1: Single Option Correct Type)
Explore 14 Videos
- STATES OF MATTER (SOLIDS, LIQUIDS AND GASES)Book:MTG-WBJEEChapter:STATES OF MATTER (SOLIDS, LIQUIDS AND GASES)Exercise:WB JEE Previous Years Questions (Category 2: Single Option Correct Type)
Explore 3 Videos
- STATES OF MATTER (SOLIDS, LIQUIDS AND GASES)Book:MTG-WBJEEChapter:STATES OF MATTER (SOLIDS, LIQUIDS AND GASES)Exercise:WBJEE/WORKOUT (Category 2: Single Option Correct Type)
Explore 15 Videos
- REDOX EQUILIBRIABook:MTG-WBJEEChapter:REDOX EQUILIBRIAExercise:WB JEE PREVIOUS YEARS QUESTIONS
Explore 5 Videos
- SURFACE CHEMISTRYBook:MTG-WBJEEChapter:SURFACE CHEMISTRYExercise:WB JEE PREVIOUS YEARS QUESTIONS
Explore 3 Videos
Similar Questions
A graph is plotted between logV and logT for 2mol of gas at constant pressure of 0.0821atm. V and T are in litre and K. Which of the following statements are not correct?
(I) The curve is straight line with slope −1.
(II) The curve is straight line with slope +1.
(III) The intercepet on Y−axis is equal to 2.
(IV) The intercepet on Y−axis is equal to 0.3010.
View SolutionA graph is plotted between log (x/m) and log p according to the equation xmkp1/n
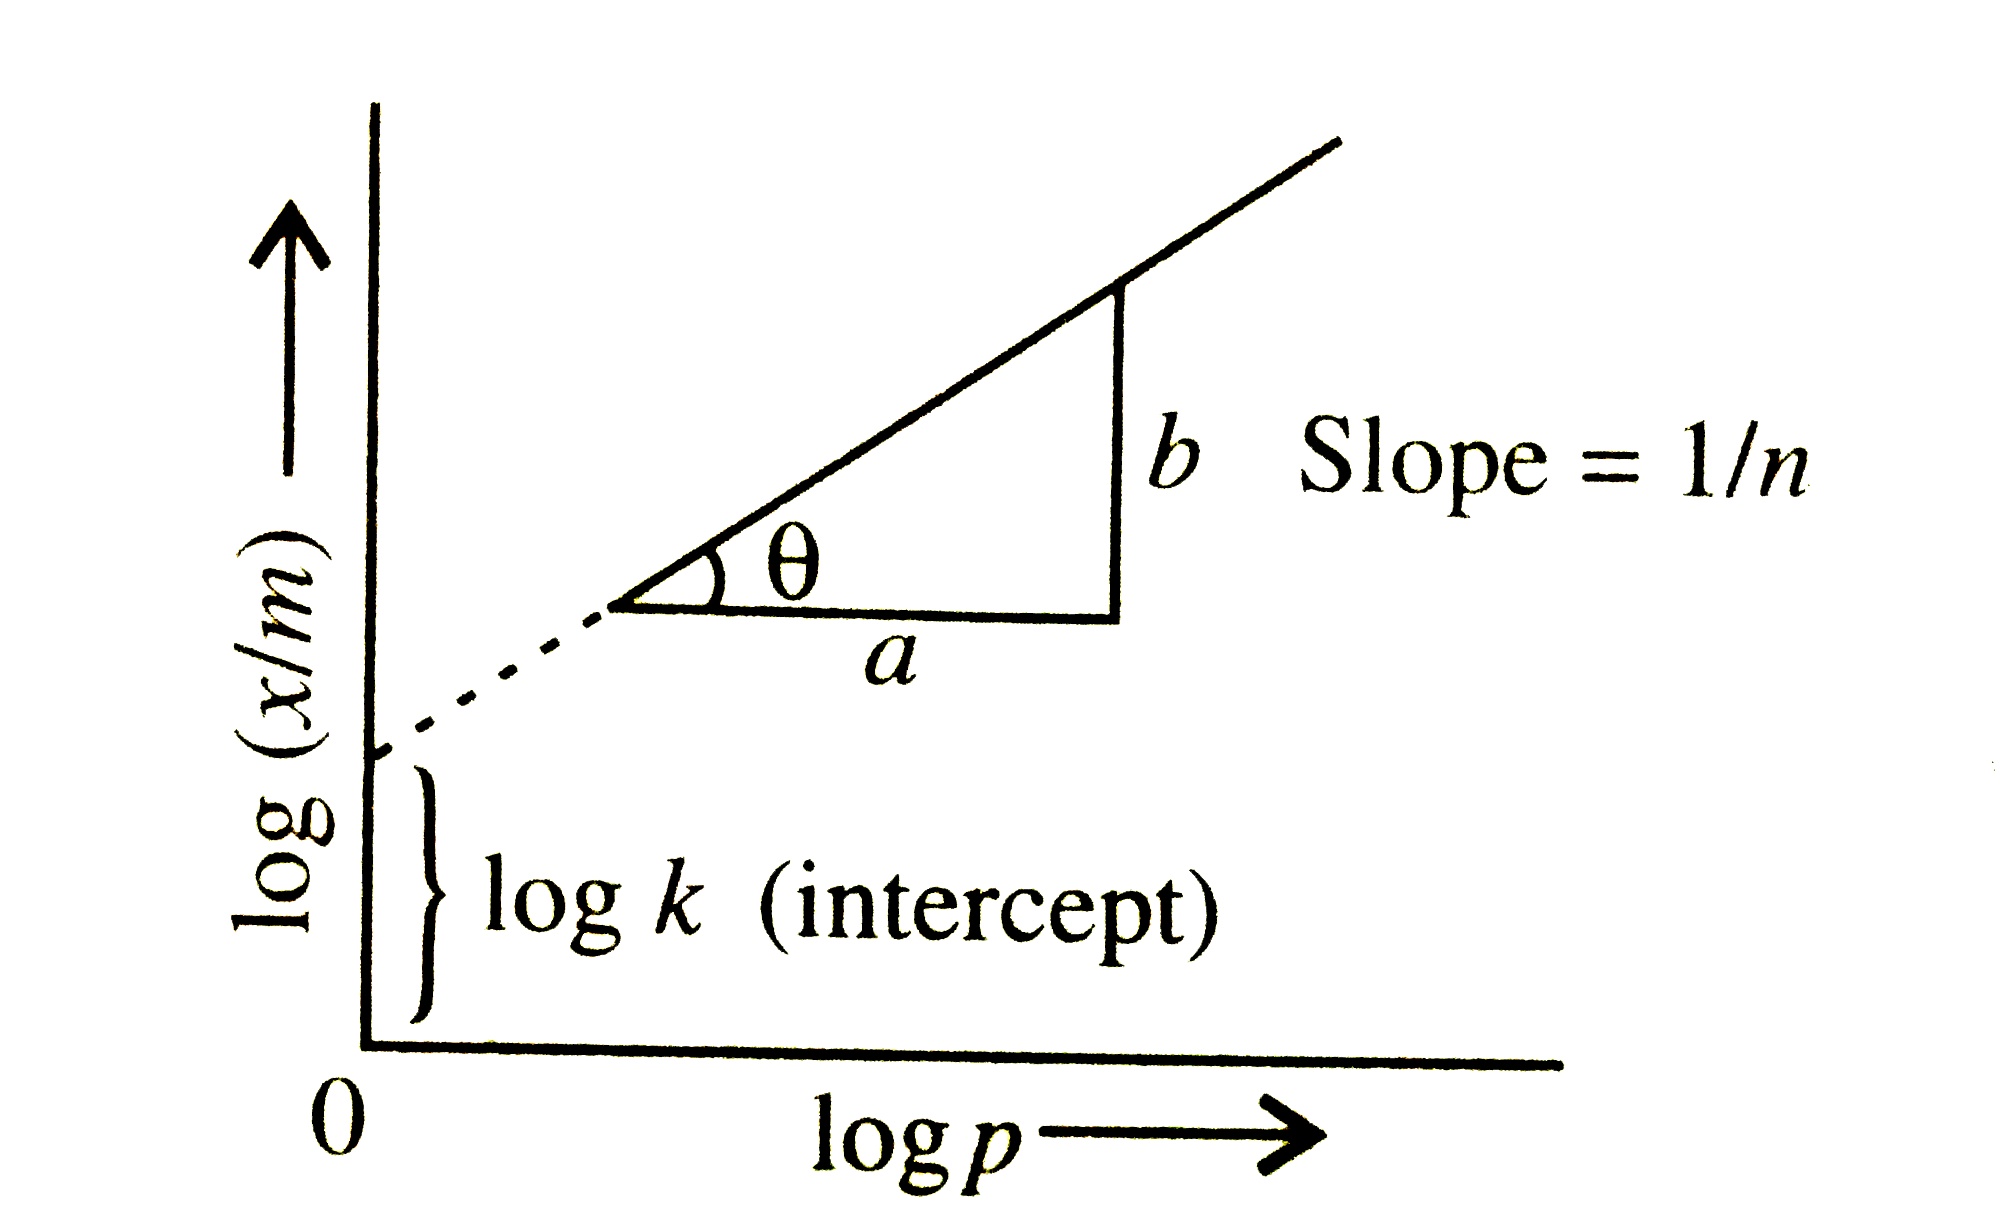
Which is the following statements about his graph is not correct ?
View Solution
Knowledge Check
A graph is plotted between logV and logT for 2mol of gas at constant pressure of 0.0821atm. V and T are in litre and K. Which of the following statements are not correct?
(I) The curve is straight line with slope −1.
(II) The curve is straight line with slope +1.
(III) The intercepet on Y−axis is equal to 2.
(IV) The intercepet on Y−axis is equal to 0.3010.AI, IIBIII, IVCII,IVDI, IIIA graph plotted between log k vs 1T is represented by
A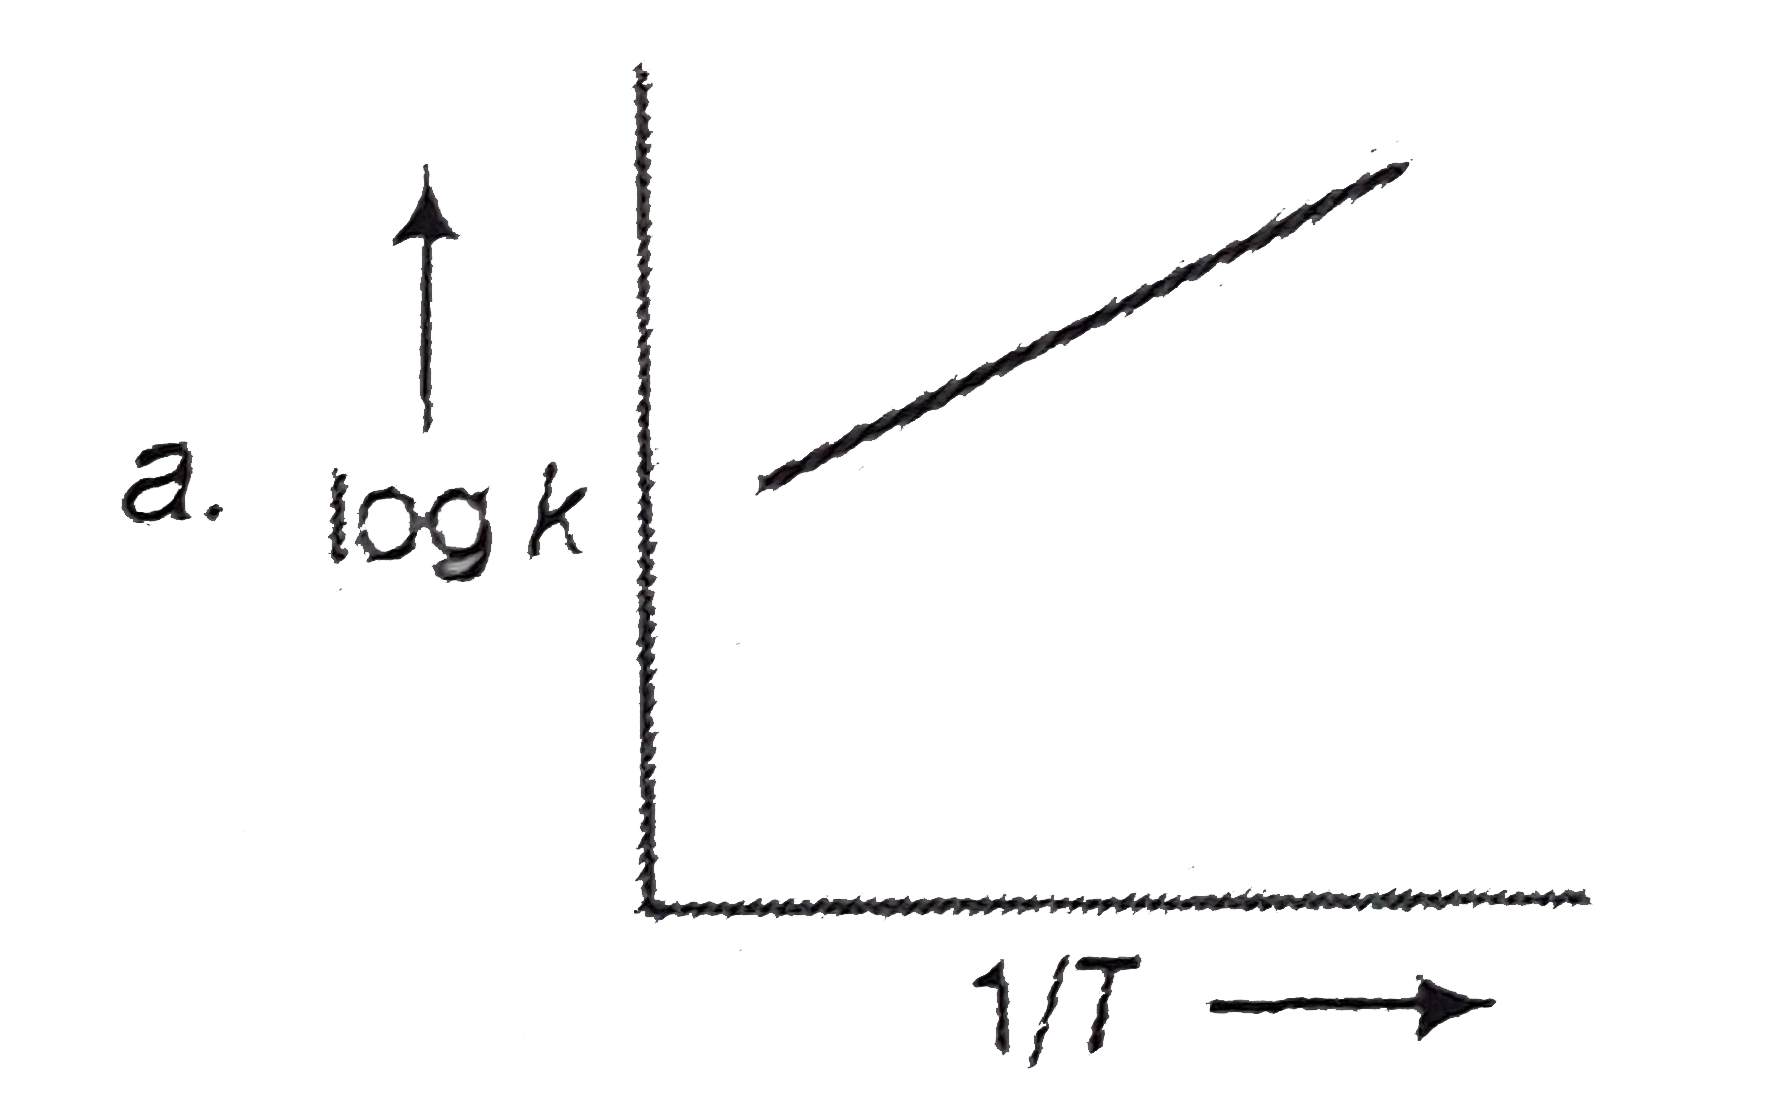 B
B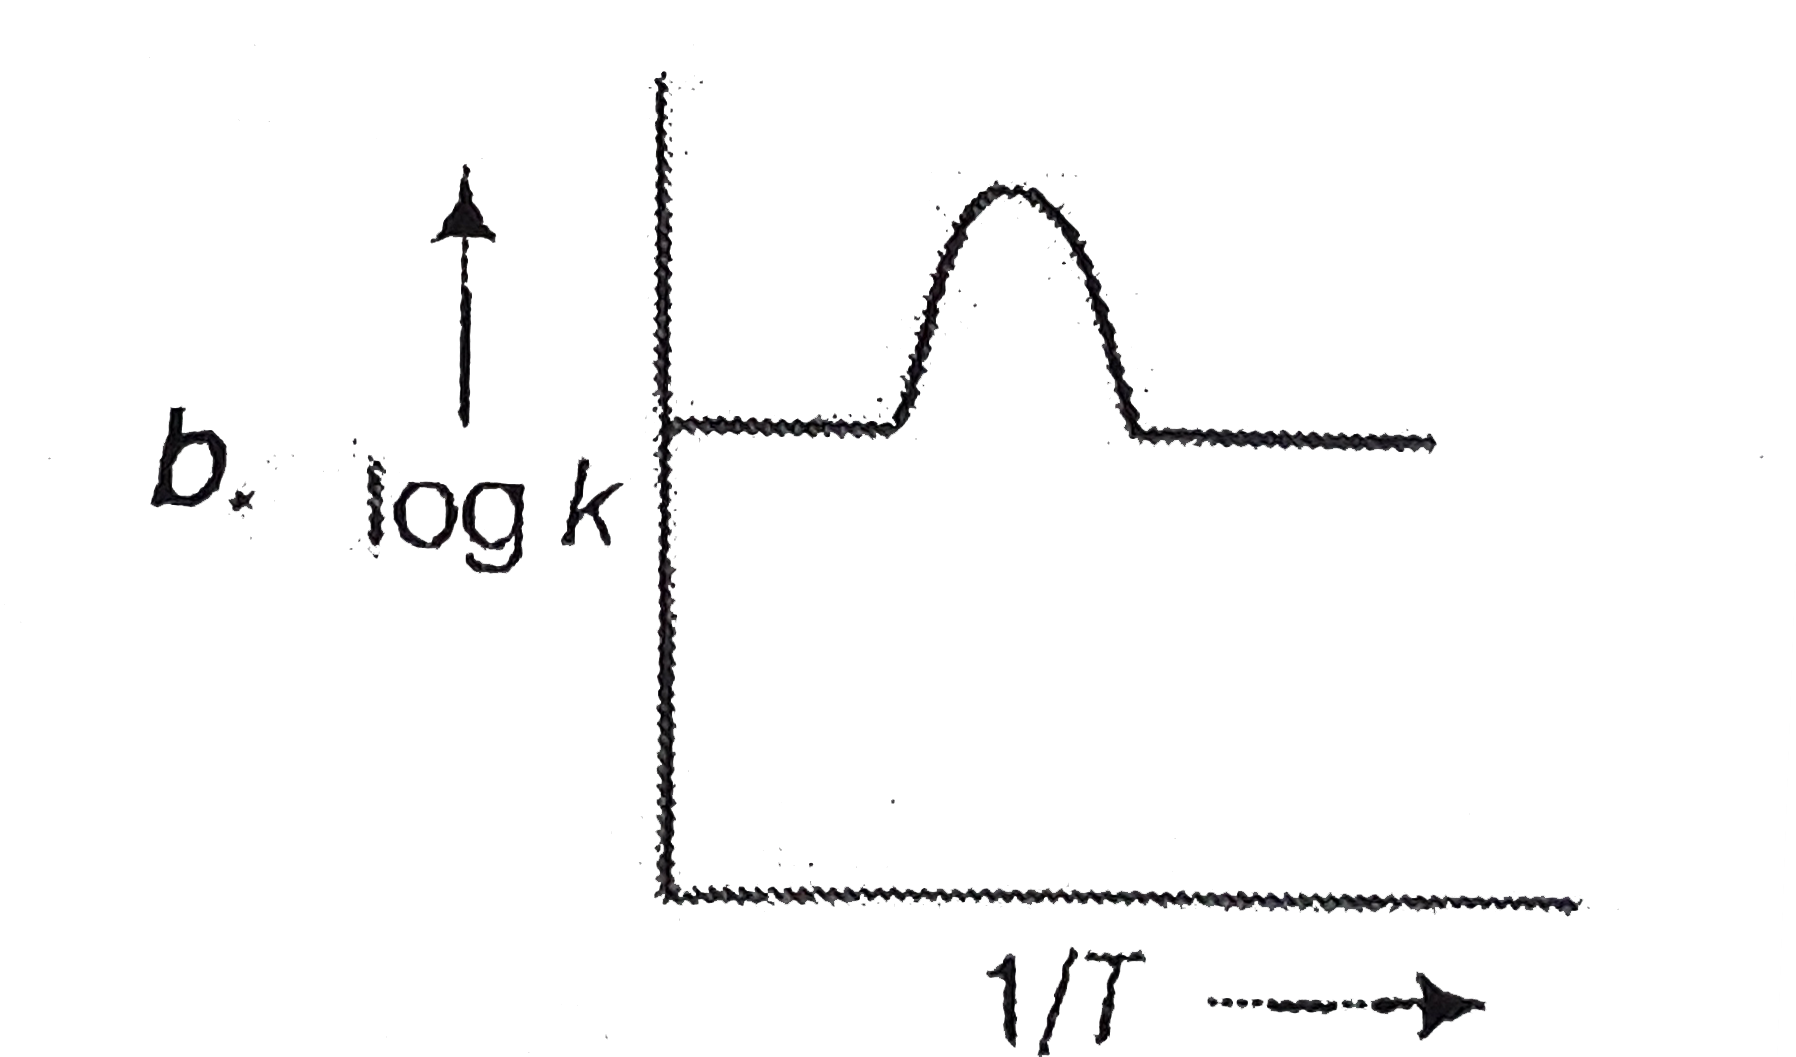 C
C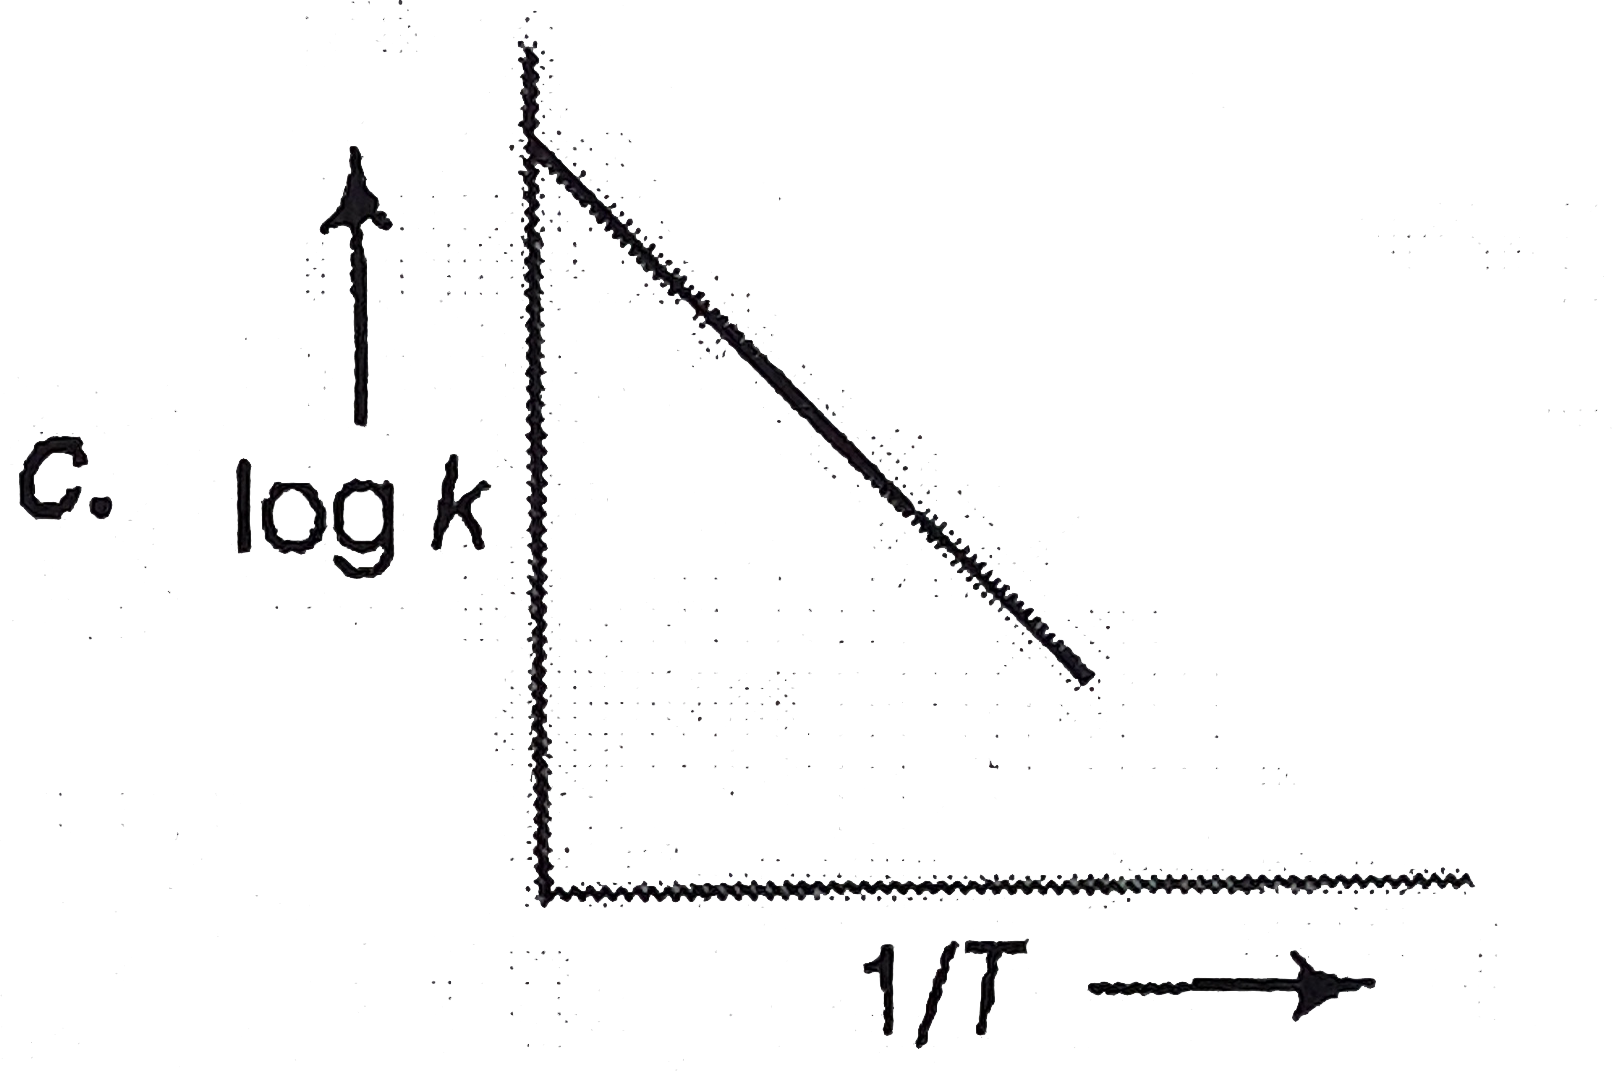 D
D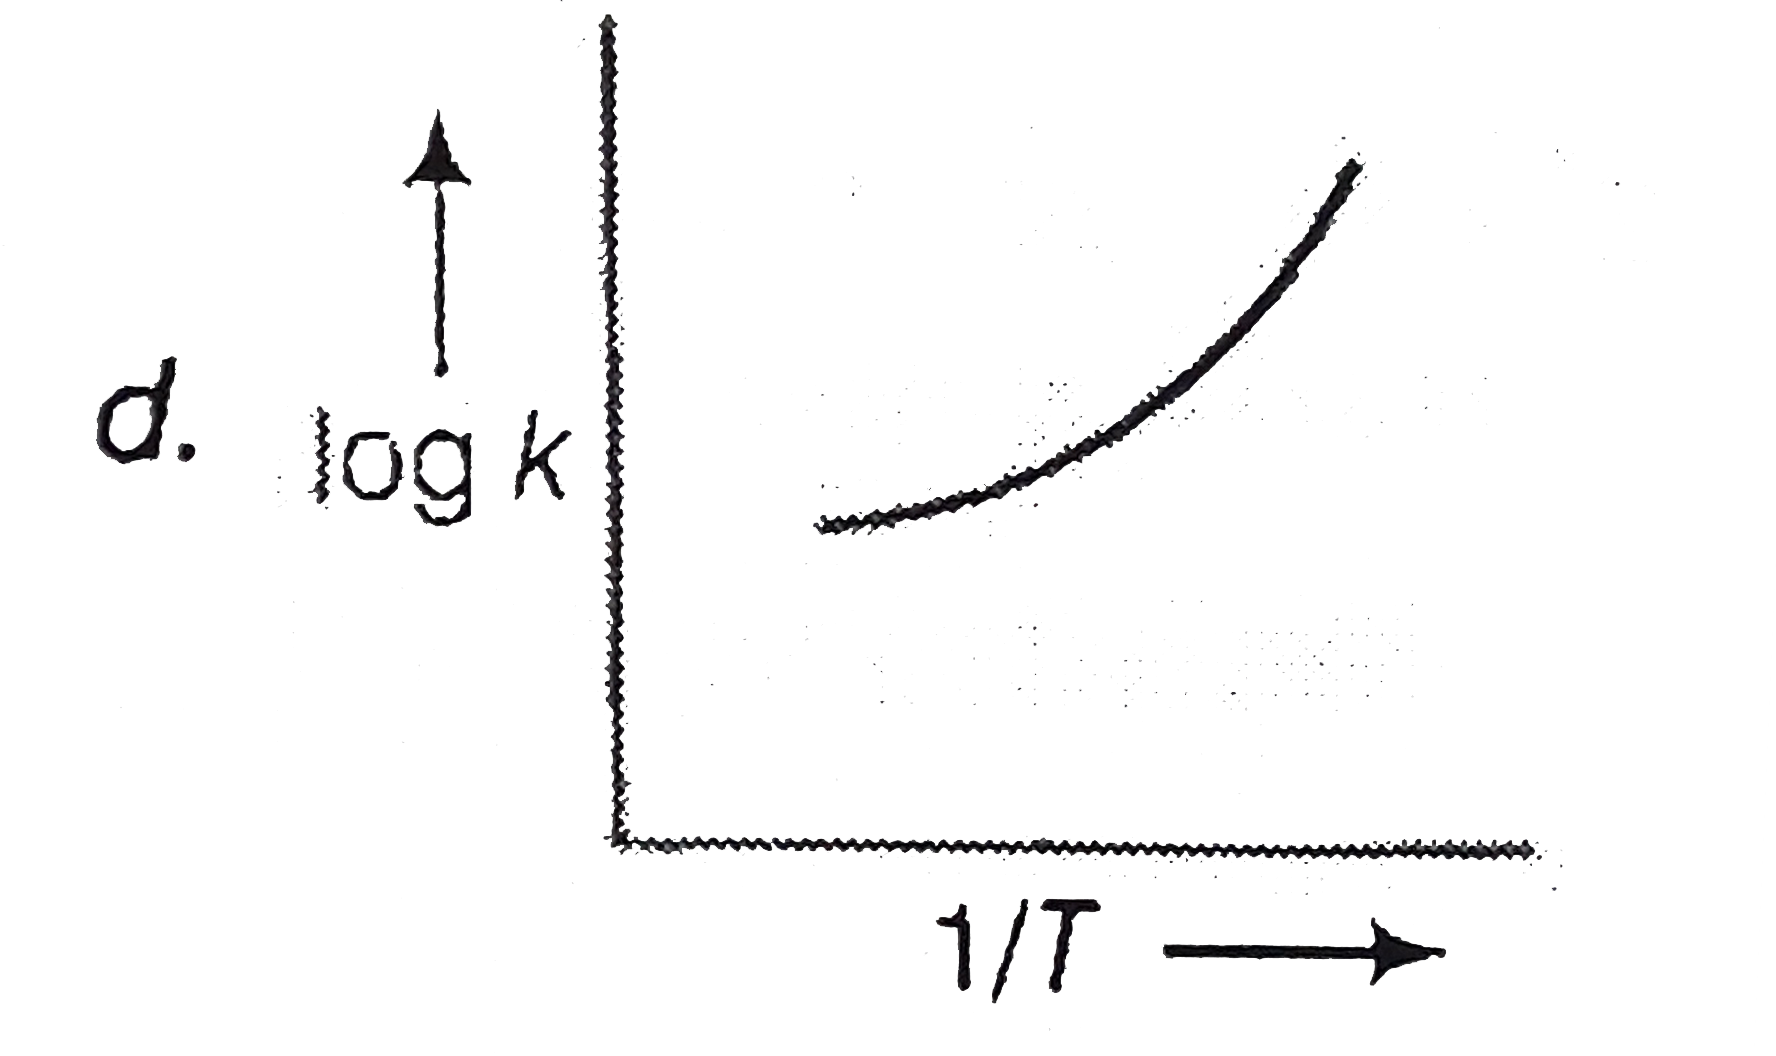
For 1 mole of an ideal gas, a graph of pressure vs volume is plotted as shown. Which of the following options is correct ?
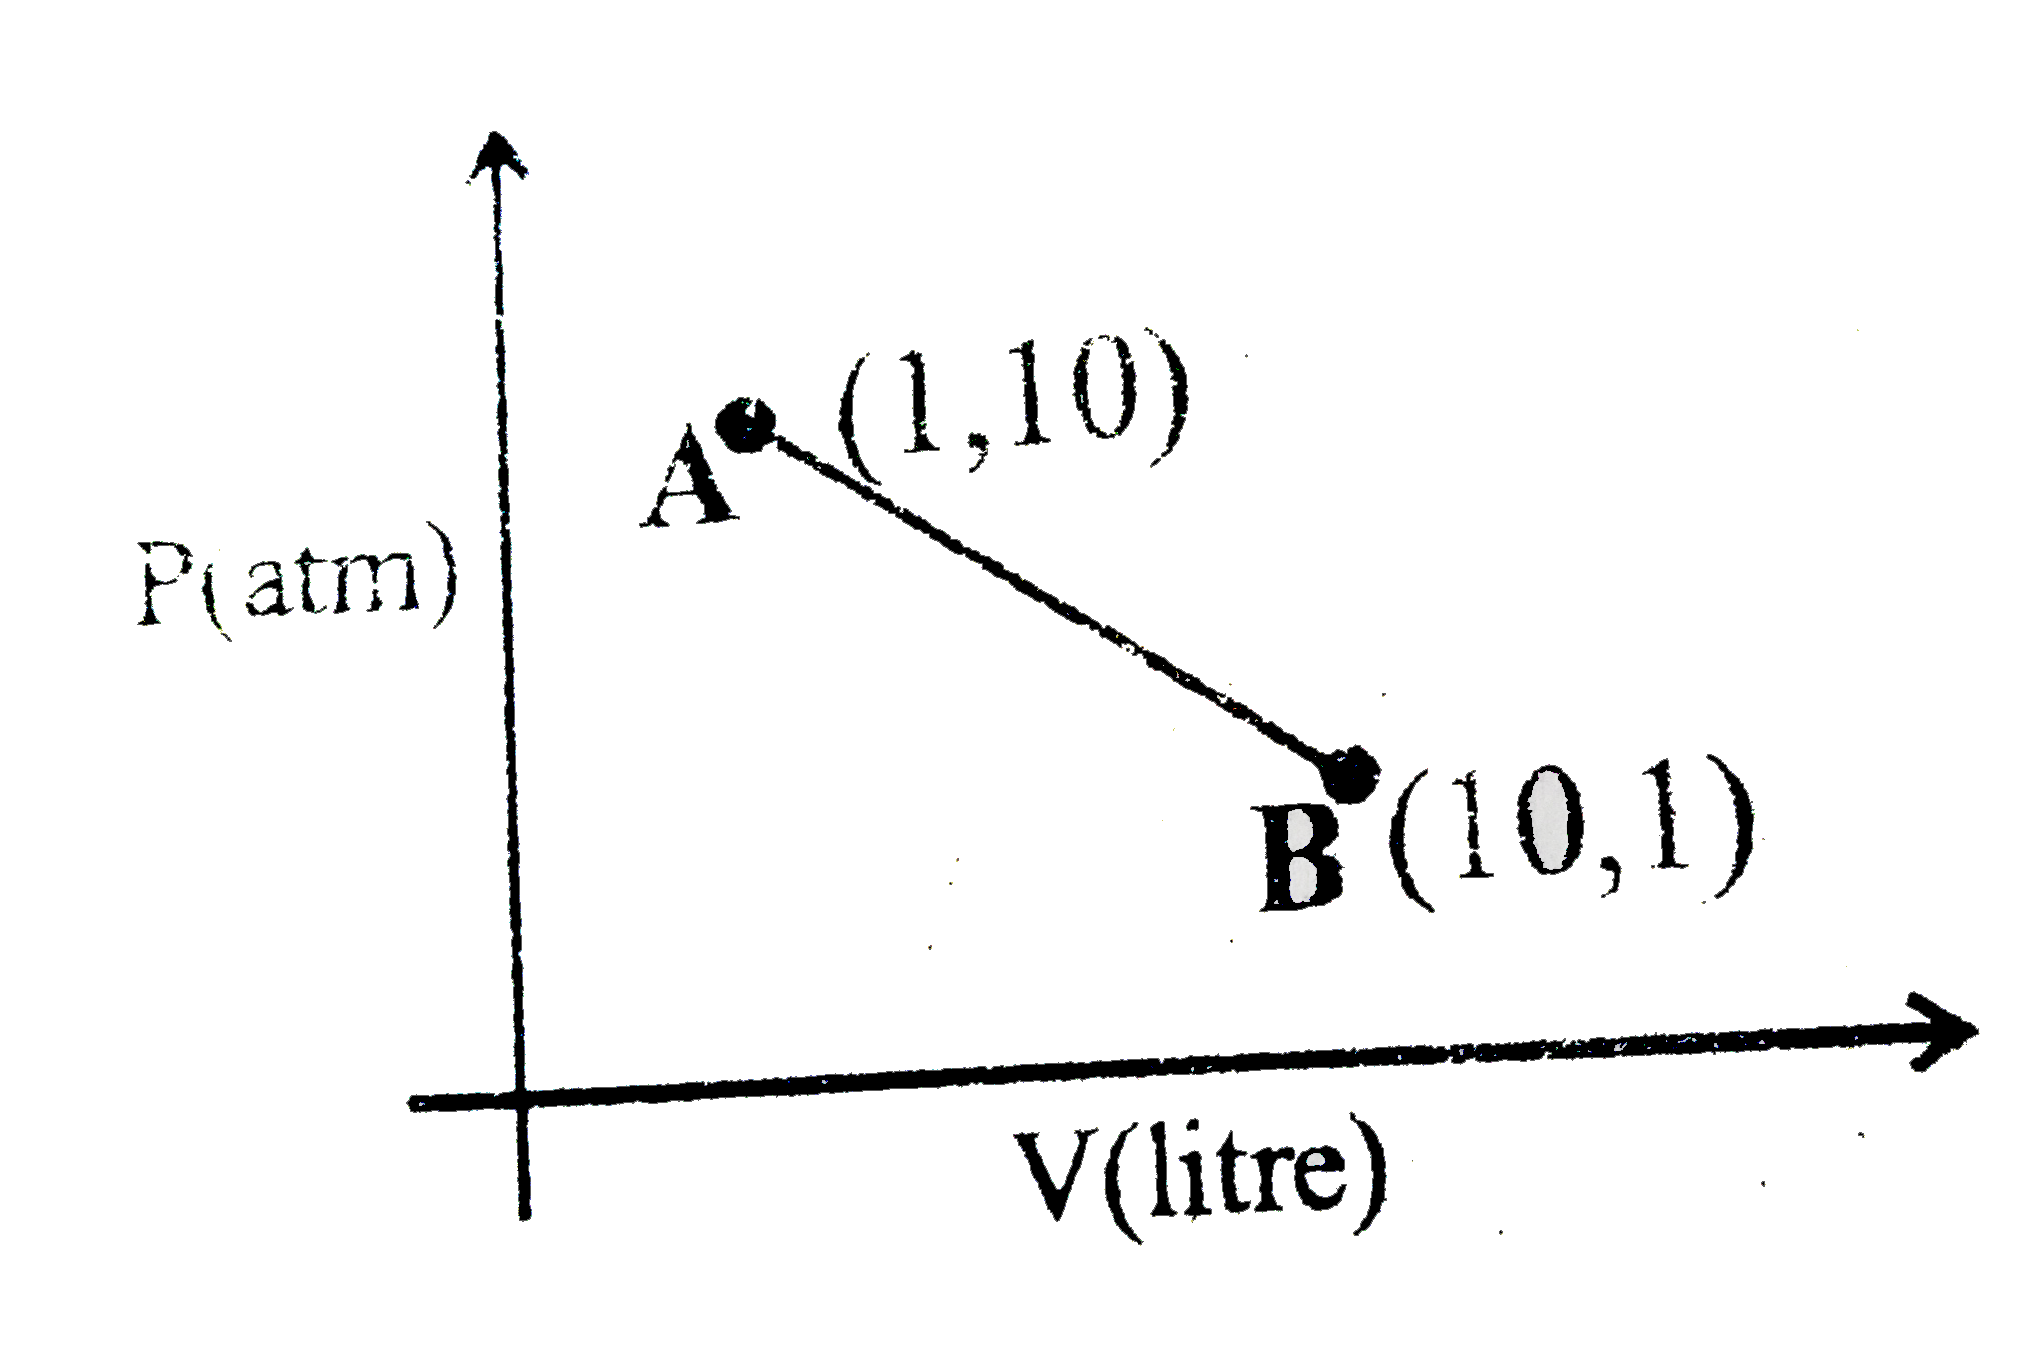 AAB process is isothermalBMaximum temperature of the gas can be 100.0821KCMinimum temperature of the gas can be 114×0.0821KDNone of these
Draw a graph of logP and log(1/V) for a fixed amount of gas at constant temperature.
View SolutionDraw a graph of logP and log(1/V) for a fixed amount of gas at constant temperature.
View SolutionDraw a graph of log P vs log (1/V) for a fixed amount of a gas at constant temperature.
View SolutionDraw a graph of log P vs log (1/V) for a fixed amount of a gas at constant temperature.
View SolutionA graph is plotted between log(x/m) and log P according to the equation xm=kP1n
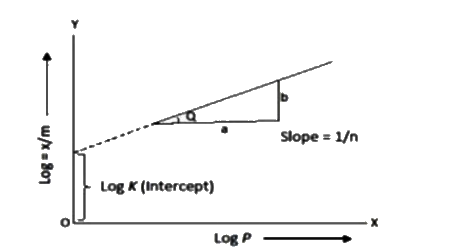
Which of the following statements about this graph is not correct?
View Solution

