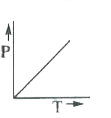
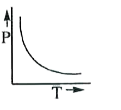
The graph obtained by taking vapour pressure (P) of a liquid on y-axis and temperature (T) on x-axis will beSolution in Telugu


The correct Answer is:C
Step by step video, text & image solution for The graph obtained by taking vapour pressure (P) of a liquid on y-axis and temperature (T) on x-axis will be by Chemistry experts to help you in doubts & scoring excellent marks in Class 12 exams.
Updated on:21/07/2023Similar Questions
Which one of the following represents the graph between log P on Y - axis and 1/T on X - axis ? (P = vapour pressure of a liquid, T = absolute temperature)
View SolutionThe vapour pressure of a liquid varies with temperature as log P=−AT+I. The plot of
View SolutionWhich graph of the following represents the graph between log p (on Y - axis) and 1/T (on X - axis)?
View SolutionFor a liquid the vapour pressure is given by log10P=−400T+10 Vapour pressure of the liquid is 10x mm Hg at 400K. The value of x will be _______
View SolutionWhich of the following represents the graph between log p (on Y-axis) and 1/T (on X-axis) ?
View SolutionThe pressure P for a gas is plotted against its absolute temperature T for two different volumes V_1 and V_2 where V_1 gt V_2 . If P is plotted on y-axis and T on x-axis, then:
View SolutionA graph is plotted by taking pressure along y-axis and centigrade temperature along X-axis for an ideal gas at constant volume. x intercept of the graph is
View Solution

