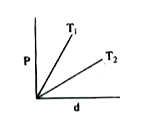
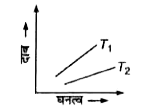
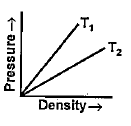
Diagram shows a graph between pressure and density for an ideal gas at two temperatures T1andT2 which is correct
 Solution in Telugu
T1>T2
T=T2
T1>T2
None
The correct Answer is:A
At constant, d,P1>P2 (from graph) ⇒T1>T2 .
Similar Questions
Diagram shows a graph between pressure and density for an ideal gas at two temperatures T1andT2 which is correct

View SolutionPressure (P) vs. density (D) curve for an ideal gas at two different temperatures T_1 and T_2 is shown below . Identify the correct statement about T_1 and T_2 .
View SolutionTwo different temperatures of an ideal gas T_1 Oh T_2 Pressure (P) vs. The graph of density (D) is given below. T_1 Oh T_2 Identify the correct statement about:
View Solutionp - V diagram of same mass of a gas are drawn at two different temperatures (T_1) and (T_2) . Explain whether T_1 gt T_2 or T_2 gt T_1 . .
View SolutionFigure shows graphs of pressure versus density for an ideal gas at two temperatures T_(1) and T_(2) Which is correct ? .
View Solutionनिम्न चित्र में एक आदर्श गैस के लिए दाब तथा घनत्व के मध्य ग्राफ दो तापमानों T1 तथा T2 पर खींचे गए हैं। कौन-सा सम्बन्ध सही है?

View SolutionFigure shows graphs of pressure versus density for an ideal gas at two temperatures T1 and T2. Which is correct:

View Solution
