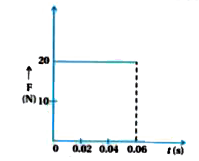
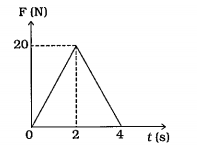
F → t graph for a body is shown in figure. The change in value of momentum of the body in the interval 0.02 s to 0.06 s is ..
 Solution in Gujrati
1.2 kg ms−1
0.3 kg ms−1
0.8 kg ms−1
0.4 kg ms−1
The correct Answer is:C
Change in value of momentum Δp=FΔt
f= 20 N and Δt=0.06−0.02=0.04s
∴,Δp=20×0.04=0.8kgms−1
Similar Questions
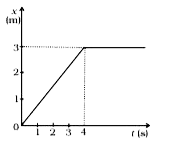
The position-time graph of a body of mass 2 kg is as given in figure . What is the impulse on the body at t = 0 s and t = 4 s .
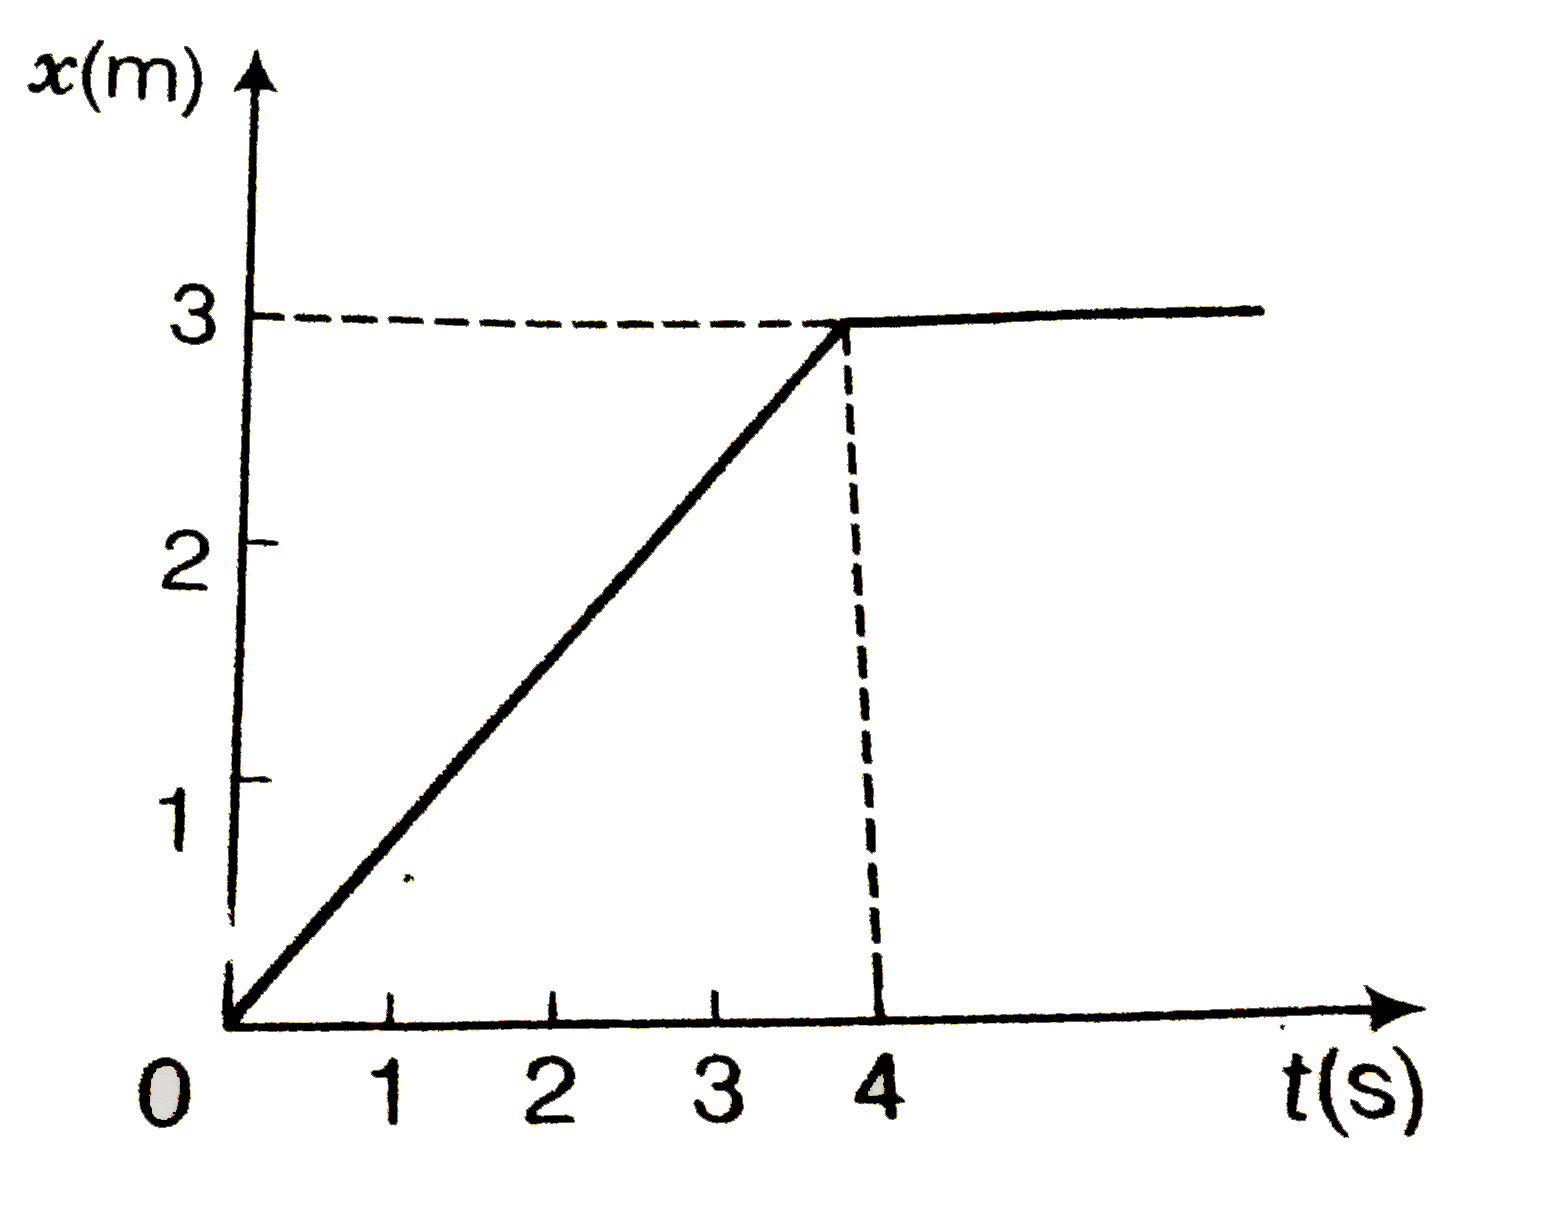
View Solution2kg द्रव्यमान के किसी पिंड का स्थिति समय ग्राफ चित्र में दर्शाया गया है। t = 0 s और t = 4 s पर पिंड का आवेग कितना है ?
View SolutionThe force(F) acting on a particle of mass m changing with time(t) is as shown in (F-t) graph. The change in linear momentum from t=0 to t=6 s (in kN s) is
View SolutionFor an object F rarr t The graph of shows the change in the velocity value of an object in a period of 0.02 seconds to 0.06 seconds .........
View Solutionઆકૃતિમાં એક પદાર્થ માટે F→t આલેખ દર્શાવેલ છે, તો 0 થી 8 s ના સમયગાળામાં થતો વેગમાનનો ફેરફાર શોધો.
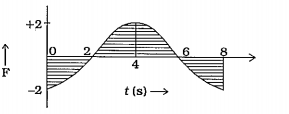
View Solutionશરૂઆતમાં સ્થિર અવસ્થામાં રહેલ એક પદાર્થ માટે F→t આલેખ આકૃતિમાં દર્શાવેલ છે, તો 4 s ના અંતે પદાર્થનું વેગમાન ગણો.
View Solutionm for an object of force F rarr t If the graph is shown in the figure t = 0 To t = 8 The change in velocity during s occurs .........
View Solution
