Using follwing data, draw time-displacement graph for a moving object.
Time (s)0246810121416Displacement (m)024446420
Use this graph to find average velocity for first 4s, for next 4 s and for last 6 s.
To solve the problem, we will follow these steps:
Step 1: Prepare the Data
We have the following data for time (in seconds) and displacement (in meters):
- Time (s): 0, 2, 4, 6, 8, 10, 12, 14, 16
- Displacement (m): 0, 2, 4, 4, 4, 6, 4, 2, 0
Step 2: Draw the Time-Displacement Graph
1. Set up the axes:
- The x-axis will represent time (0 to 16 seconds).
- The y-axis will represent displacement (0 to 6 meters).
2. Plot the points:
- (0, 0)
- (2, 2)
- (4, 4)
- (6, 4)
- (8, 4)
- (10, 6)
- (12, 4)
- (14, 2)
- (16, 0)
3. Connect the points:
- Draw straight lines between the points to represent the motion of the object.
Step 3: Calculate Average Velocity
To find the average velocity for different time intervals, we use the formula:
Average Velocity=Change in DisplacementTotal Time Taken
Average Velocity for the First 4 Seconds (0 to 4 seconds)
- Change in displacement: 4−0=4m
- Total time taken: 4−0=4s
Average Velocity=4m4s=1m/s
Average Velocity for the Next 4 Seconds (4 to 8 seconds)
- Change in displacement: 4−4=0m
- Total time taken: 8−4=4s
Average Velocity=0m4s=0m/s
Average Velocity for the Last 6 Seconds (10 to 16 seconds)
- Change in displacement: 0−6=−6m
- Total time taken: 16−10=6s
Average Velocity=−6m6s=−1m/s
Summary of Results
- Average Velocity for the first 4 seconds: 1 m/s
- Average Velocity for the next 4 seconds: 0 m/s
- Average Velocity for the last 6 seconds: -1 m/s
---
We have the following data for time (in seconds) and displacement (in meters):
- Time (s): 0, 2, 4, 6, 8, 10, 12, 14, 16
- Displacement (m): 0, 2, 4, 4, 4, 6, 4, 2, 0
1. Set up the axes:
- The x-axis will represent time (0 to 16 seconds).
- The y-axis will represent displacement (0 to 6 meters).
- (0, 0)
- (2, 2)
- (4, 4)
- (6, 4)
- (8, 4)
- (10, 6)
- (12, 4)
- (14, 2)
- (16, 0)
- Draw straight lines between the points to represent the motion of the object.
To find the average velocity for different time intervals, we use the formula:
Average Velocity=Change in DisplacementTotal Time Taken
- Change in displacement: 4−0=4m
- Total time taken: 4−0=4s
Average Velocity=4m4s=1m/s
- Change in displacement: 4−4=0m
- Total time taken: 8−4=4s
Average Velocity=0m4s=0m/s
- Change in displacement: 0−6=−6m
- Total time taken: 16−10=6s
Average Velocity=−6m6s=−1m/s
- Average Velocity for the first 4 seconds: 1 m/s
- Average Velocity for the next 4 seconds: 0 m/s
- Average Velocity for the last 6 seconds: -1 m/s
Similar Questions
i) Find the average velcity in the time intervals
a) 0 to 2 s, b) 0 to 4 s, c)2s to 4s
View SolutionFollowing table gives the displacement of a car at different instants of time. (a) Draw the displacement-time sketch and find the average velocity of car.
(b) What will be the displacement of car at (i) 2.5 s and (ii) 4.5 s?

View SolutionThe following table represents the distance of a car at different instants in a fixed direction.

(a) Draw a displacement-time graph and with its help, find whether the motion of the car is uniform or non-uniform?
(b) Use graph to calculate :
(i) the velocity of car (ii) the displacement of car at t = 2.5 s and t = 4.5 s.
View SolutionIf P,Q,R,S are (3,6,4),(2,5,2),(6,4,4,),(0,2,1) respectively find the projection of PQ on RS.
View SolutionThe position verus time graph time graph for a certain particle moving along the x-axis is shown in . Find the average velocity in the time intervals (a) 0 to 2s, (b) 2s to 4s, and (c) 4,s to 7s,
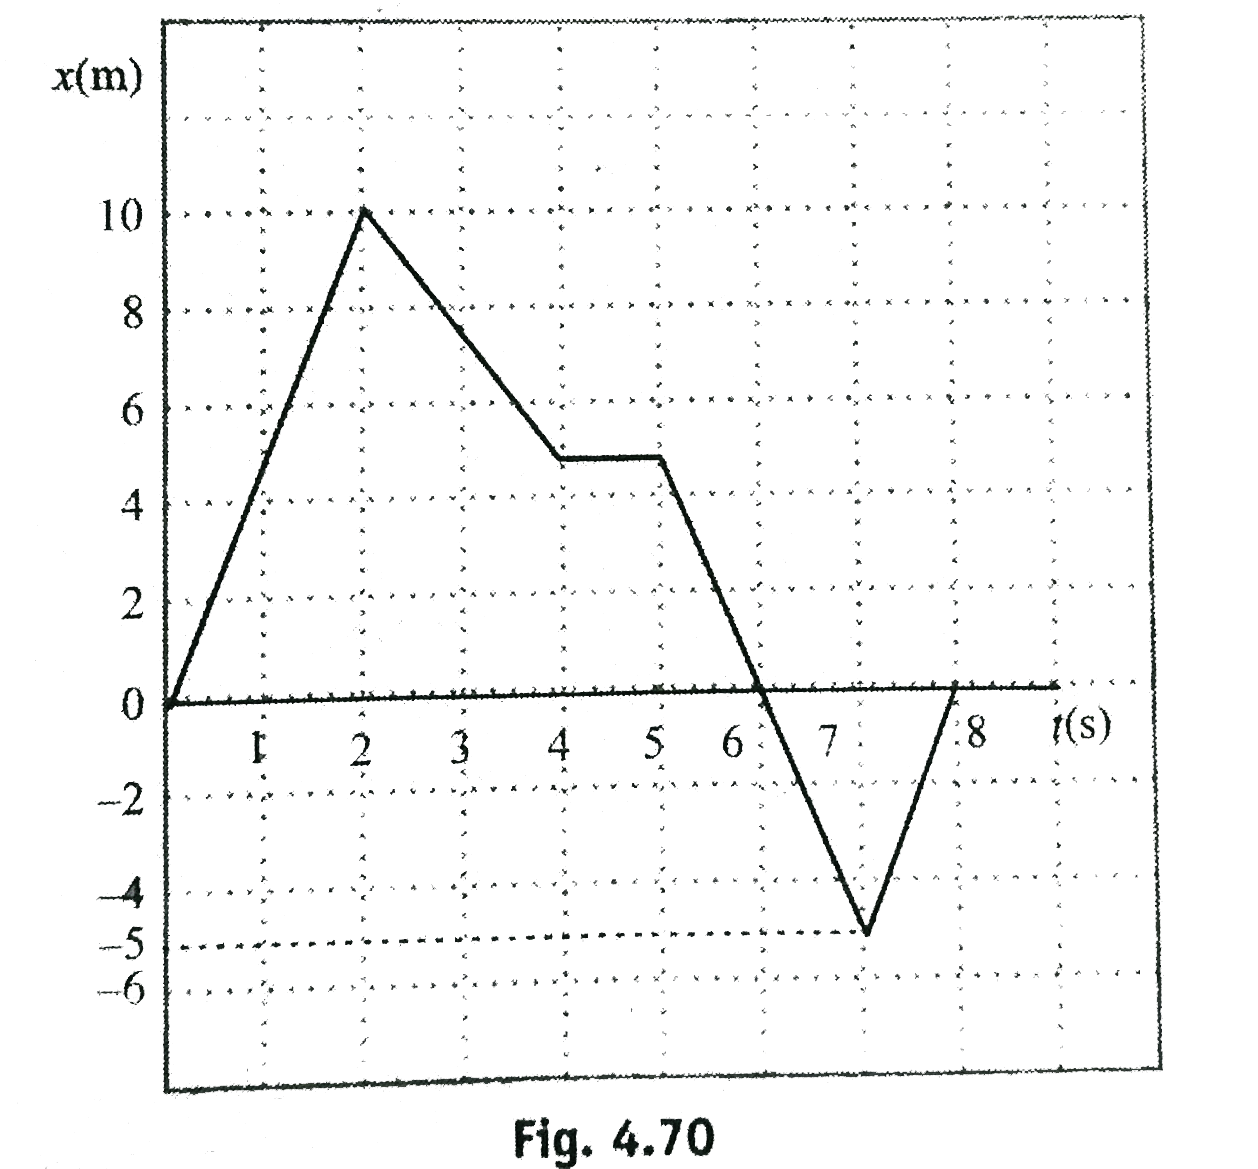 .
.
View SolutionA+B=⎡⎢⎣4−2268102−412⎤⎥⎦,A−B=⎡⎢⎣2−4−26−8−8−24−6⎤⎥⎦. Find A,B.
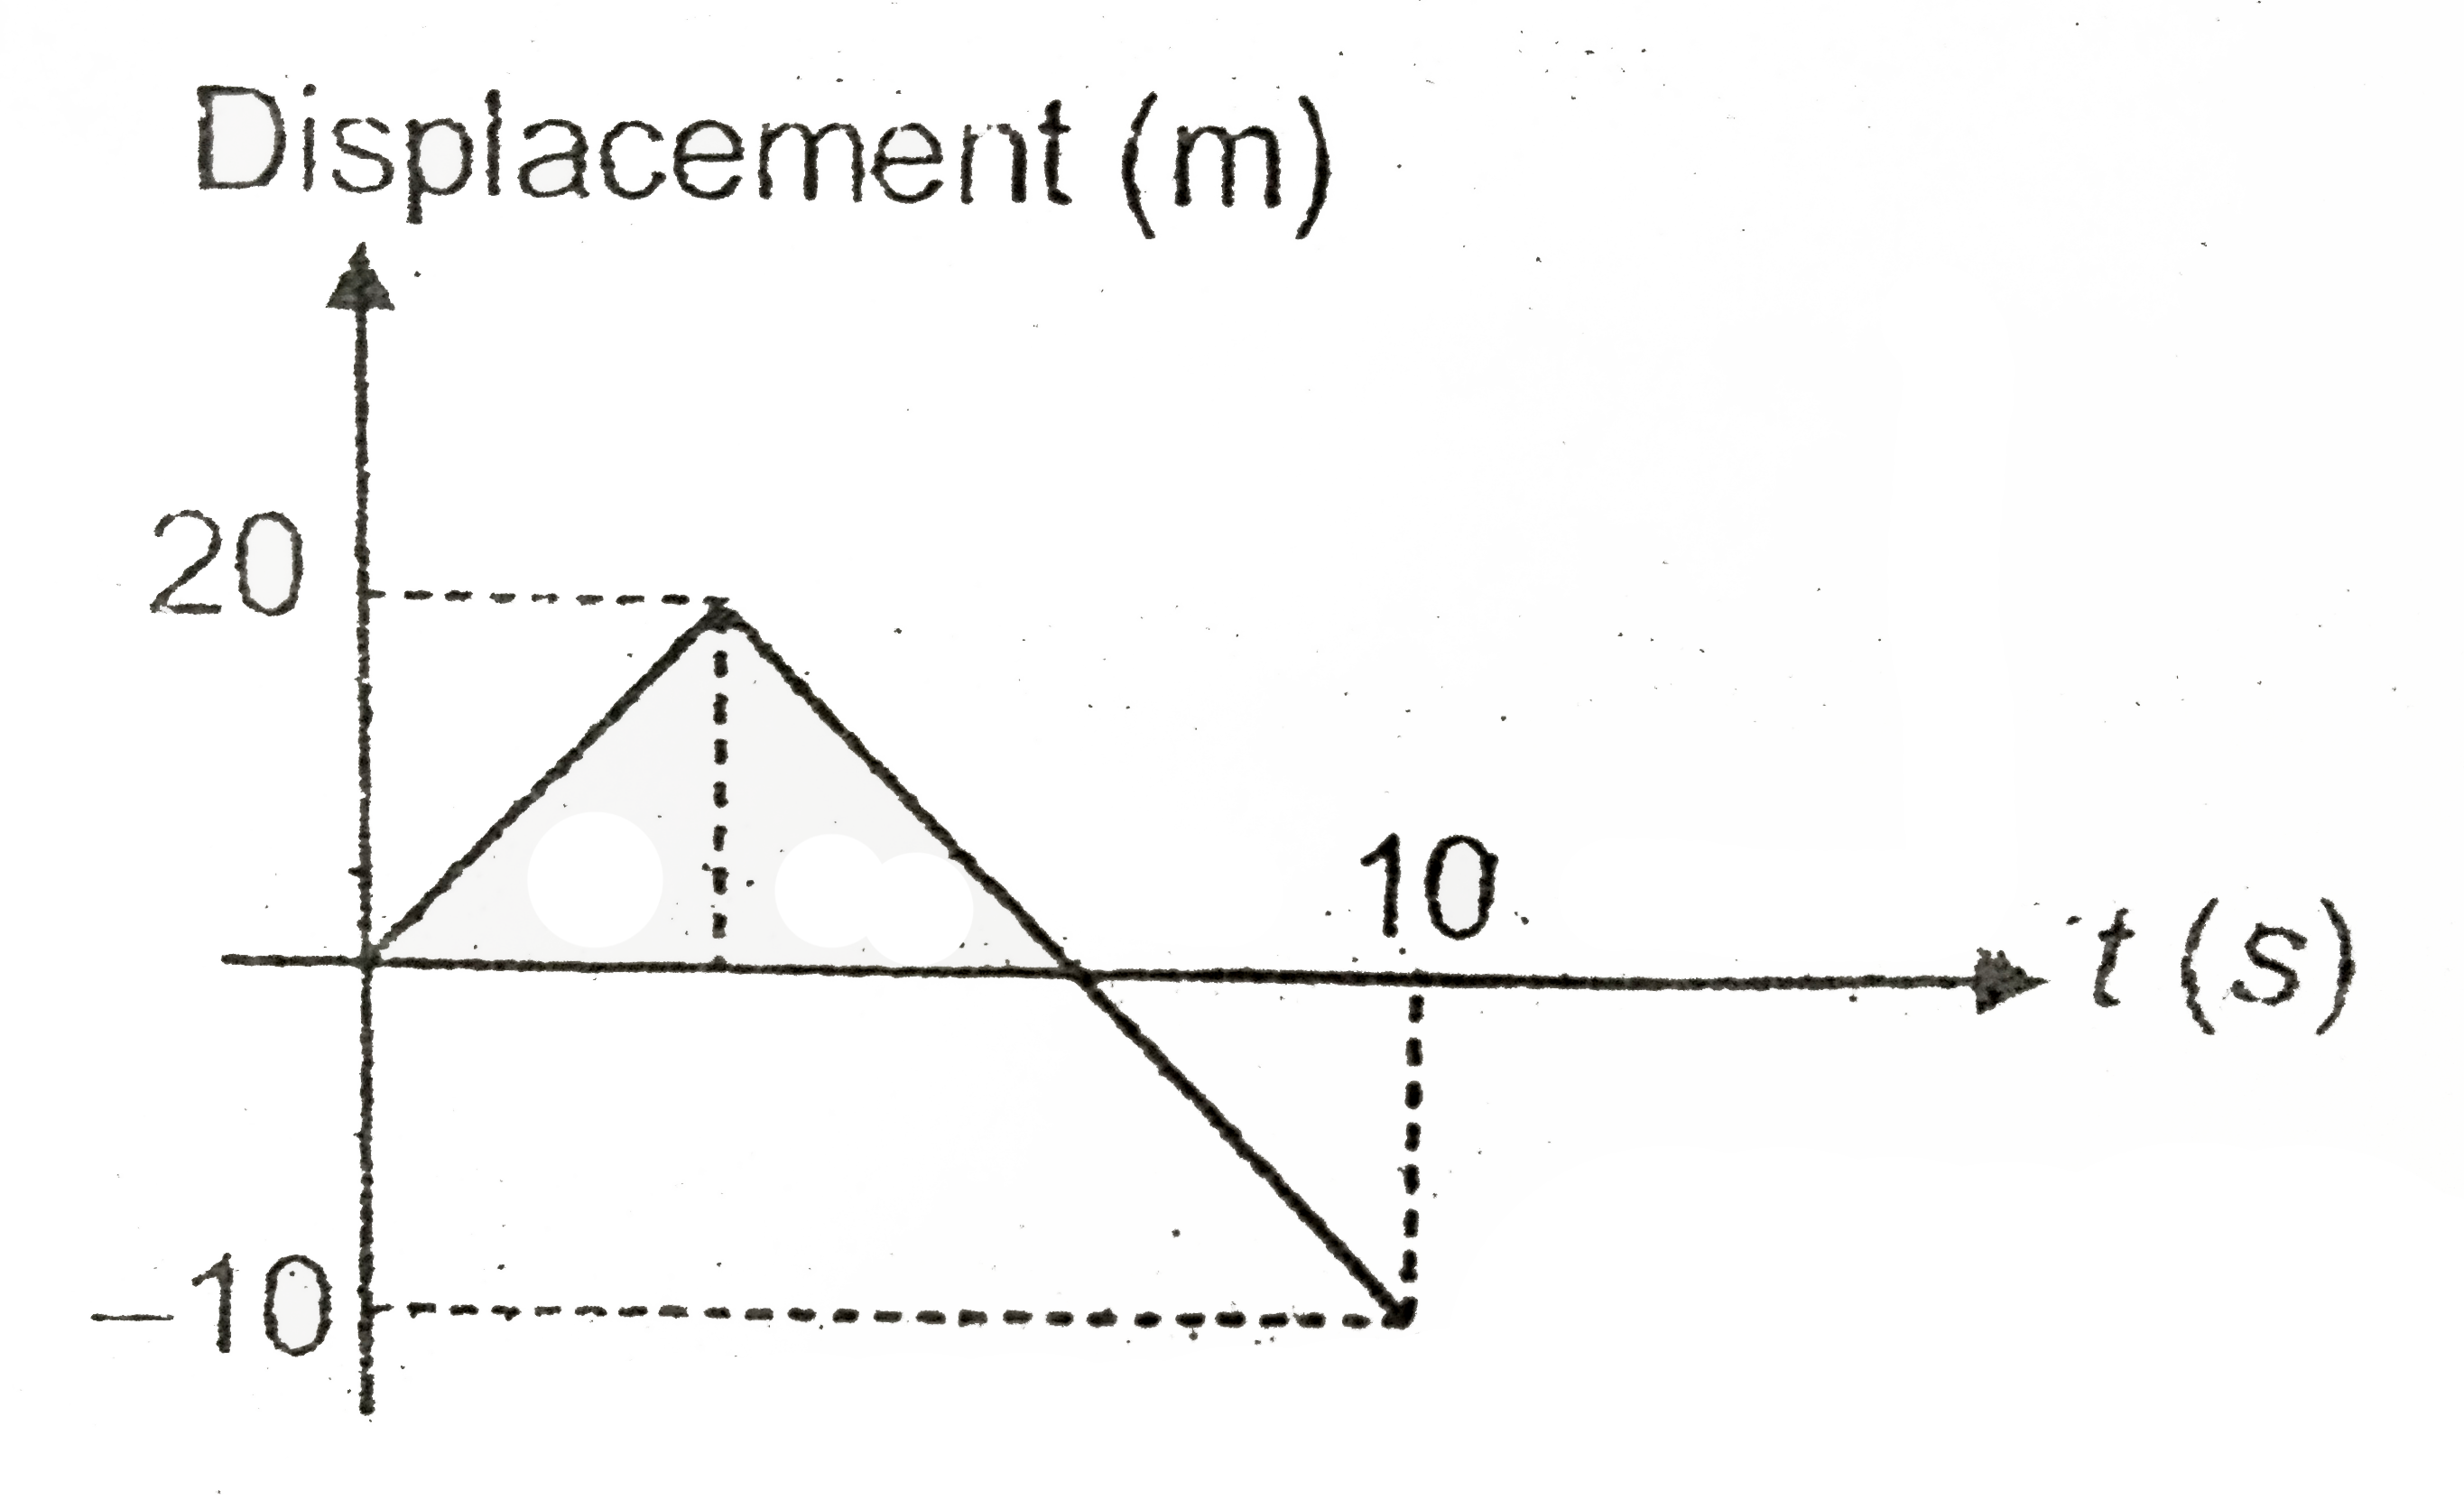
View SolutionThe diagram shows the displacement-time graph for the particle moving in a straight line. What is average speed (in m/s) for the interval 0-10 s?
View SolutionThe position of object moving along an x-axis is given by x=3t−4t2+t3, where x is in meters and t in seconds. Find the position of the object at the following values of t : (i) 2s, (ii) 4s, (iii) What is the object's displacement between t = 0 s and t = 4 s ? and (iv) What is its average vvelocity for the time interval from t = 2 s to t = 4 ?
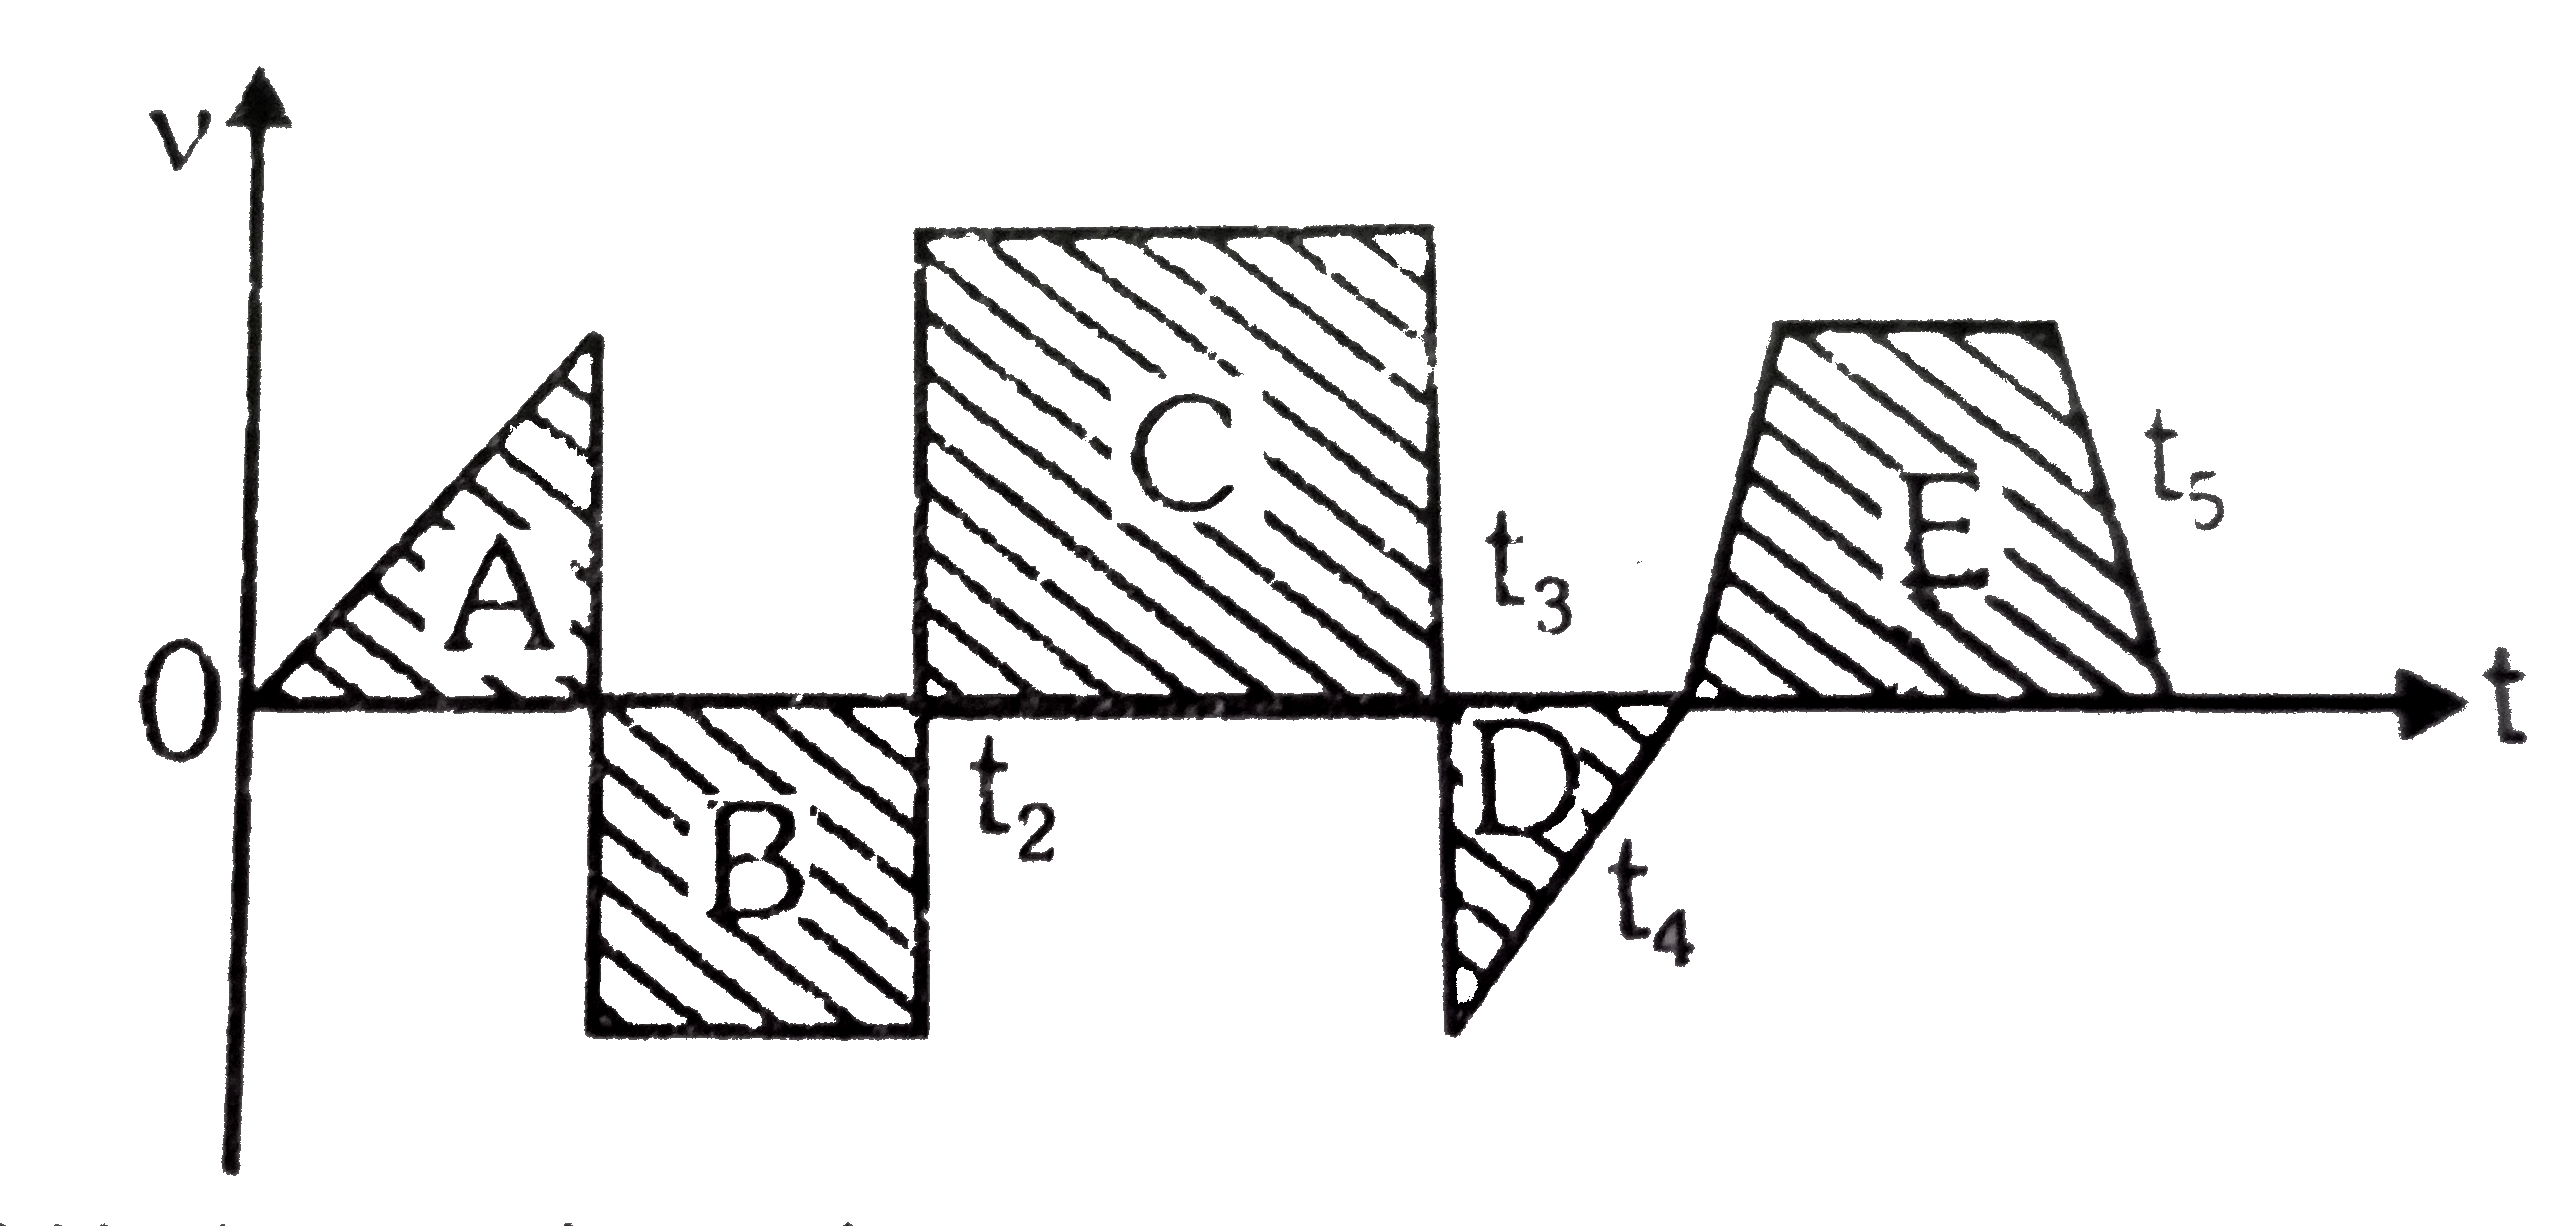
View SolutionThe velocity-time graph of an objects is as shown. The displacement during the interval 0 to t4 is
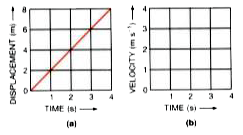
View SolutionFig. 2.37 (a) shows the displacement-time graph for the motion of a body. Use it to calculate the velocity of body at t = 1 s, 2 s and 3 s, then draw the velocitytime graph for it in Fig. (b).
View Solution