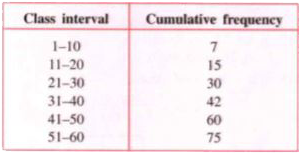
Prepare a continuous grouped frequency distribution from the following data
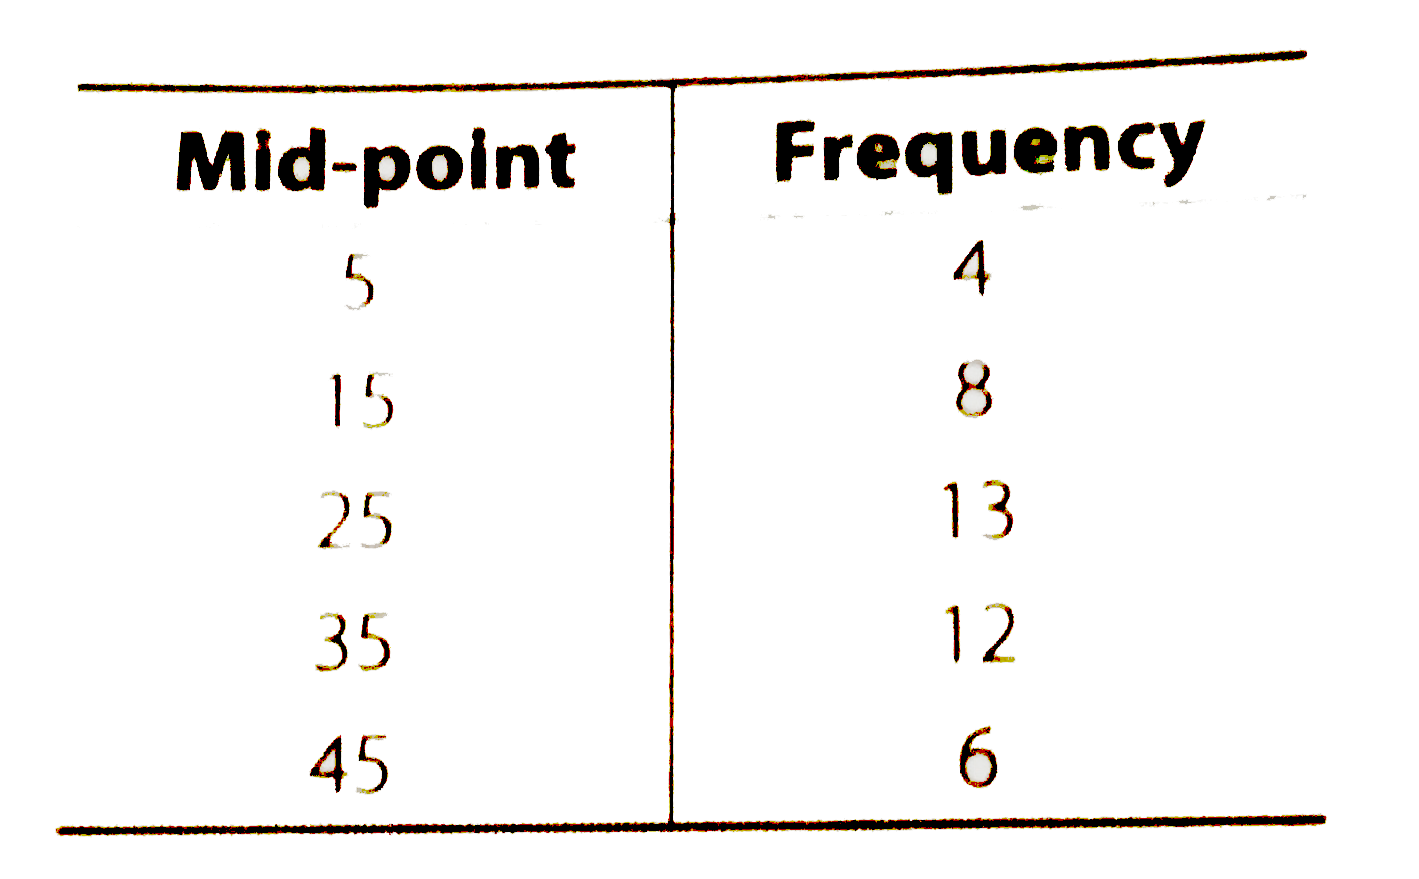
Also, find the size of class intervals.
Here, we see that the difference between two mid-points is 15-5 i.e., 10.
It means the width of the class interval is 10.
Let the lower limit of the first class interval be a.
Then, its upper limit =a+10
Now, mid value of the first class interval =5
⇒Mid value=Lower limit+Upper limit2
⇒5=a+a+102⇒2a+10=10
⇒2a=0⇒a=0
So, the first class interval is 0-10.
Now, we prepare a continous grouped frequency distribution table is given below
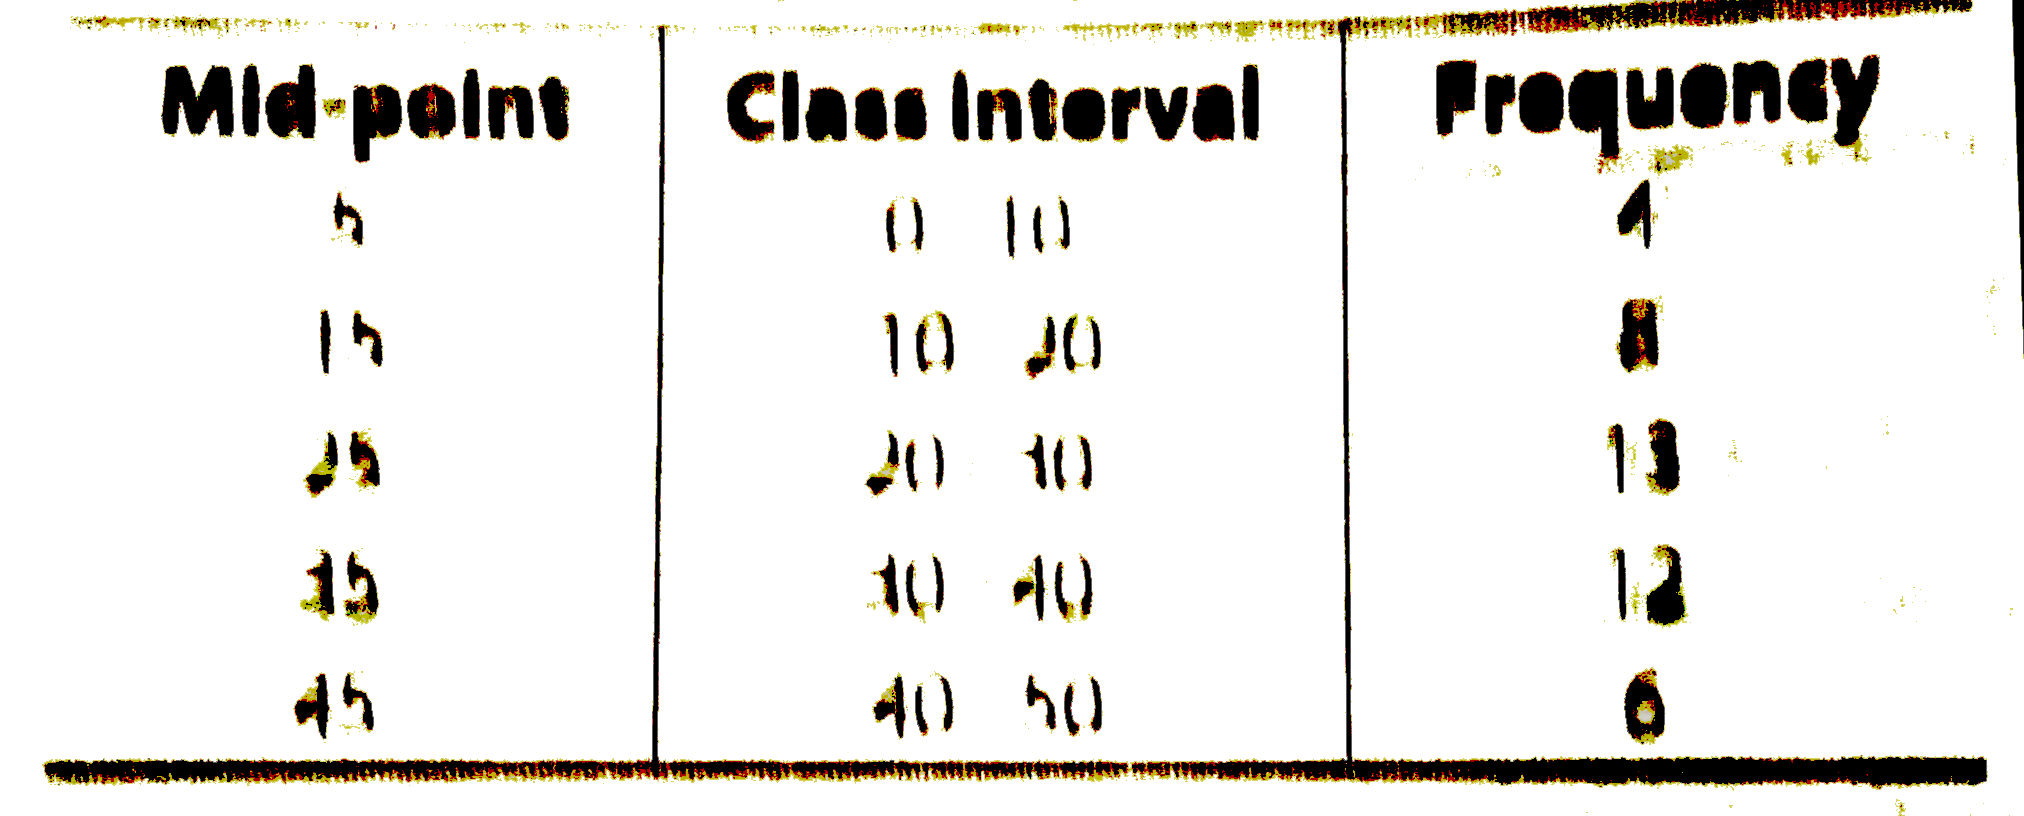
Hence, the size of the class interval is 10 i.e., 10-0.
Topper's Solved these Questions
- STATISTICS AND PROBABILITYBOOK - NCERT EXEMPLAR ENGLISHCHAPTER - STATISTICS AND PROBABILITYEXERCISE - LONG ANSWER TYPE QUESTIONS
12 Videos
- STATISTICS AND PROBABILITYBOOK - NCERT EXEMPLAR ENGLISHCHAPTER - STATISTICS AND PROBABILITYEXERCISE - VERY SHORT ANSWER TYPES QUESTIONS
10 Videos
- QUADRILATERALS BOOK - NCERT EXEMPLAR ENGLISHCHAPTER - QUADRILATERALS EXERCISE - LONG ANSWER TYPE QUESTIONS
18 Videos
- TRIANGLESBOOK - NCERT EXEMPLAR ENGLISHCHAPTER - TRIANGLESEXERCISE - LONG ANSWER TYPE QUESTIONS
21 Videos
Similar Questions
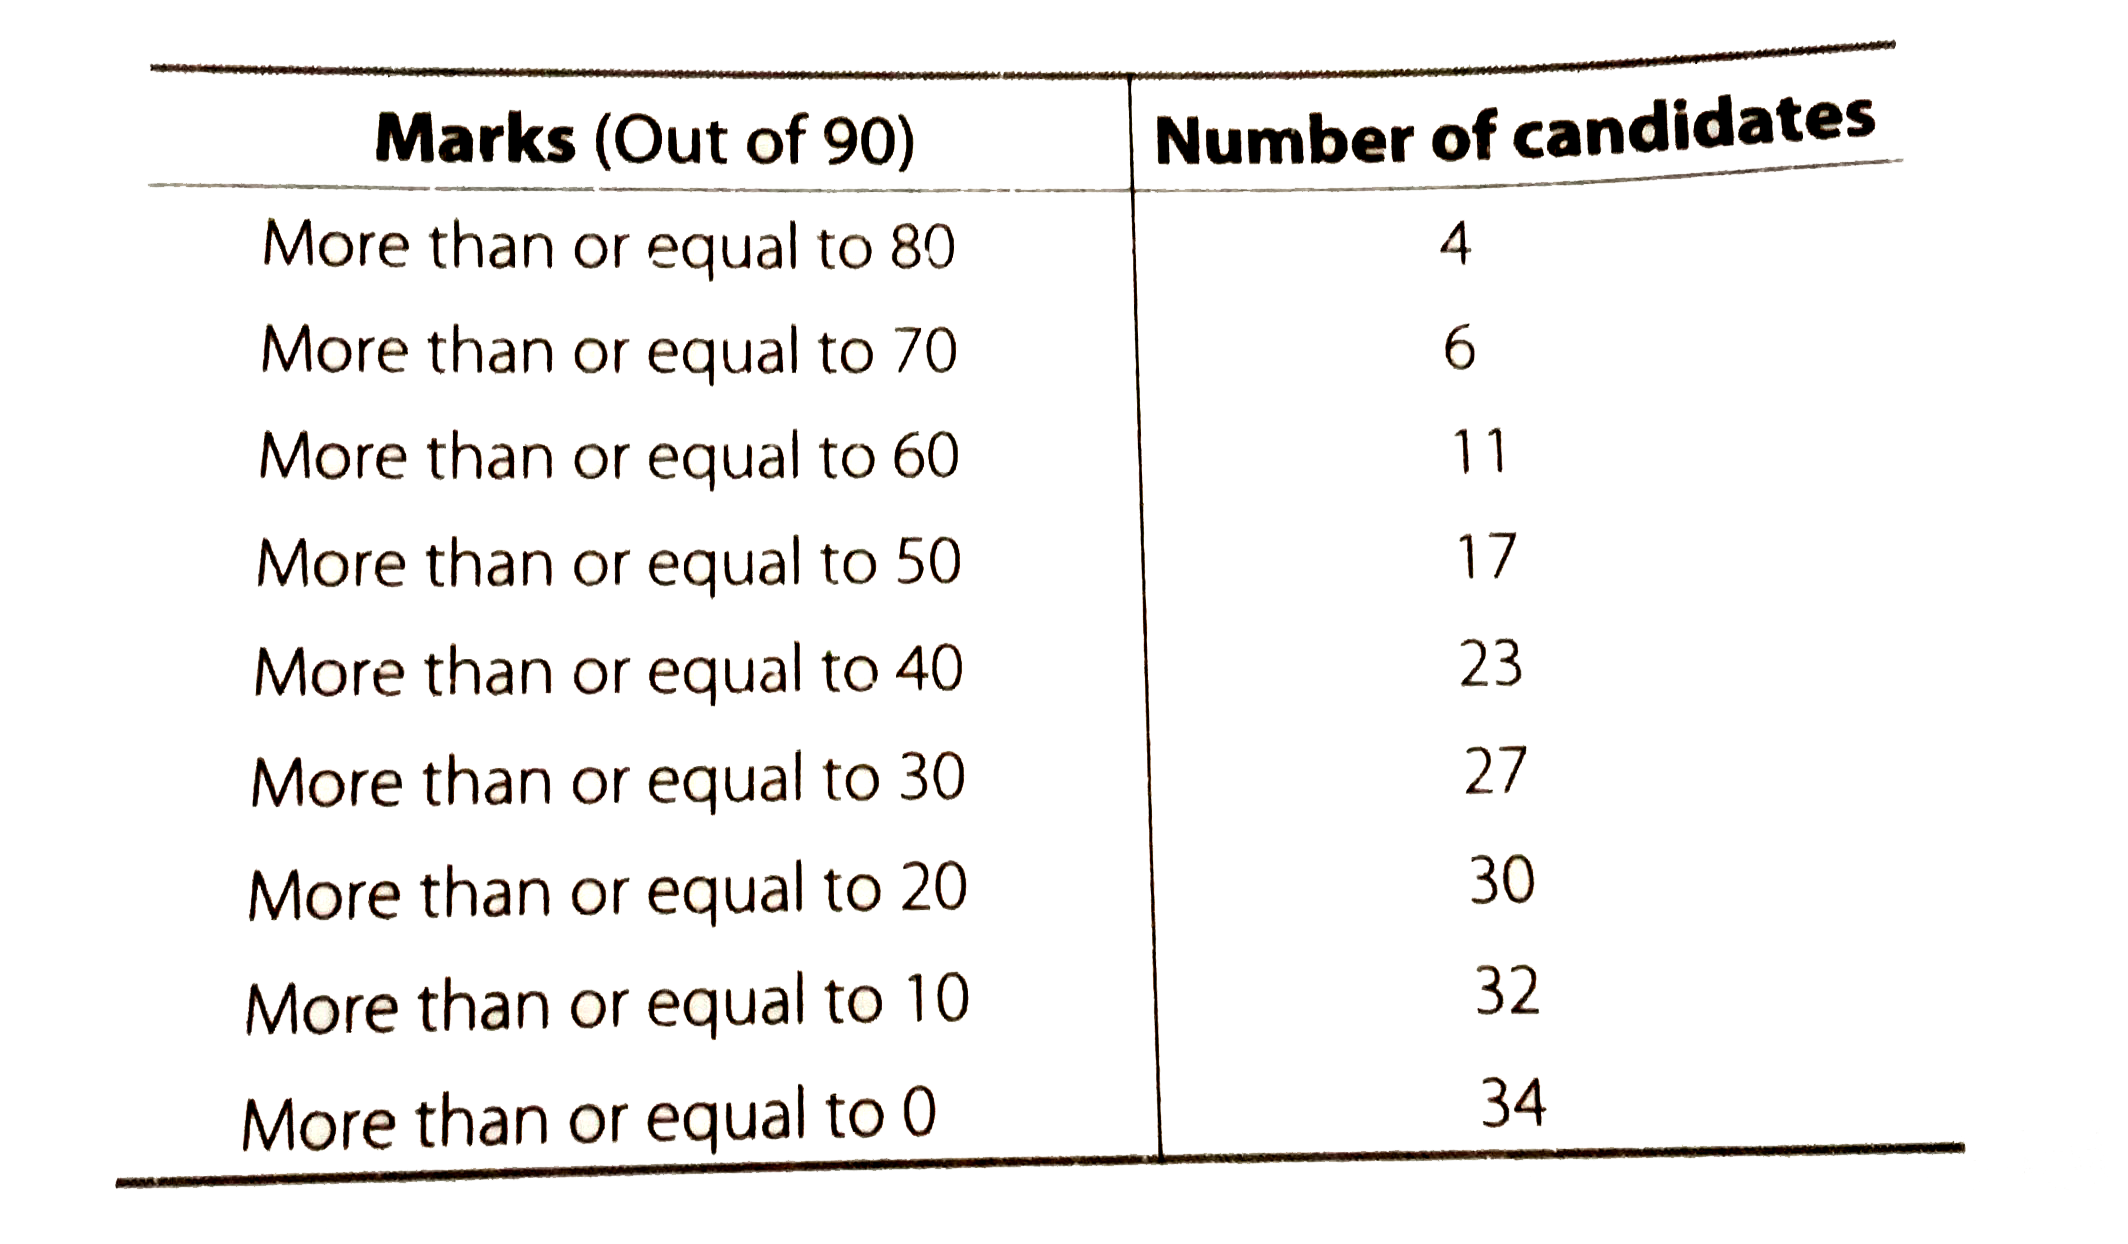
From the frequency distribution table from the following data
View SolutionDraw a histogram and frequency polygon from the following data:

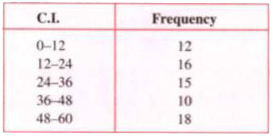
View SolutionContruct a cumulative frequency distributions table from the following frequency table:
View SolutionContruct a cumulative frequency distributions table from the following frequency table:
View SolutionThe following are weights (in kg) of 50 children taken at the time of birth:

Make an inclusive form grouped frequency distribution table with 0.3 kg as the width of ' each class.
Also, find the true class limits of each class.
View SolutionFor drawing a frequency polygon of a continuous frequency distribution, we plot the points whose ordinates are the frequencies of the respecitve classes and abscissae are, respectively
View SolutionConstruct a frequency distributions table from the following cumulatvive frequency table.
Class interval Cumulative Frequency 0−91510−192320−293830−395640−496850−5990
View SolutionThe distance (in km) of 40 engineers from their residence to their place of work were found as follows.

Construct a grouped frequency distribution table with calss- size 5 for the data given above taking the first interval as 0-5 (5 not included).
View SolutionA study was conducted to find out the concentration of sulphur dioxide in the air in parts per million (ppm) of a certain city. The data obtained for 30 days is a follows :

(i) Make a grouped frequency distribution table for this data with class-intervals as 0.00−0.04,0.04−0.08 and so on.
(ii) For how many day's was the concentration of sulphar dioxide more than 0.11 parts per million (ppm)?
View SolutionThe width of each of five continuous classes in a frequency distribution is 5 and the lower class limit of the lowest class is 10. The upper class limit of the highest class is
View Solution
