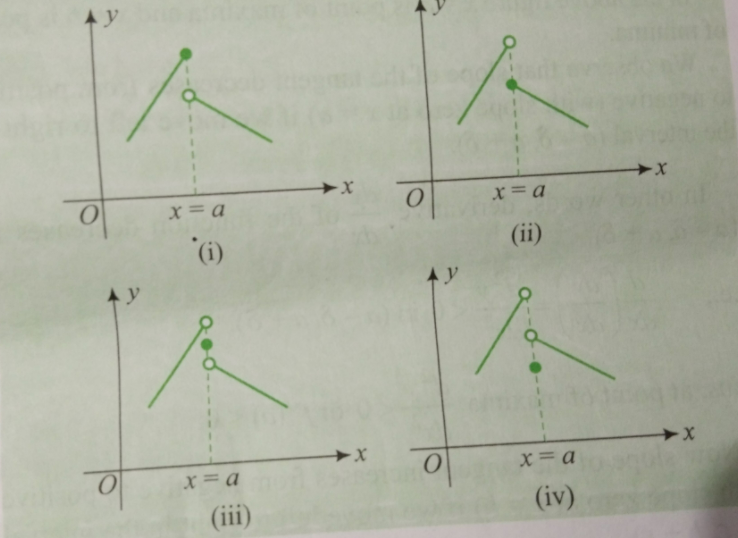
Consider the following graphs of the functions. Check each for the extrema at x=a

(i) f(x)>(a−δ) and f(x)>f(a−δ)
So,x=a is point of maxima.
(ii) f(a)<(a−δ) and f(a)>f(a+δ)
So , x =a is neither point of maxima nor point of minima.
(iii) f(a)<f(a−δ) and f(a)>f(a+δ)
So ,x=a is neither point of maxima nor point of minima
(iv) f(a)<f(a−δ) and f(a)<f(a+δ)
So ,x=a is point of minima.
Topper's Solved these Questions
- MONOTONICITY AND MAXIMA MINIMA OF FUNCTIONSBook:CENGAGE ENGLISHChapter:MONOTONICITY AND MAXIMA MINIMA OF FUNCTIONSExercise:Solved Examples
Explore 20 Videos
- MONOTONICITY AND MAXIMA MINIMA OF FUNCTIONSBook:CENGAGE ENGLISHChapter:MONOTONICITY AND MAXIMA MINIMA OF FUNCTIONSExercise:Concept Application Exercise 6.1
Explore 10 Videos
- METHODS OF DIFFERENTIATIONBook:CENGAGE ENGLISHChapter:METHODS OF DIFFERENTIATIONExercise:Single Correct Answer Type
Explore 46 Videos
- MONOTONOCITY AND NAXINA-MINIMA OF FUNCTIONSBook:CENGAGE ENGLISHChapter:MONOTONOCITY AND NAXINA-MINIMA OF FUNCTIONSExercise:Comprehension Type
Explore 6 Videos
Similar Questions
Find the possible values of a such that f(x)=e2x−(a+1)ex+2x is monotonically increasing for x∈R.
View SolutionProve that the following functions are strictly increasing: f(x)=log(1+x)−2x2+x for x > -1
View SolutionThe right hand derivative of f(x)=[x]tanπxatx=7 is (where [.] denotes the greatest integer function) 0 b. 7π c. −7π d. none of these
View SolutionLet f:R→R,y=f(x),f(0)=0,f'(x)>0andf''(x)>0. Three point A(α,f(α)),B(β,f(β)),C(γ,f(γ))ony=f(x) such that 0<α<β<γ.
Which of the following is false ?
View SolutionHow many lines of symmetry does the above figure have ?
View SolutionWhich of the following are correct chain isomers of butane ? (i)
View SolutionDetermine the point of symmetry of a regular hexagon.
View SolutionDtermine the images of the following figure about the given line :
View SolutionMatch the following Column A to Column B

View SolutionMatch the following Column A to Column B

View SolutionMatch the following Column A to Column B

View SolutionThe inequation represented by the graph given below is :
View SolutionThe inequation that best describes the graph given below is _________
View SolutionThe inequation that best describes the following graph is _________
View SolutionWhich inequations represent the shaded region in the given figure
View SolutionIn Fig, find the value of x.
ltimg src="https://d10lpgp6xz60nq.cloudfront.net/physics_images/PS_MATH_IX_C12_S01_032_Q01.png" width="80%"gt
View Solution
