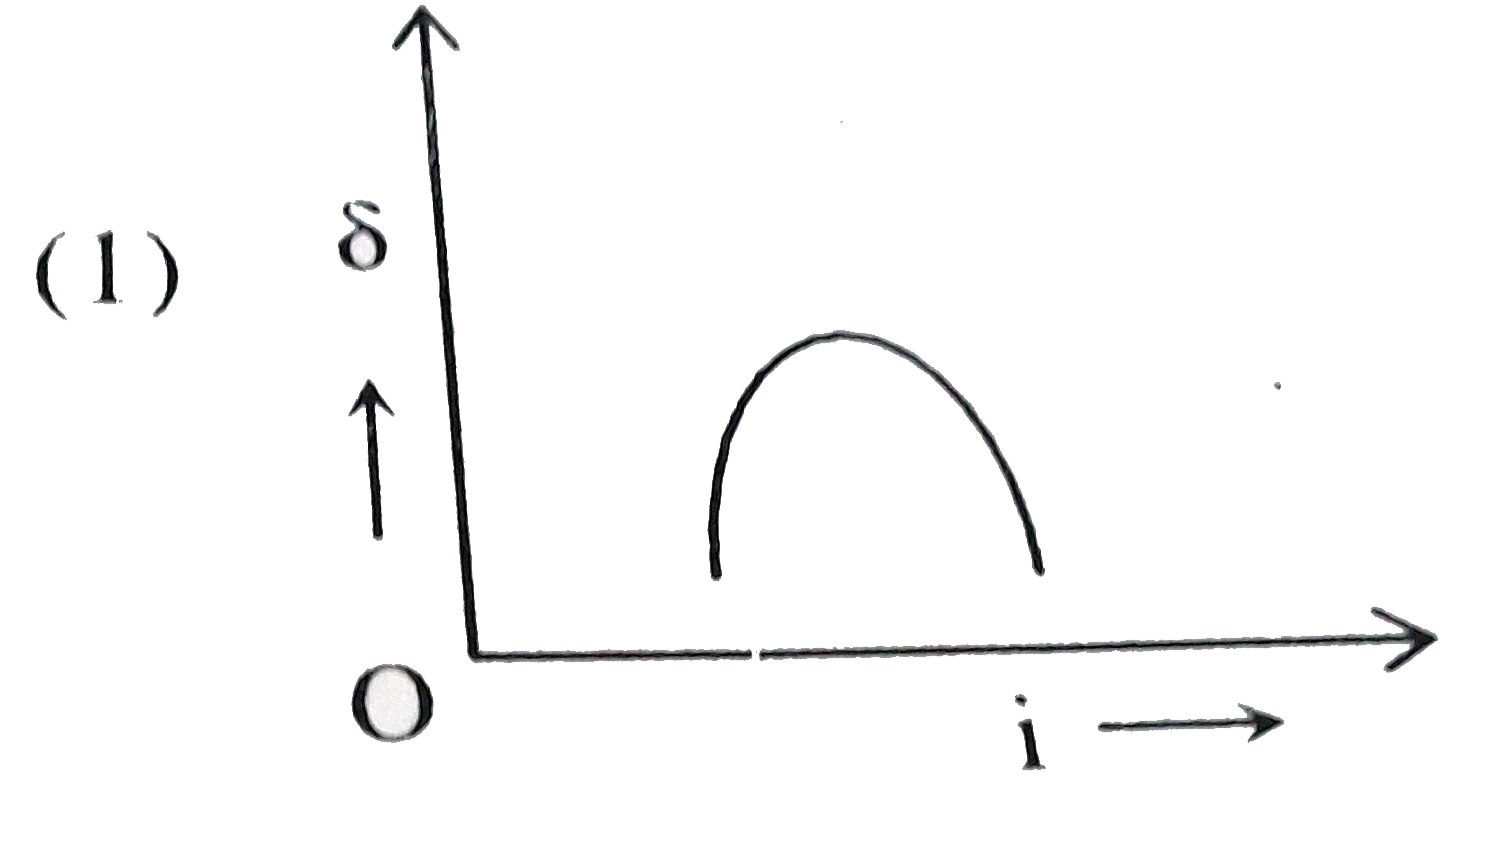
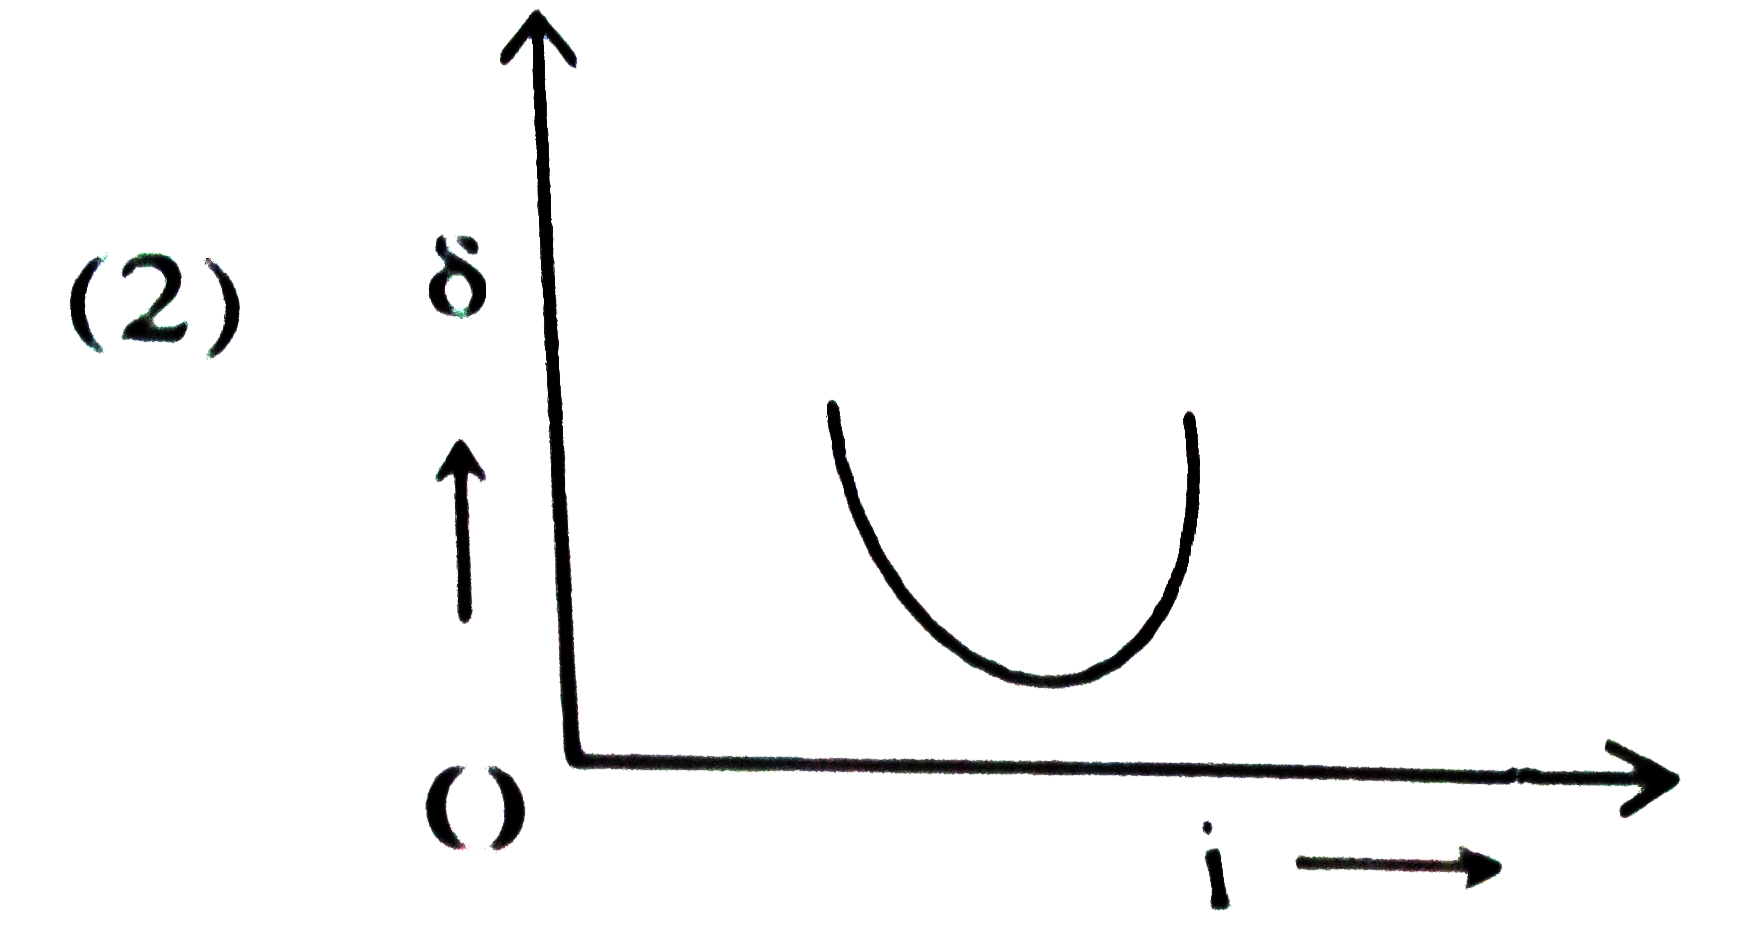
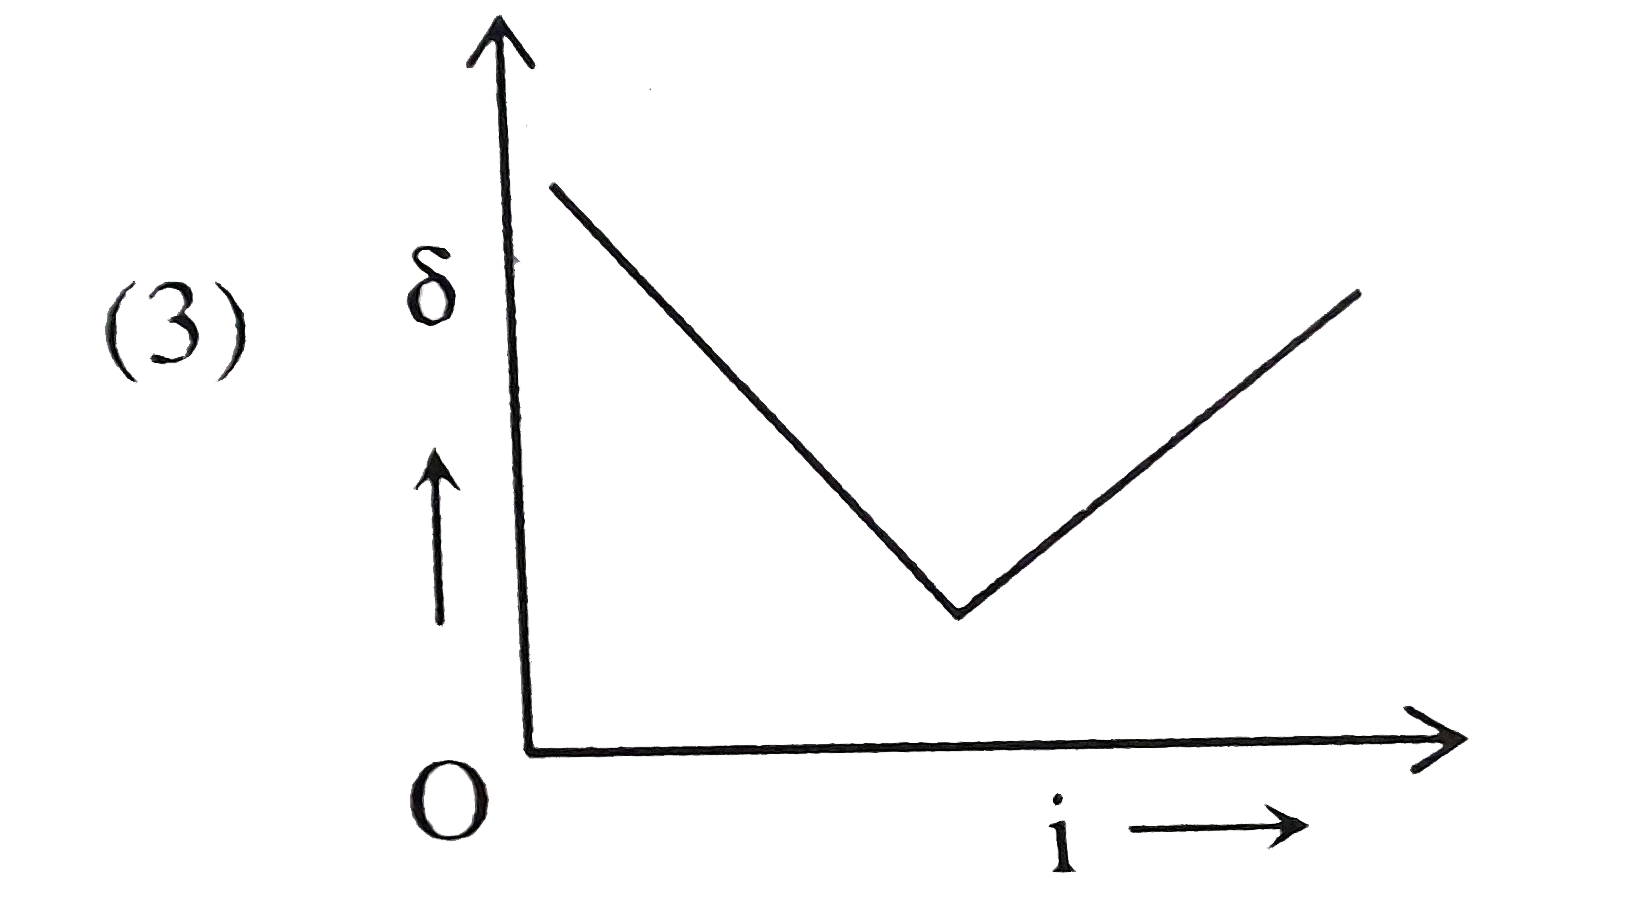
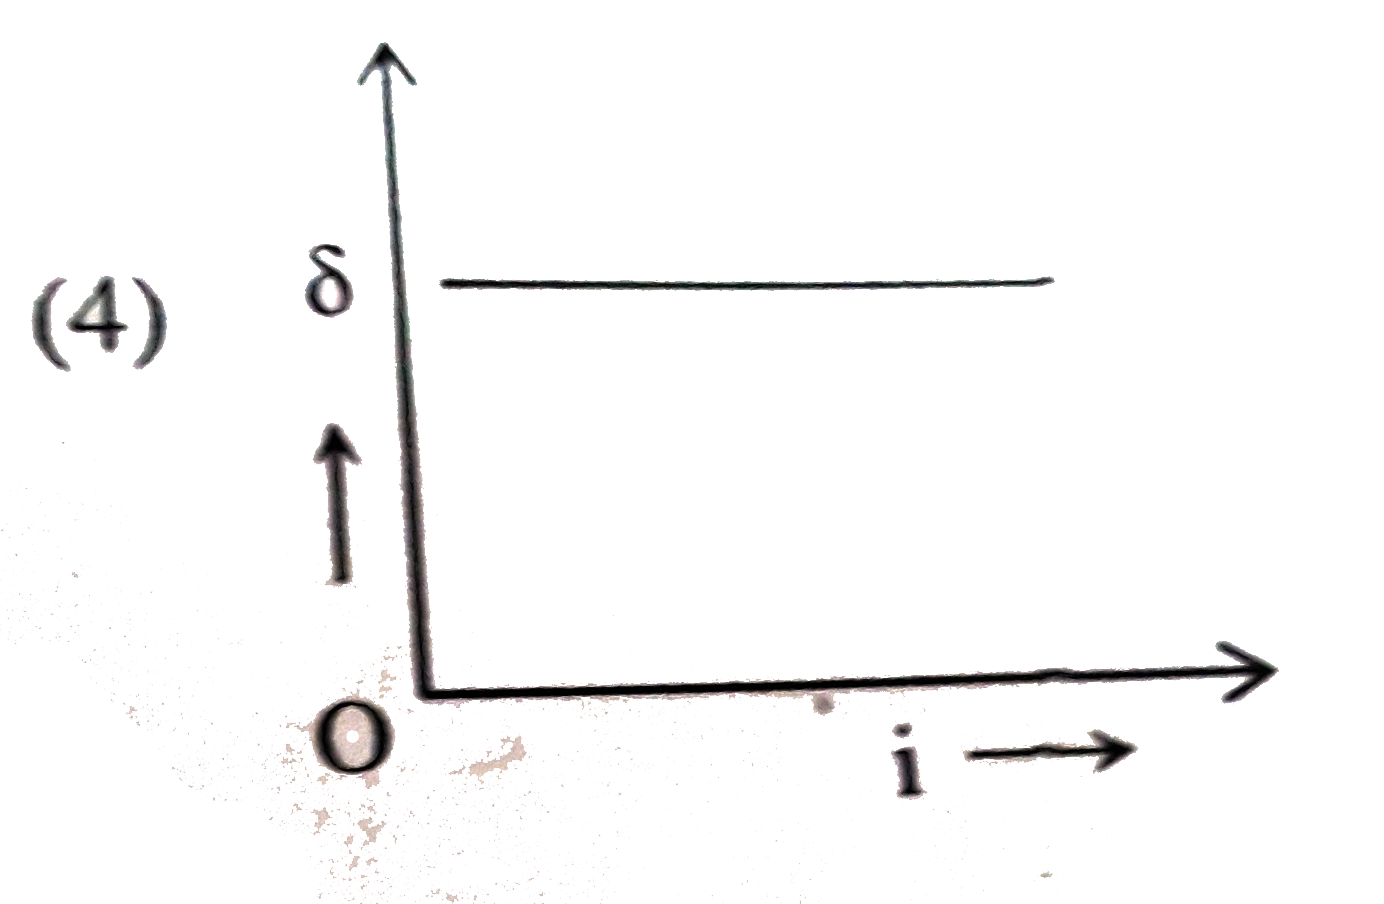
The graph between angle of deviation (δ) and angle of incidence (i) for a triangular prism is represented by
The correct Answer is:B
To solve the problem of the graph between the angle of deviation (δ) and the angle of incidence (i) for a triangular prism, we can follow these steps:
Step 1: Understand the Geometry of the Prism
We start by considering a triangular prism with an apex angle A. When light enters the prism at an angle of incidence (i1), it refracts at the first surface. The light then travels through the prism and exits at the second surface, where it refracts again.
Hint: Visualize the triangular prism and label the angles involved, including the angle of incidence and the apex angle.
Step 2: Define the Angles
Let:
- i1 = angle of incidence at the first surface
- i2 = angle of refraction at the first surface
- δ = angle of deviation
The angle of deviation (δ) can be expressed in terms of i1 and the apex angle A of the prism. The relationship can be given as:
δ=i1+i2−A
Hint: Write down the relationship between the angles involved and how they relate to the deviation.
Step 3: Apply Snell's Law
Using Snell's Law at the first interface, we have:
n1sin(i1)=n2sin(i2)
where n1 is the refractive index of air (approximately 1) and n2 is the refractive index of the prism material.
Hint: Remember that Snell's Law relates the angles of incidence and refraction to the refractive indices of the two media.
Step 4: Analyze the Deviation
The angle of deviation (δ) will vary with the angle of incidence (i1). Initially, as i1 increases from 0, δ will decrease until it reaches a minimum value. This minimum occurs when i1 = i2, which indicates a symmetrical situation.
Hint: Consider how the deviation changes as the angle of incidence increases. Look for points of symmetry in the graph.
Step 5: Determine the Behavior of the Graph
1. As i1 increases from 0, δ decreases.
2. At a certain point, δ reaches a minimum value.
3. Beyond this point, as i1 continues to increase, δ starts to increase again.
This behavior results in a characteristic curve that has a minimum point.
Hint: Sketch the graph based on the behavior described. The graph should show a U-shaped curve with a minimum point.
Step 6: Conclude the Graph Shape
The final graph between the angle of deviation (δ) and the angle of incidence (i) for a triangular prism is a U-shaped curve. The minimum deviation occurs at a specific angle of incidence where the angles of incidence and refraction are equal.
Hint: Label the axes of your graph and indicate the minimum point clearly.
Final Solution
The graph between the angle of deviation (δ) and the angle of incidence (i) for a triangular prism is a U-shaped curve, showing that the deviation decreases to a minimum and then increases as the angle of incidence increases.
---
We start by considering a triangular prism with an apex angle A. When light enters the prism at an angle of incidence (i1), it refracts at the first surface. The light then travels through the prism and exits at the second surface, where it refracts again.
Let:
- i1 = angle of incidence at the first surface
- i2 = angle of refraction at the first surface
- δ = angle of deviation
δ=i1+i2−A
Using Snell's Law at the first interface, we have:
n1sin(i1)=n2sin(i2)
where n1 is the refractive index of air (approximately 1) and n2 is the refractive index of the prism material.
The angle of deviation (δ) will vary with the angle of incidence (i1). Initially, as i1 increases from 0, δ will decrease until it reaches a minimum value. This minimum occurs when i1 = i2, which indicates a symmetrical situation.
1. As i1 increases from 0, δ decreases.
2. At a certain point, δ reaches a minimum value.
3. Beyond this point, as i1 continues to increase, δ starts to increase again.
The final graph between the angle of deviation (δ) and the angle of incidence (i) for a triangular prism is a U-shaped curve. The minimum deviation occurs at a specific angle of incidence where the angles of incidence and refraction are equal.
The graph between the angle of deviation (δ) and the angle of incidence (i) for a triangular prism is a U-shaped curve, showing that the deviation decreases to a minimum and then increases as the angle of incidence increases.
Similar Questions
(a) Plot a graph for angle of deviation as a function of angle of incidence for a triangular prism.
(b) Derive the relation for the refractive index of the prism in terms of the angle of minimum deviation and angle of prism.
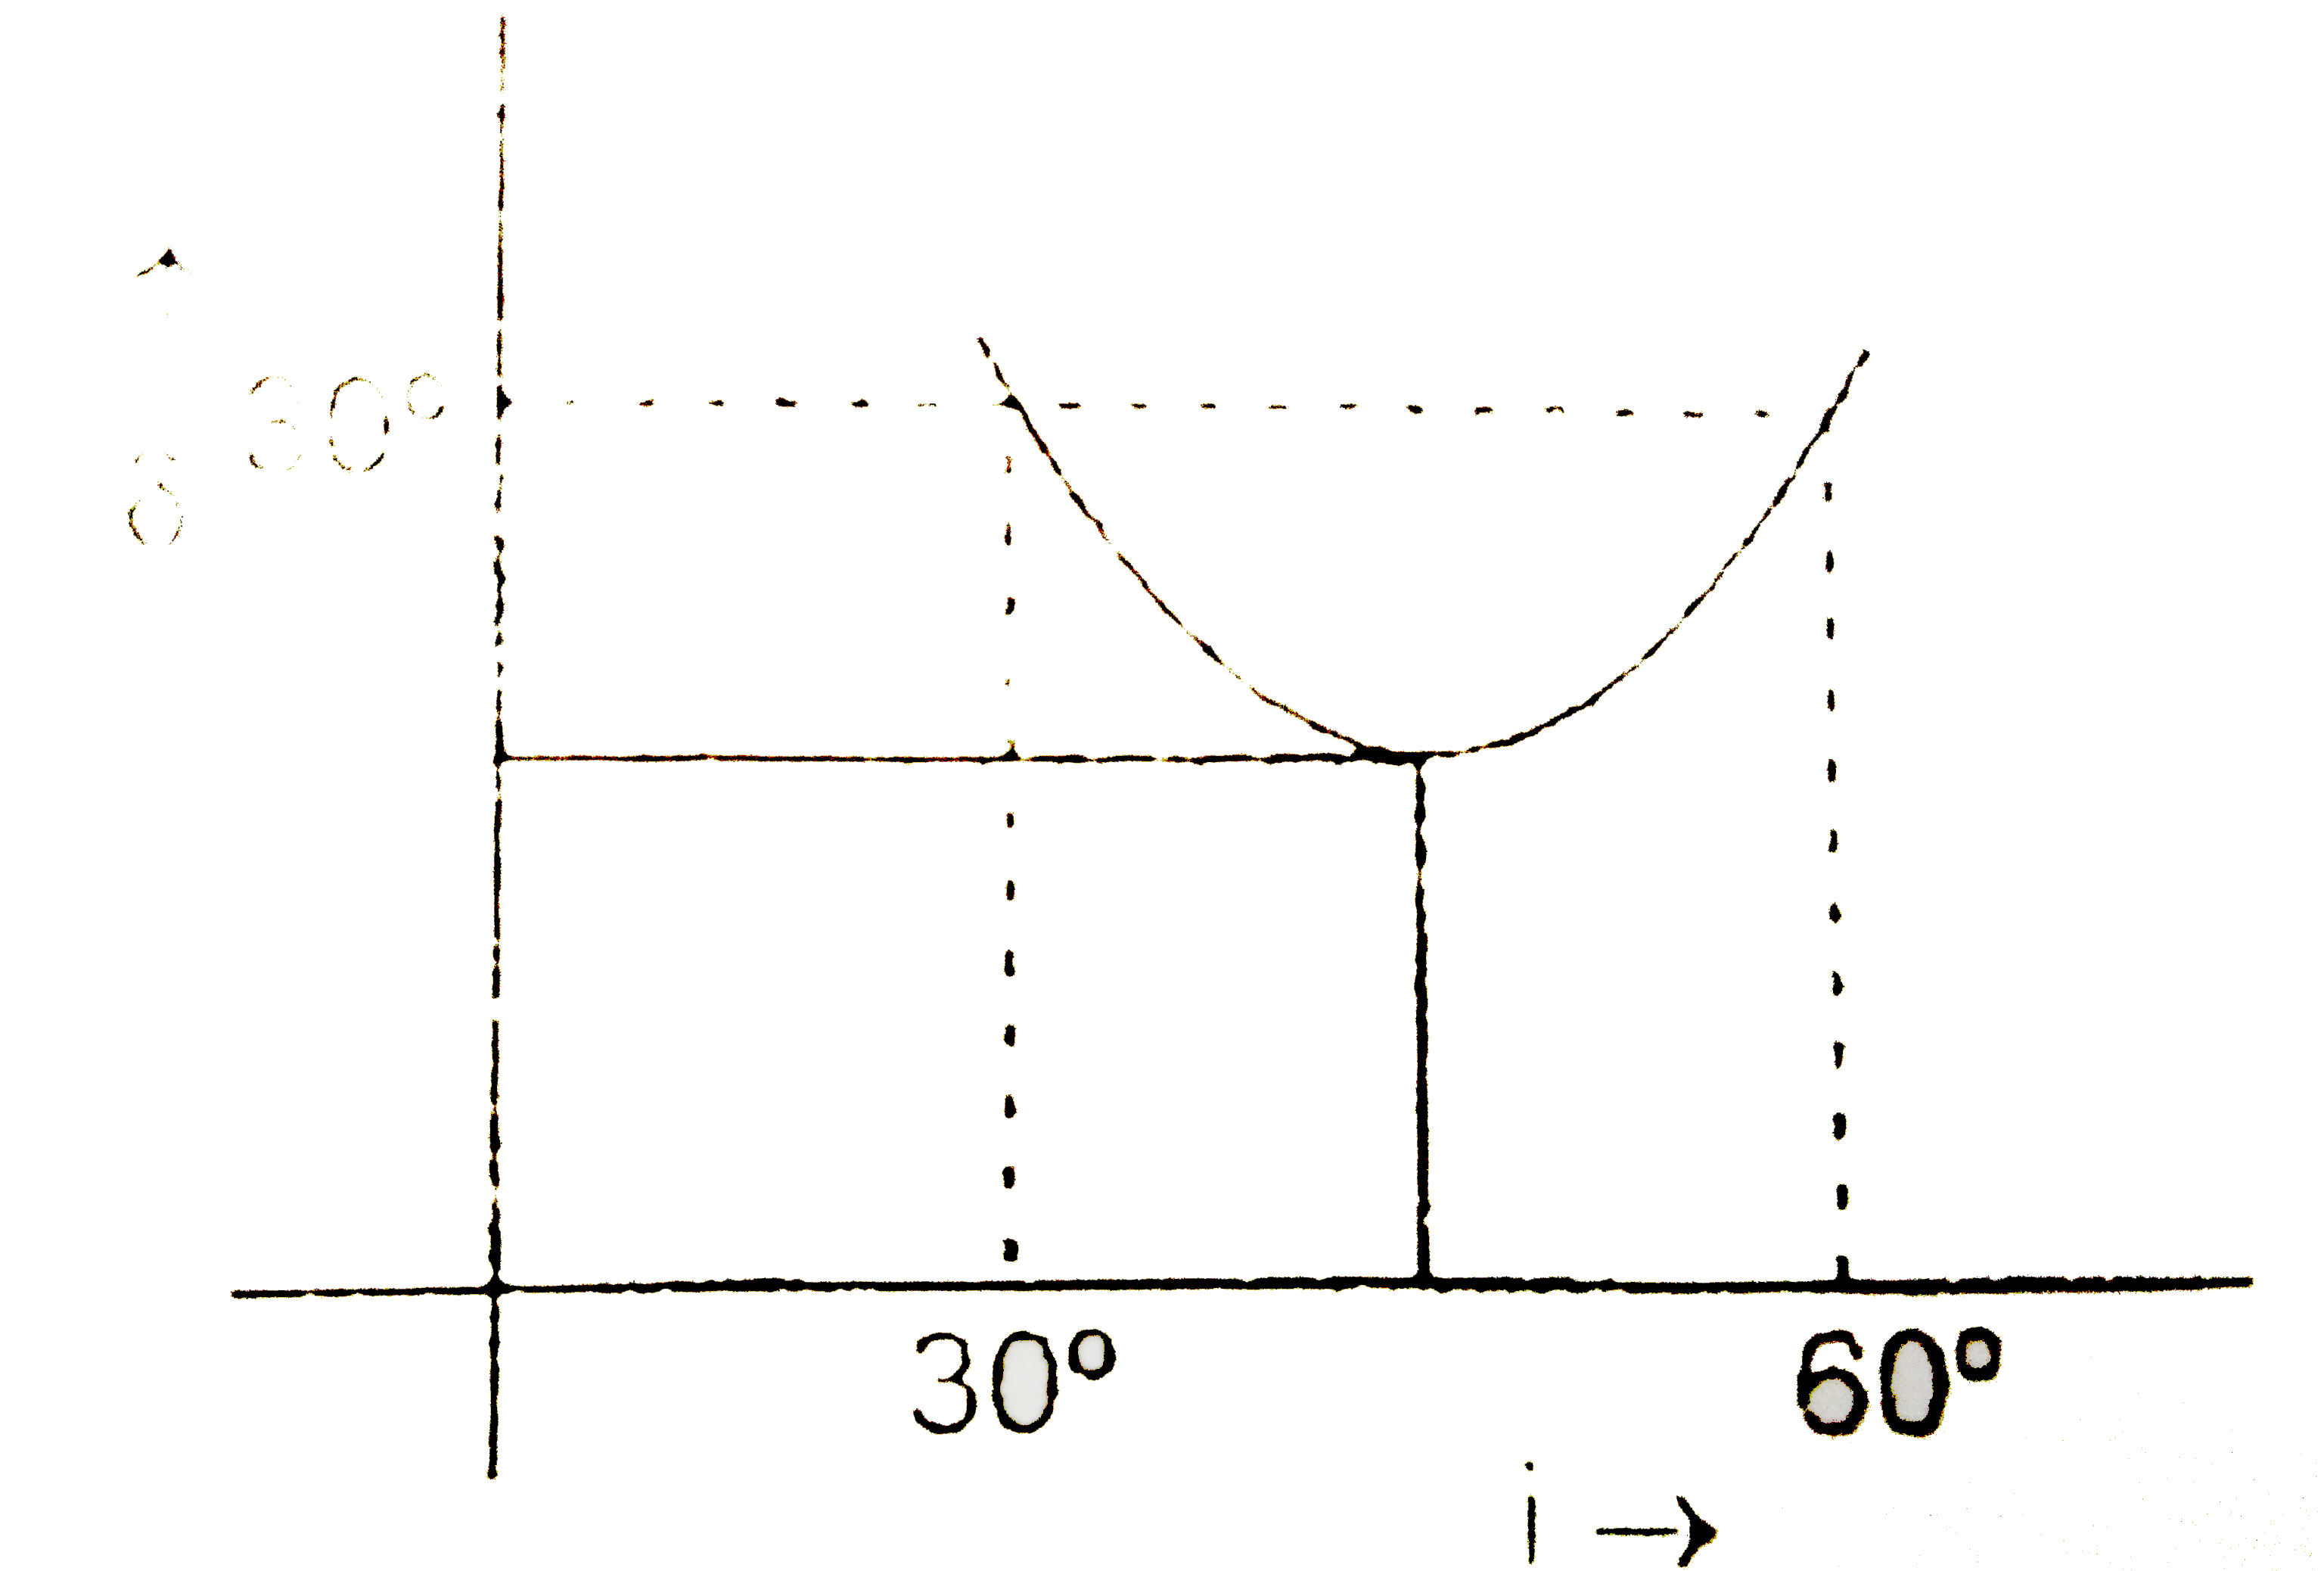
View SolutionFrom the graph fo angle of deviation δ versus angle of incidwence i. Find the prism angle
View SolutionThe angle of deviation (δ) vs angle of ancidence (i) is plotted for a prism. Pick up the correct statement.

View SolutionThe relation between angle of incidence i, angle of prism A and angle of minimum deviation for a triangular prism is.
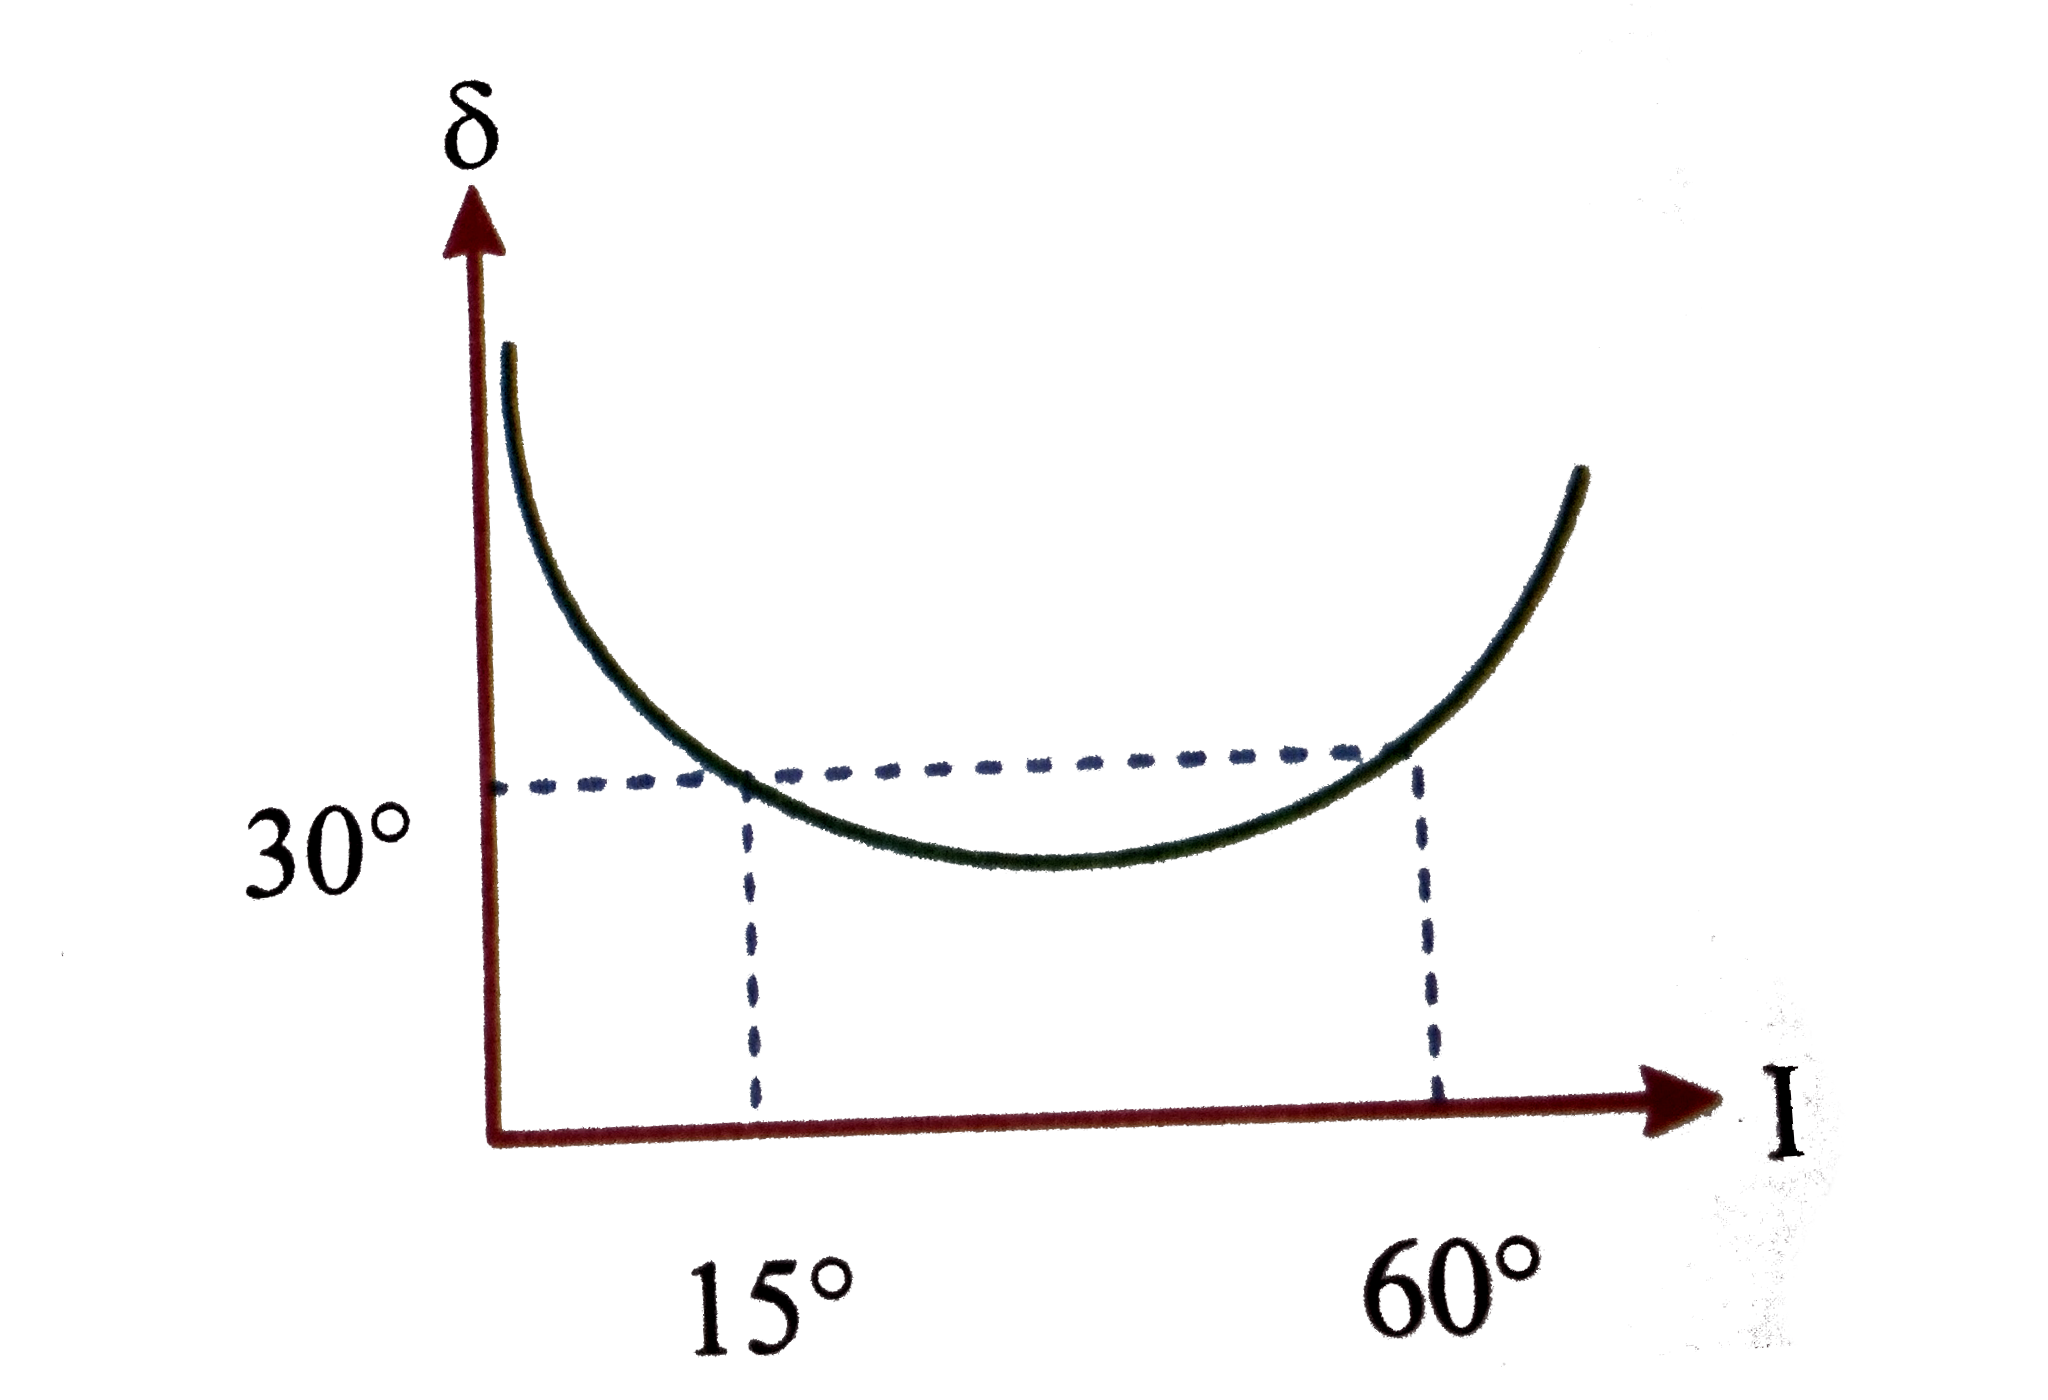
View SolutionA plot between the angle of deviation and angle of incidence is shown in figure. From the graph one can say that the prism angle is
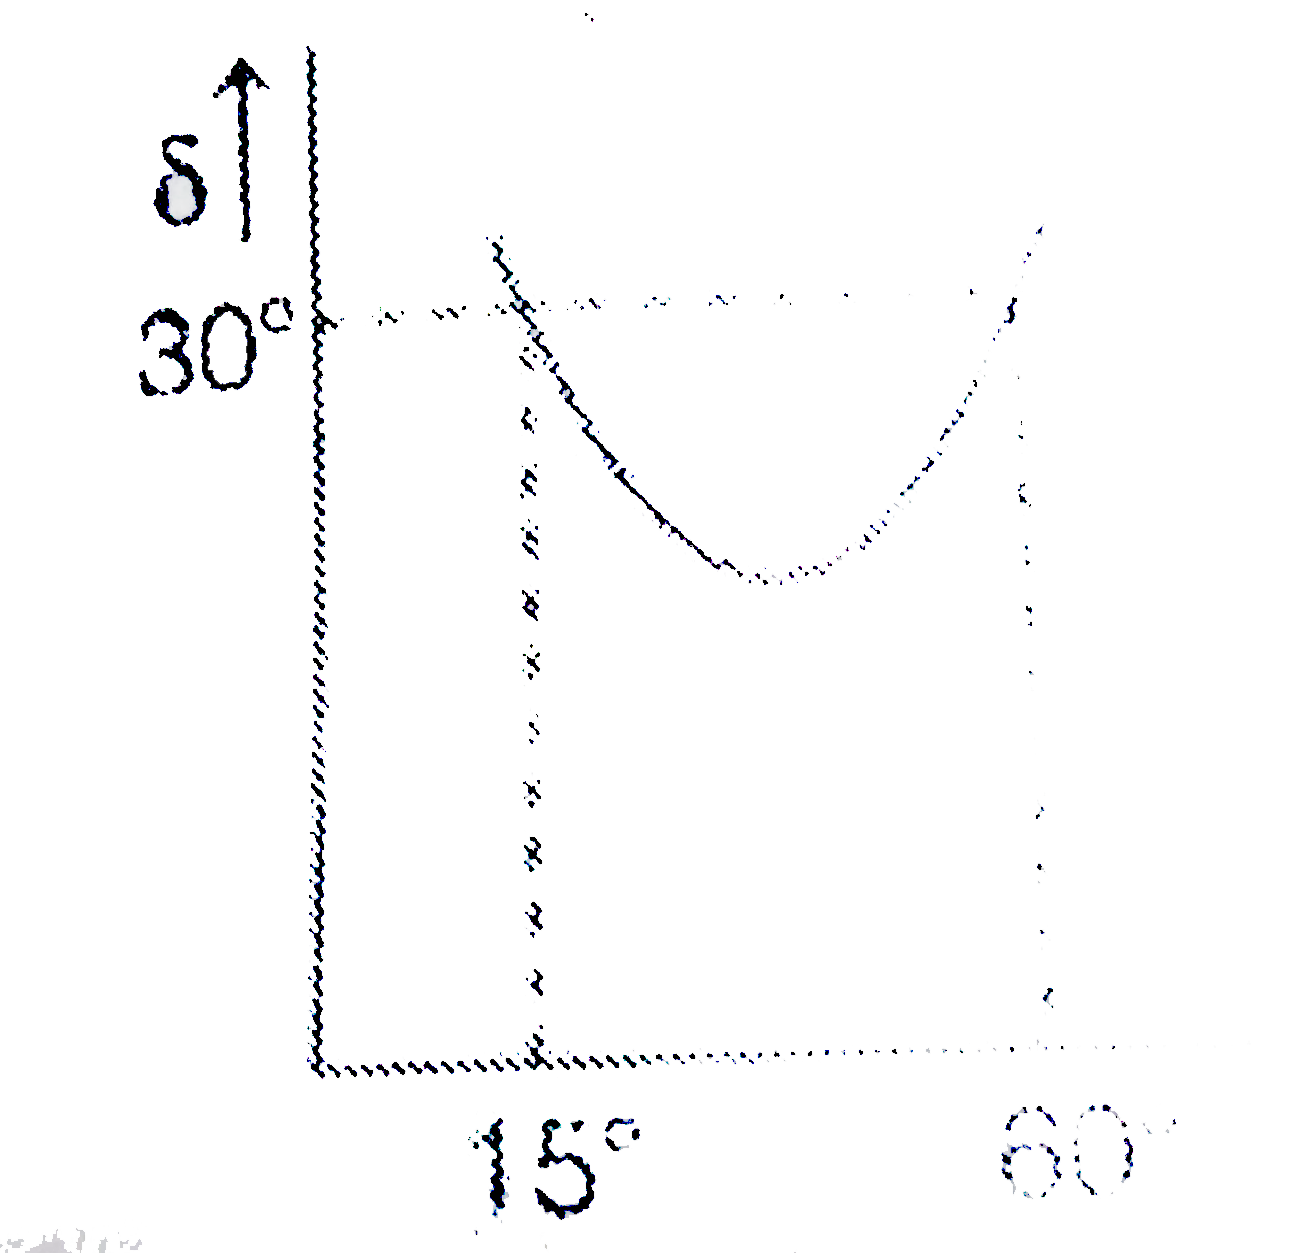
View SolutionFigure shows graph of deviation δ versus angle of incidence for a light ray striking a prism. Angle of prism is
View Solution(a) Define the following when refraction takes place through an equilateral glass prism
(i) angle of incidence (ii) prism (iii) refracting angle of prism (iv) angle of emergence (v) angle of deviation
(b) How are angle of incidence, angle of prism, angle of emergence and angle of deviation related to each other?
View Solution(i) Plot a graph to show variation of the angle of deviation as function of angle of incidence for light passing through a prism. Derive an expression for refractive index of the prism in terms of angle of minimum deviation and angles of prism.
(ii) What is dispersion of light ? Why is its cause ?
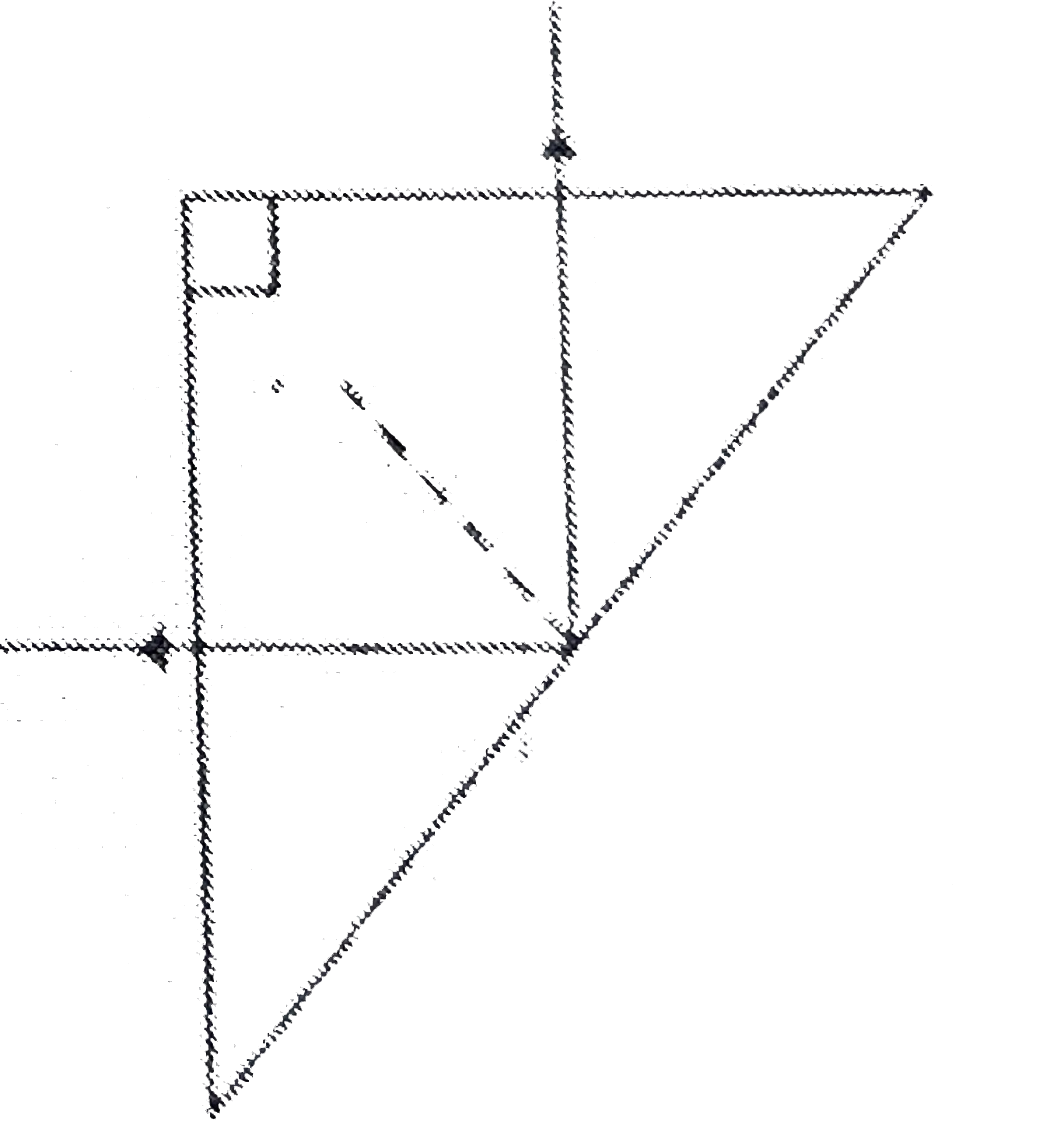
(iii) A ray of light incident normally on one face of a right isosceles prism is totally reflected as shown in fig . what must be the minimum value of refractive index of glass ? Give relevant calculations
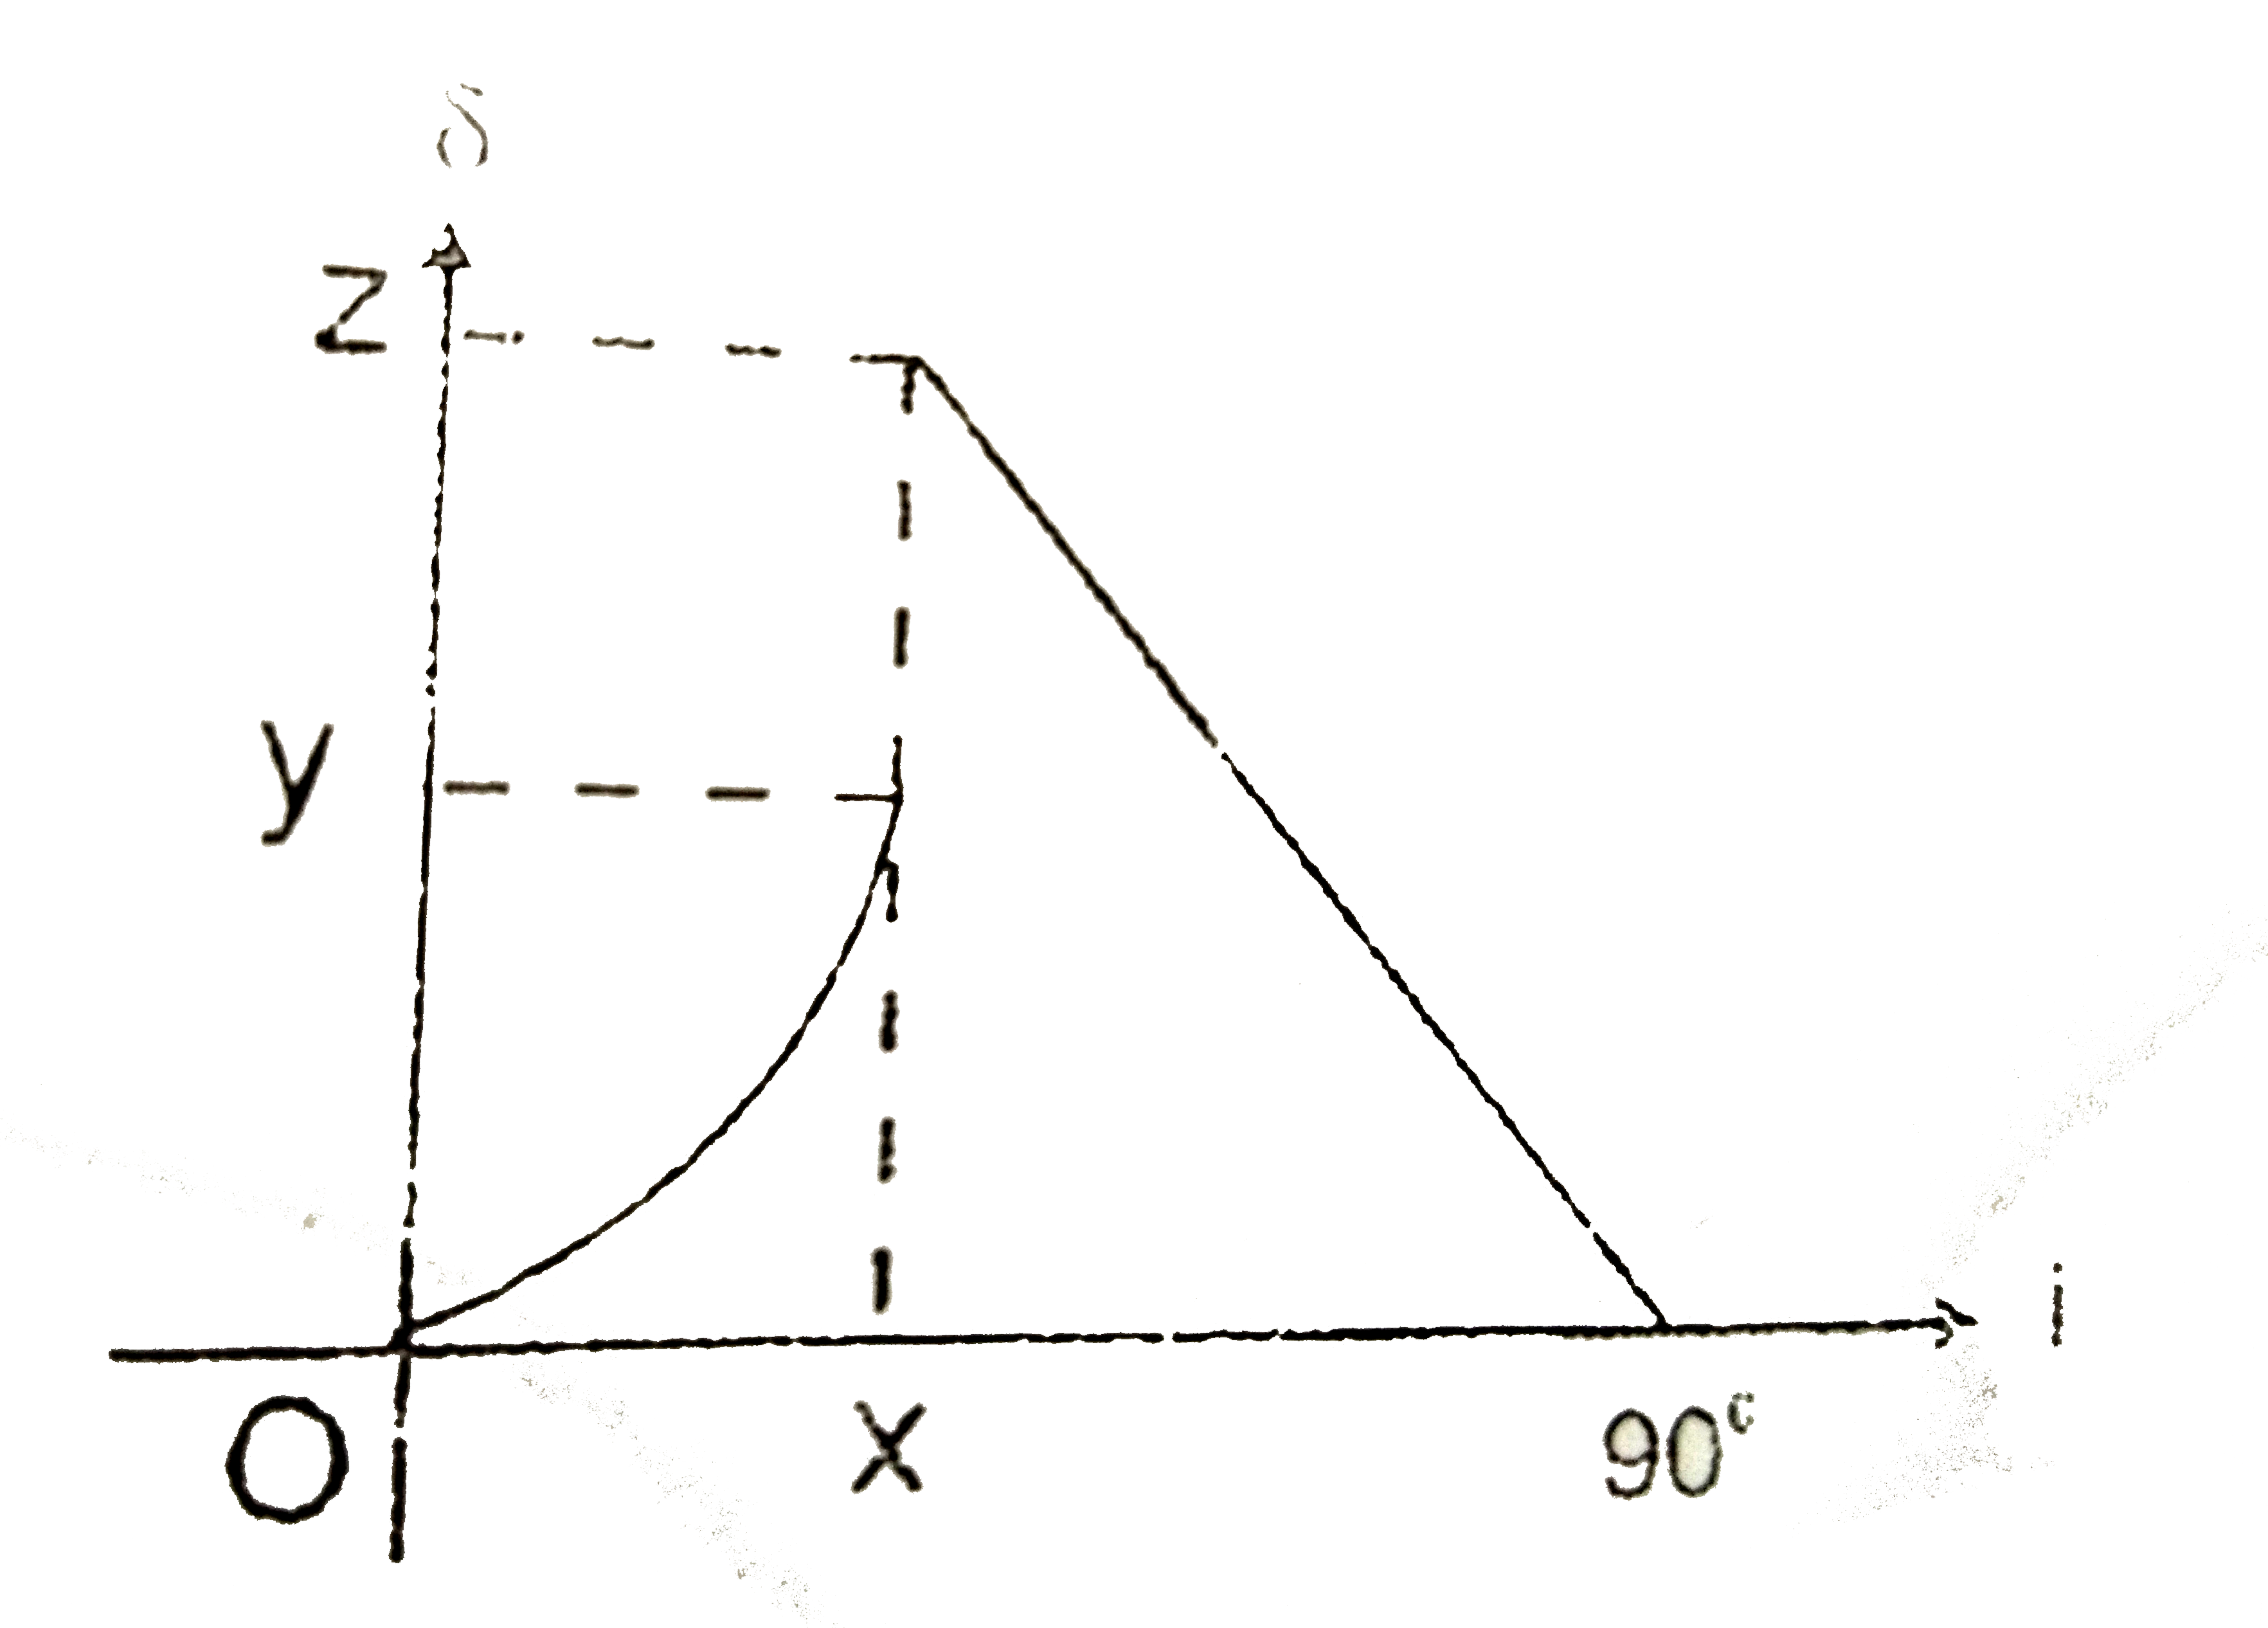
View SolutionLight is incident from glass to are. The variation of the angle of deviation δ with the angle of incidence i for 0<i<90∘ If the value of (x+y+z) is nπ6 then value of n.
View Solution(a) How does the angle of deviation produced by a prism change with increase in the angle of incidence. Draw a curve showing the variation in the angle of deviation with the angle of incidence at a prism surface.
(b) Using the curve in part (a) above, how do you infer that for a given prism, the angle of minimum deviation δmin is unique for a given light.
View Solution

