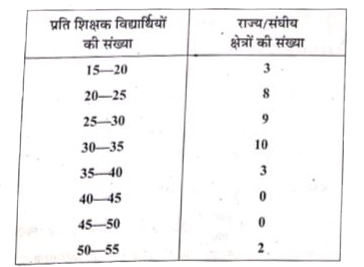
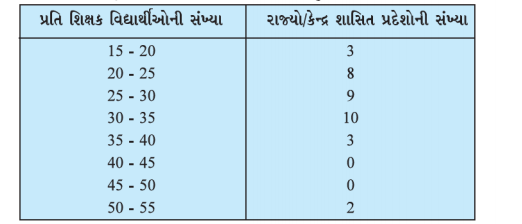
The following distribution distribution given the state-wise, teacher-student ratio in higher secondary schools of India. Find the mode and mean of this data. Interpret the two measures.
 Solution in Tamil
The correct Answer is:Median = 137 units, Mean = 137.05 units, Mode = 135.76 units.
The three measures are approximately the same in this case.
Step by step video & image solution for The following distribution distribution given the state-wise, teacher-student ratio in higher secondary schools of India. Find the mode and mean of this data. Interpret the two measures. by Maths experts to help you in doubts & scoring excellent marks in Class 10 exams.
Updated on:21/07/2023Similar Questions
The inequation represented by the graph given below is :
View SolutionThe inequation that best describes the graph given below is _________
View SolutionThe inequation that best describes the following graph is _________
View Solutionनिम्नलिखित बंटन भारत के उच्चतर माध्यमिक स्कूलो में राज्यों के अनुसार शिक्षक - विधार्थी अनुपात को दर्शाता है। इन आकड़ो के बहुलक और माध्य ज्ञात कीजिए। दोनों मापको की व्यख्या कीजिए।

View SolutionThe following distribution gives the state-wise teacher-student ratio in higher secondary schools of India. Find the mode and mean of this data. Interpret the two measures.


View SolutionThe following distribution distribution given the state-wise, teacher-student ratio in higher secondary schools of India. Find the mean of this data.

View SolutionThe following distribution distribution given the state-wise, teacher-student ratio in higher secondary schools of India. Find the mode and mean of this data. Interpret the two measures.

View SolutionIn the given fig. If DE||BC Find EC.
ltimg src="https://d10lpgp6xz60nq.cloudfront.net/physics_images/MATH_241_X_SQP_E01_021_Q01.png" width="80%"gt
View Solution
