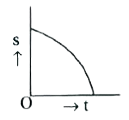
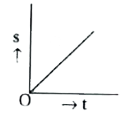
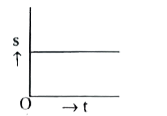
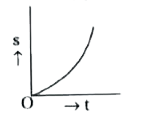
Under the source of constant power a body start to move . Which one of following graph truly represents the change of displacement (s) with time (t) ?Solution in Gujrati


The correct Answer is:D
P=Fv
=mast [∴F=ma,v=st]
=m×st2×st [∴a=st2]
= In ms2t3
P,m are constant
∴s2∝t3 ∴Graph of s→t
∴S∝t(32) same as in (D)
Similar Questions
A body is moving indirectionally under the influence of a source of constant power . Its displacement in time t is proportional to
View SolutionA body is moving under the expense of a constant power. If 'X' is the displacement in time 't', then 'x' is proportional to
View SolutionA body is moving undirectionally under the influence of a source of constant power. It displacement in time t is proportional to
View SolutionA body is moving under the expense of a constant power. If 'X' is the displacement in time 't', then 'x' is proportional to
View SolutionA body is moving undirectionally under the influence of a source of constant power. It displacement in time t is proportional to
View SolutionA body starts from rest, under the action of an engine working at a constant power and moves along a straight line. The displacement S is given as a function of time (t) as:
View SolutionA body is moving unidirectionally under the influence of a source of constant power. Its displacement in time t is proportional to
View Solution

