Which of the following figure represents the variation of particle momentum and the associated de - Broglie wavelength ?
The correct Answer is:D
To solve the problem of determining which figure represents the variation of particle momentum and the associated de Broglie wavelength, we can follow these steps:
1. Understand the Relationship: The de Broglie wavelength (λ) is related to the momentum (p) of a particle by the equation:
λ=hp
where h is Planck's constant.
2. Identify the Inverse Relationship: From the equation, we can see that:
λ∝1p
This means that as momentum (p) increases, the de Broglie wavelength (λ) decreases, and vice versa.
3. Rearrange the Equation: We can also express momentum in terms of wavelength:
p=hλ
This shows that momentum is inversely proportional to the wavelength.
4. Differentiate the Relationship: To analyze the nature of the graph, differentiate the equation p=hλ:
dpdλ=−hλ2
The negative sign indicates that as λ increases, p decreases, which suggests a downward curve.
5. Analyze the Graphs: Now we need to evaluate the provided graphs:
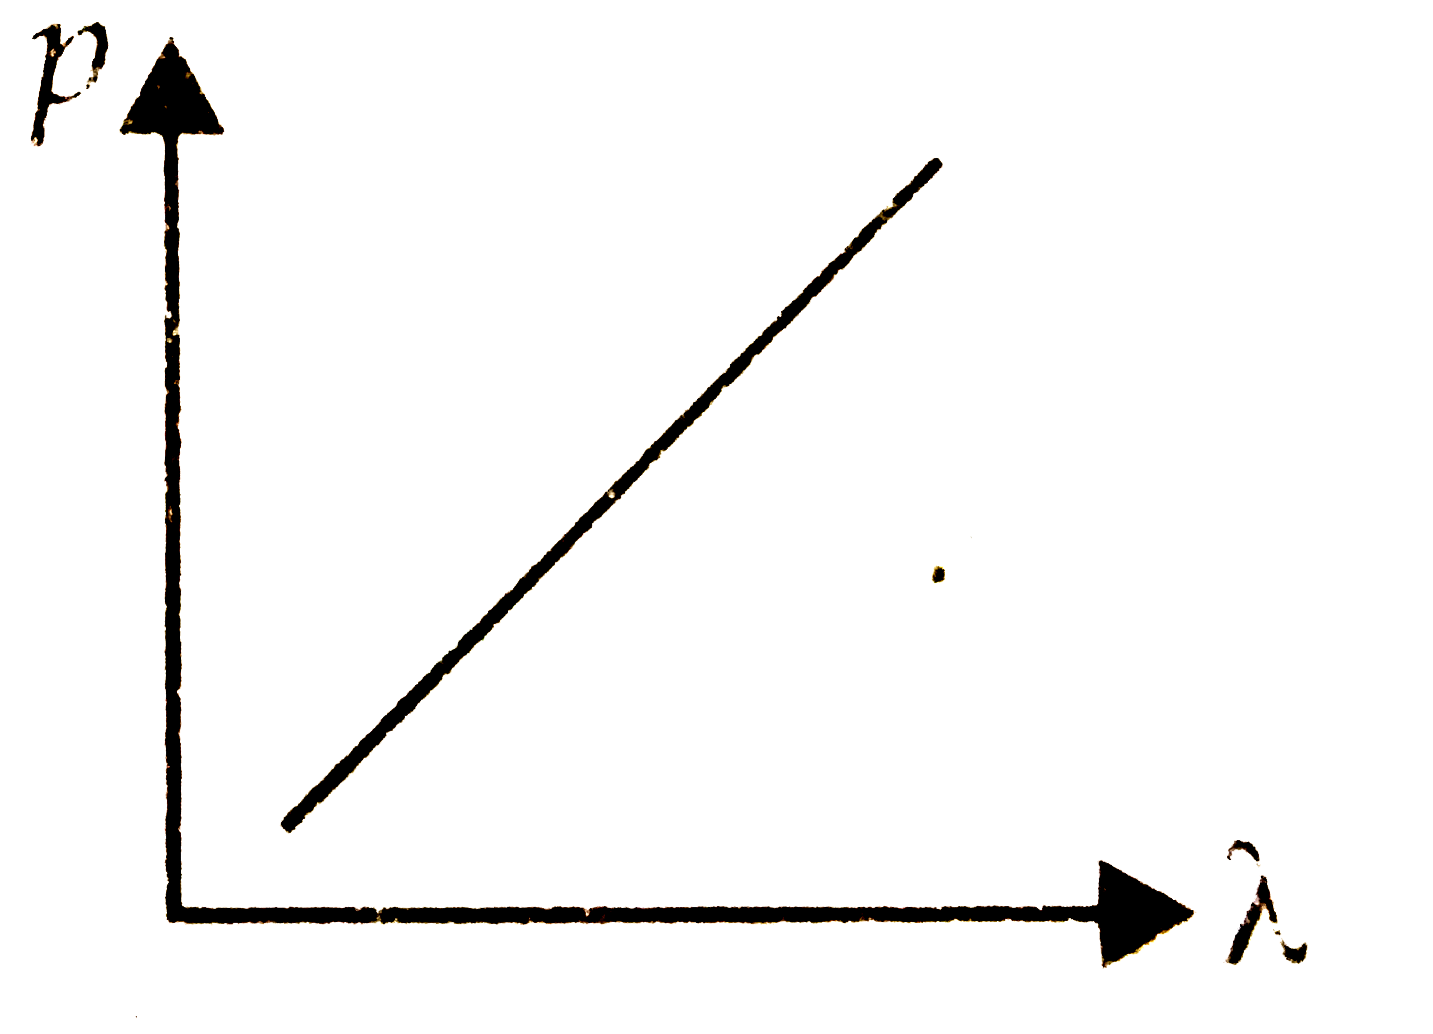
- Graph 1: Linear variation - not possible since the relationship is not linear.
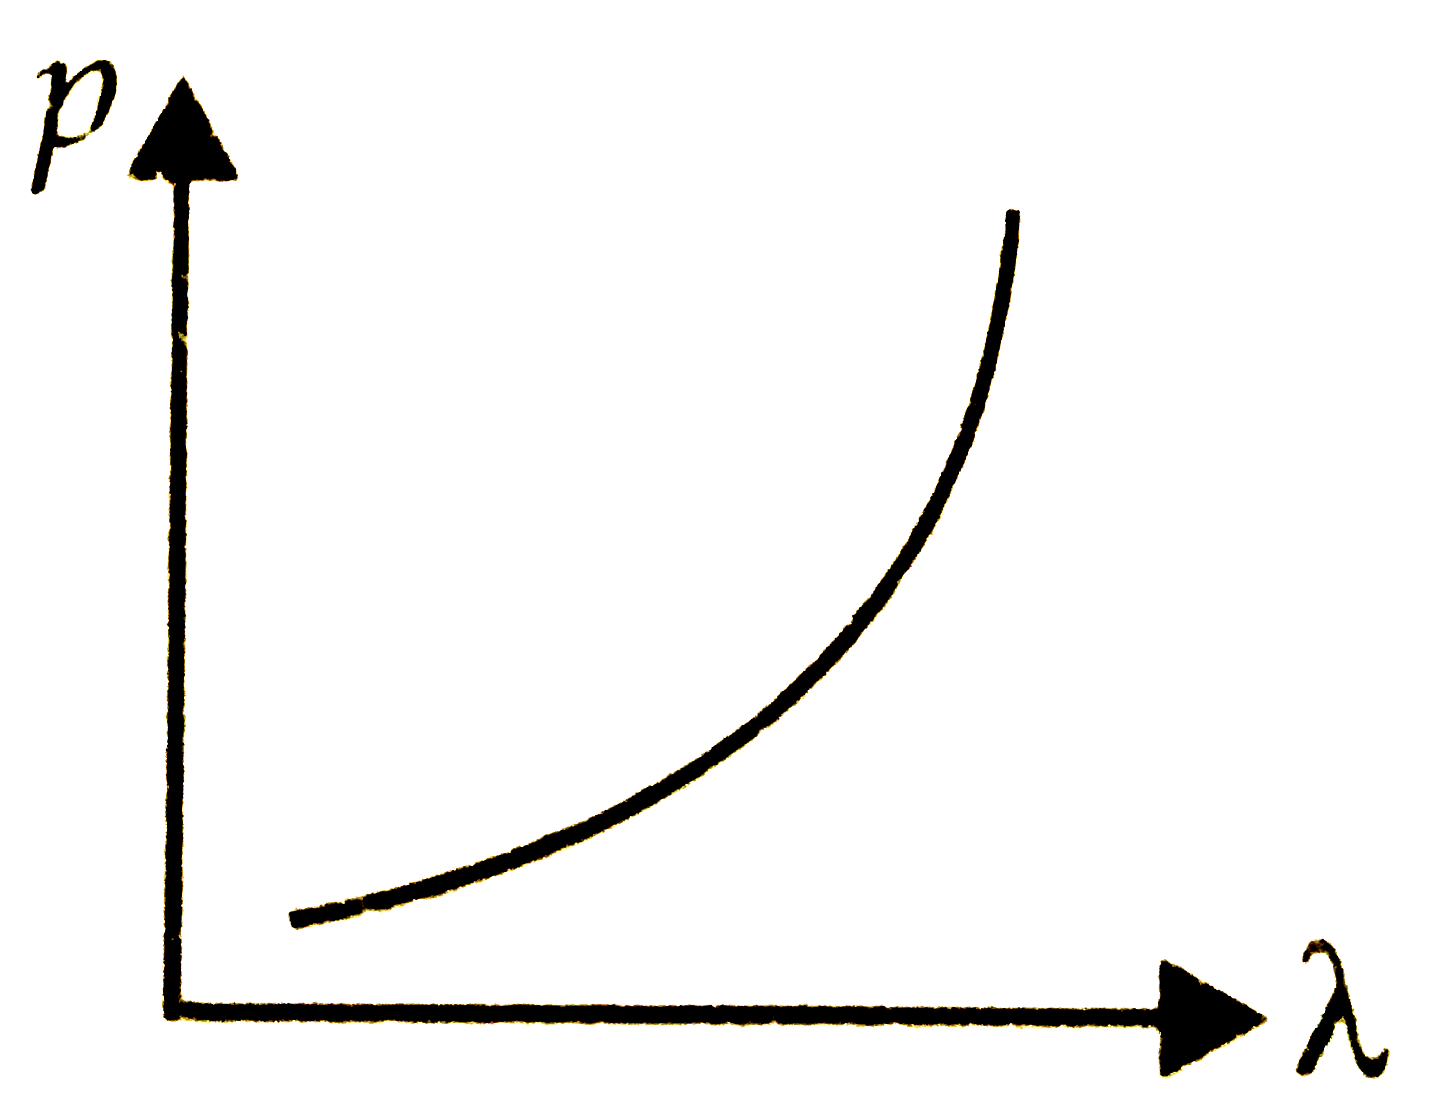
- Graph 2: Curved but λ increases while p also increases - incorrect.
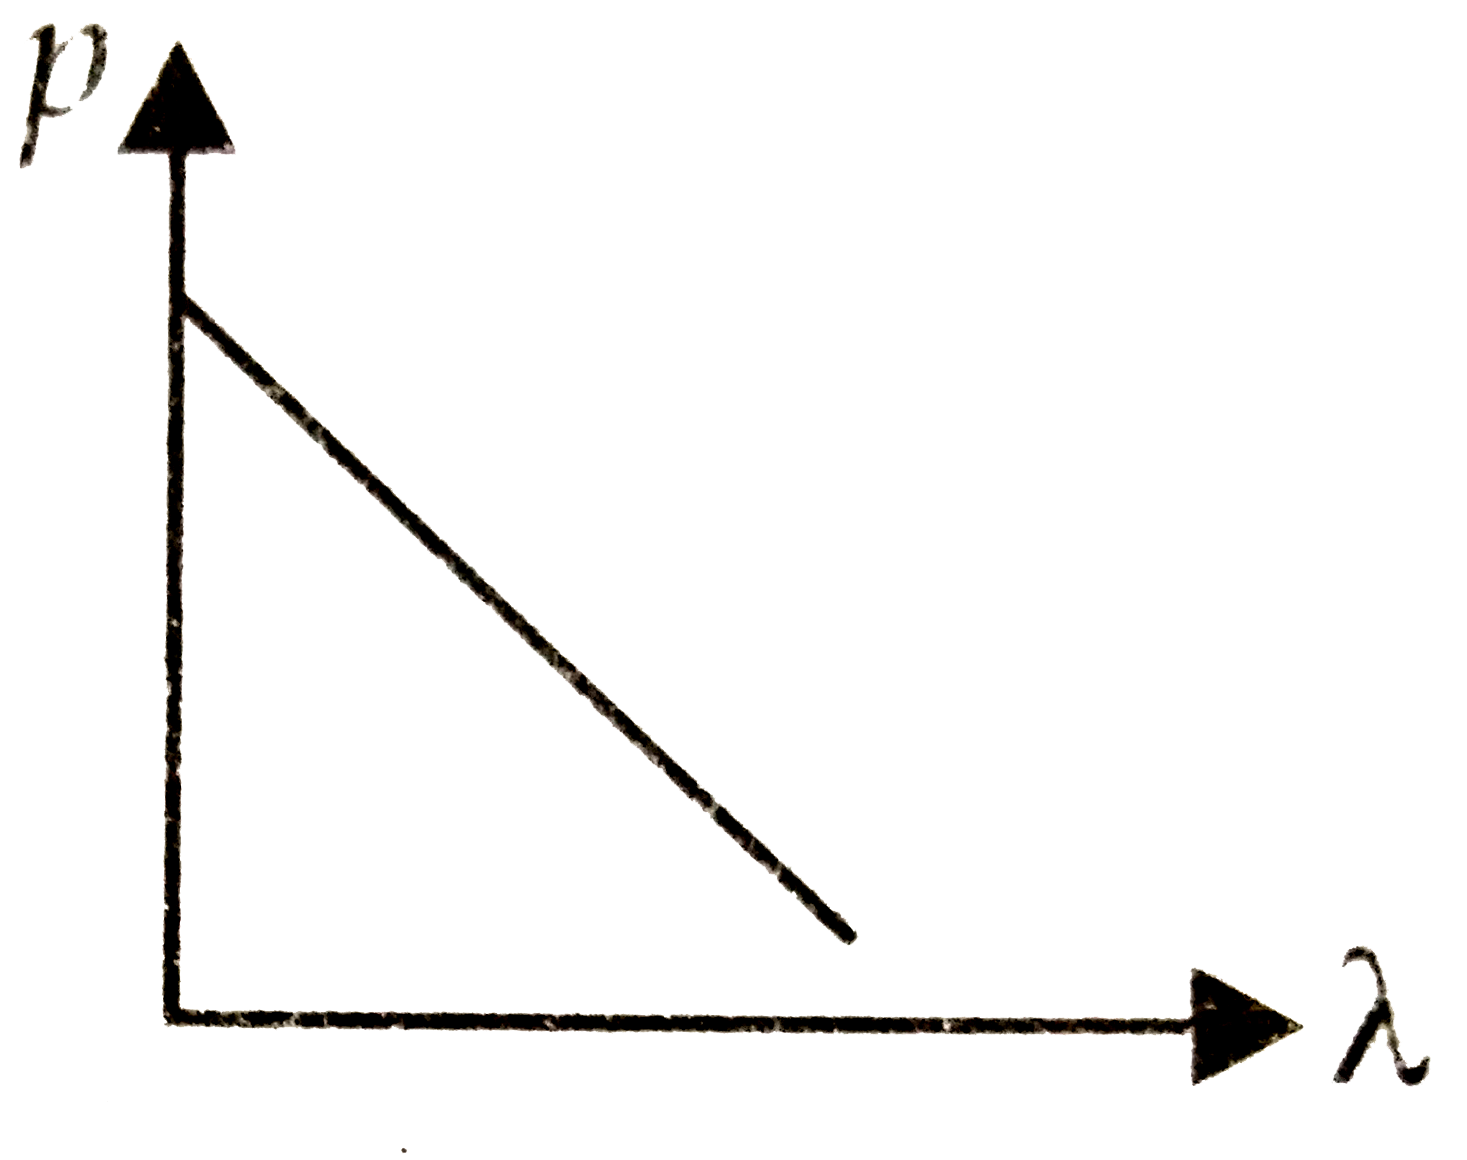
- Graph 3: Linear graph - again not possible.
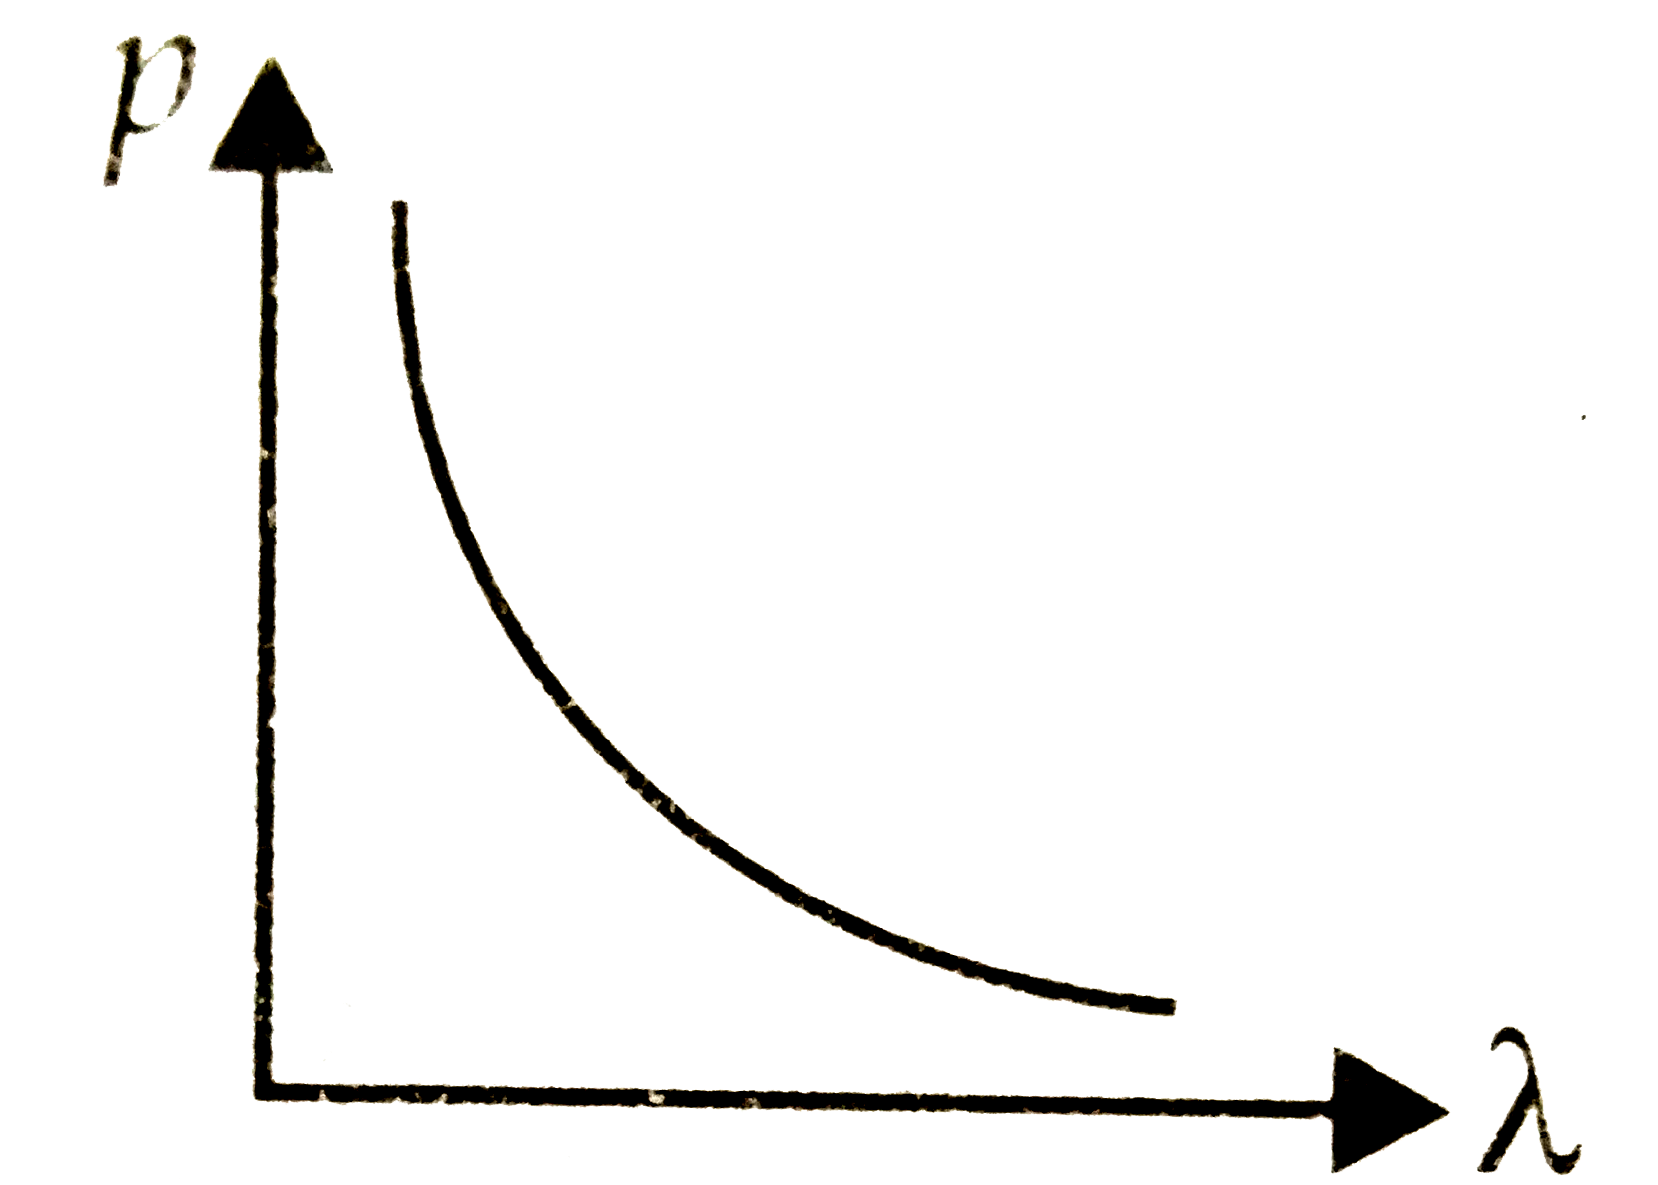
- Graph 4: Curved graph where λ increases and p decreases - this fits our derived relationship.
6. Conclusion: The fourth graph correctly represents the inverse relationship between particle momentum and the associated de Broglie wavelength.
Final Answer:
The correct figure that represents the variation of particle momentum and the associated de Broglie wavelength is Graph 4.
λ=hp
where h is Planck's constant.
λ∝1p
This means that as momentum (p) increases, the de Broglie wavelength (λ) decreases, and vice versa.
p=hλ
This shows that momentum is inversely proportional to the wavelength.
dpdλ=−hλ2
The negative sign indicates that as λ increases, p decreases, which suggests a downward curve.
- Graph 1: Linear variation - not possible since the relationship is not linear.
- Graph 2: Curved but λ increases while p also increases - incorrect.
- Graph 3: Linear graph - again not possible.
- Graph 4: Curved graph where λ increases and p decreases - this fits our derived relationship.
The correct figure that represents the variation of particle momentum and the associated de Broglie wavelength is Graph 4.
Similar Questions
Knowledge Check
The de Broglie wavelength is given by
Ap=2πhλBp=h2λCp=2πhλDp=2πλWhich one of the following graphs in following figure represents variation of de Broglie wavelength (λ) of a particle having linear
A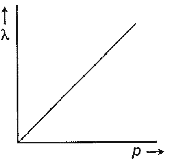 B
B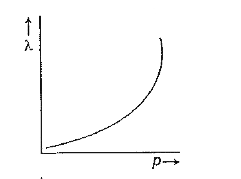 C
C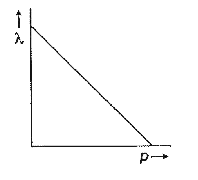 D
D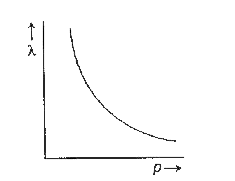
For what kinetic energy of a proton, will the associated de-Broglie wavelength be 16.5 nm?
View SolutionIf the kinetic energy of a moving particle is E , then the de-Broglie wavelength is
View SolutionVeriation of momentum of perticle (p) with associated de-Broglie wavelength (λ) is shown correctly by
View SolutionIn which of the following cases the heavier of the two particles has a smaller de-Broglie wavelength ? The two particles
View SolutionIn which of the following cases the havier of the two particles has a smaller de-Broglie wavelength ? The two particles
View SolutionFor particles having same K.E., the de-Broglie wavelength is
View Solution
