Which of the following graphs be. I represent the qualitative variation of the linear expansivity of a typical metal (say copper) with absolute temperature?
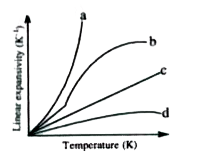
A
a
B
b
C
c
D
d
Text Solution
The correct Answer is:B
|
Topper's Solved these Questions
- THERMAL PROPERTIES OF MATTERBook:AAKASH SERIESChapter:THERMAL PROPERTIES OF MATTERExercise:ADDITIONAL PRACTICE EXERCISE (LEVEL - II) PRACTICE SHEET (ADVANCED) Straight Objective Type Questions (Expansion of Liquids :)
Explore 6 Videos
- THERMAL PROPERTIES OF MATTERBook:AAKASH SERIESChapter:THERMAL PROPERTIES OF MATTERExercise:ADDITIONAL PRACTICE EXERCISE (LEVEL - II) PRACTICE SHEET (ADVANCED) Straight Objective Type Questions (Expansion of Gases & KTG :)
Explore 9 Videos
- THERMAL PROPERTIES OF MATTERBook:AAKASH SERIESChapter:THERMAL PROPERTIES OF MATTERExercise:ADDITIONAL PRACTICE EXERCISE (LEVEL - II) PRACTICE SHEET (ADVANCED) Straight Objective Type Questions (Thermometry:)
Explore 8 Videos
- SYSTEM OF PARTICLES AND ROTATIONAL MOTIONBook:AAKASH SERIESChapter:SYSTEM OF PARTICLES AND ROTATIONAL MOTIONExercise:PRACTICE EXERCISE
Explore 99 Videos
- THERMODYNAMICSBook:AAKASH SERIESChapter:THERMODYNAMICSExercise:EXERCISE - 3
Explore 33 Videos
Similar Questions
Knowledge Check
Which of the following graphs best represents the variation of acceleration 'a' with displacement x?
A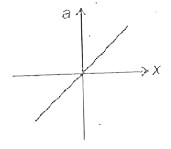 B
B C
C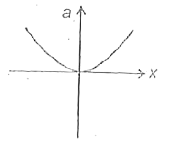 D
D
At a constant pressure, of the following graphs that one which represents the variation of the density of an ideal gas with the absolute temperature T, is
A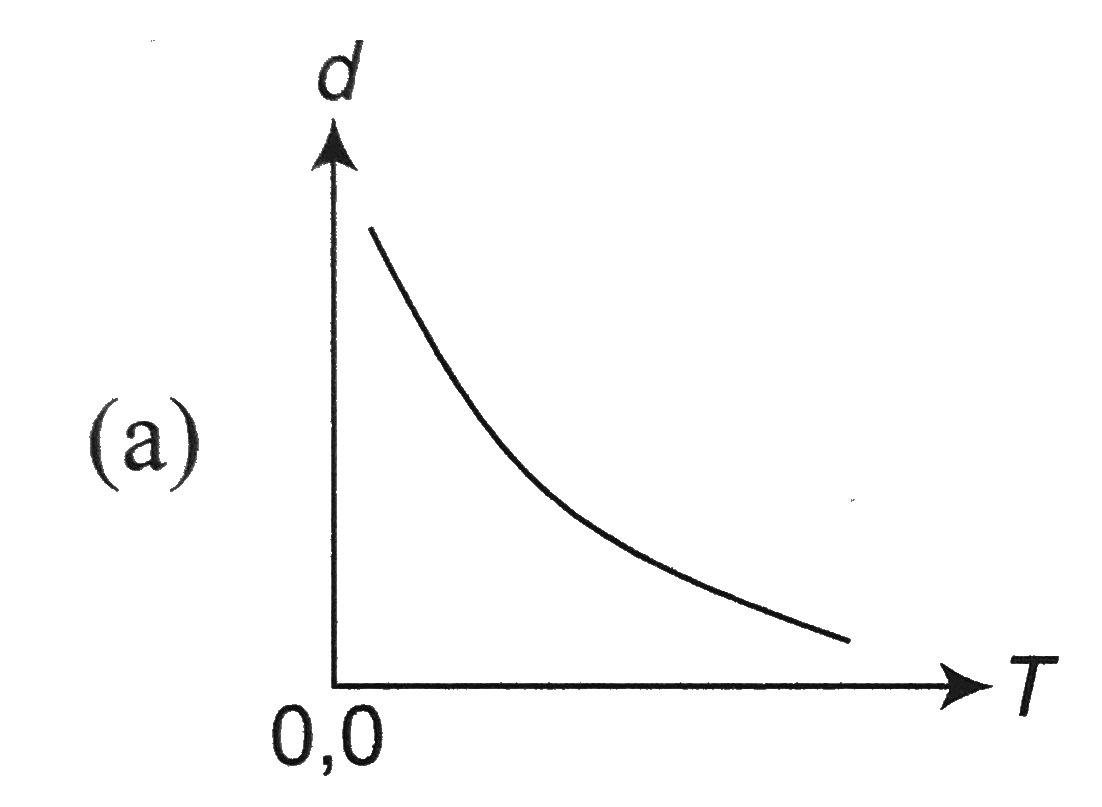 B
B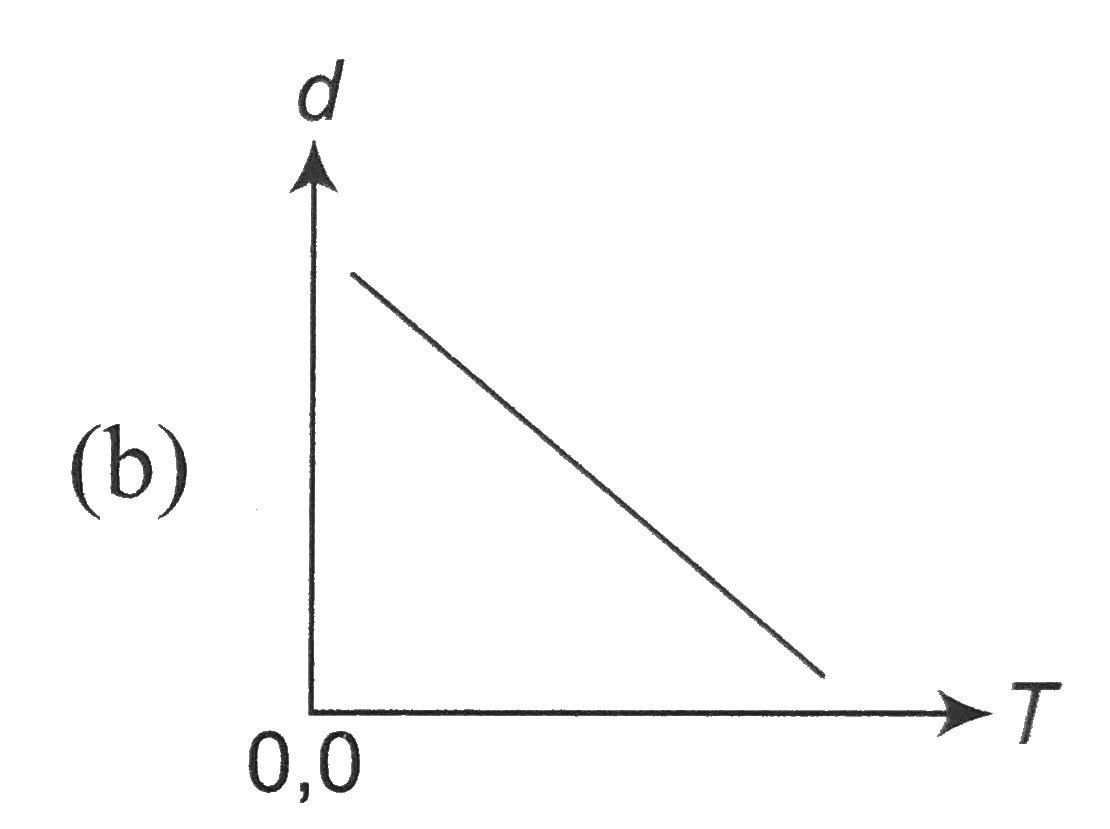 C
C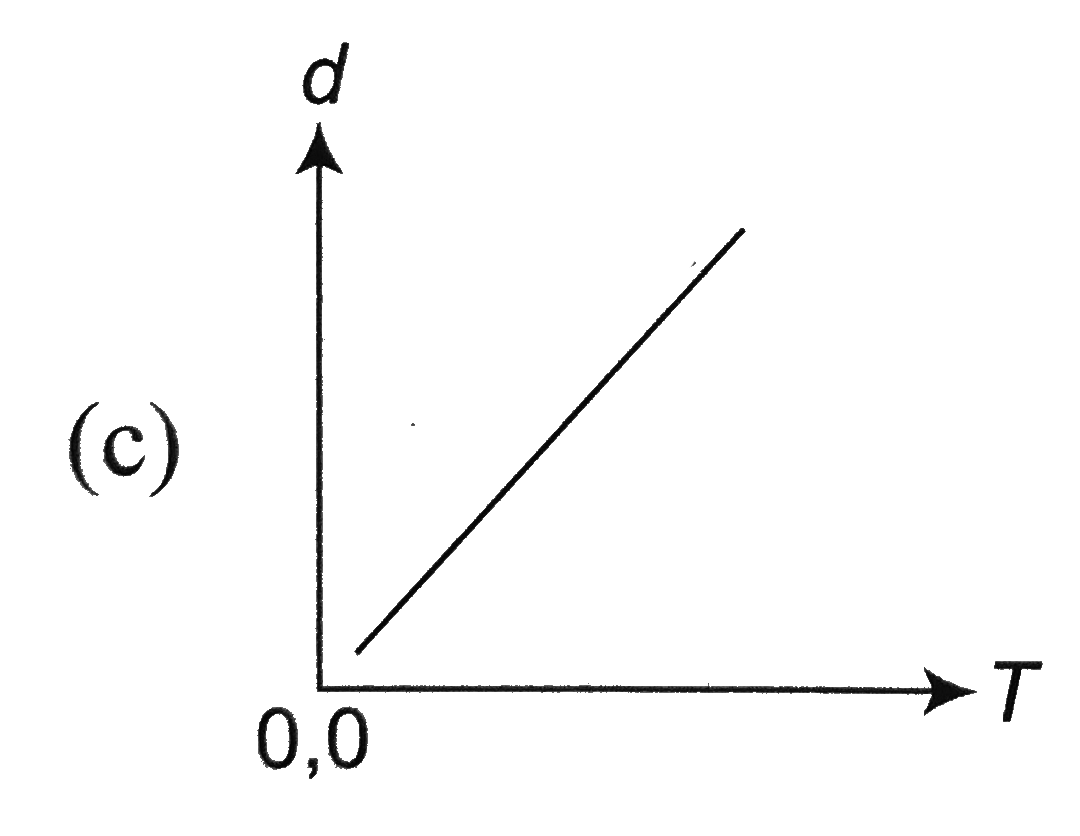 D
D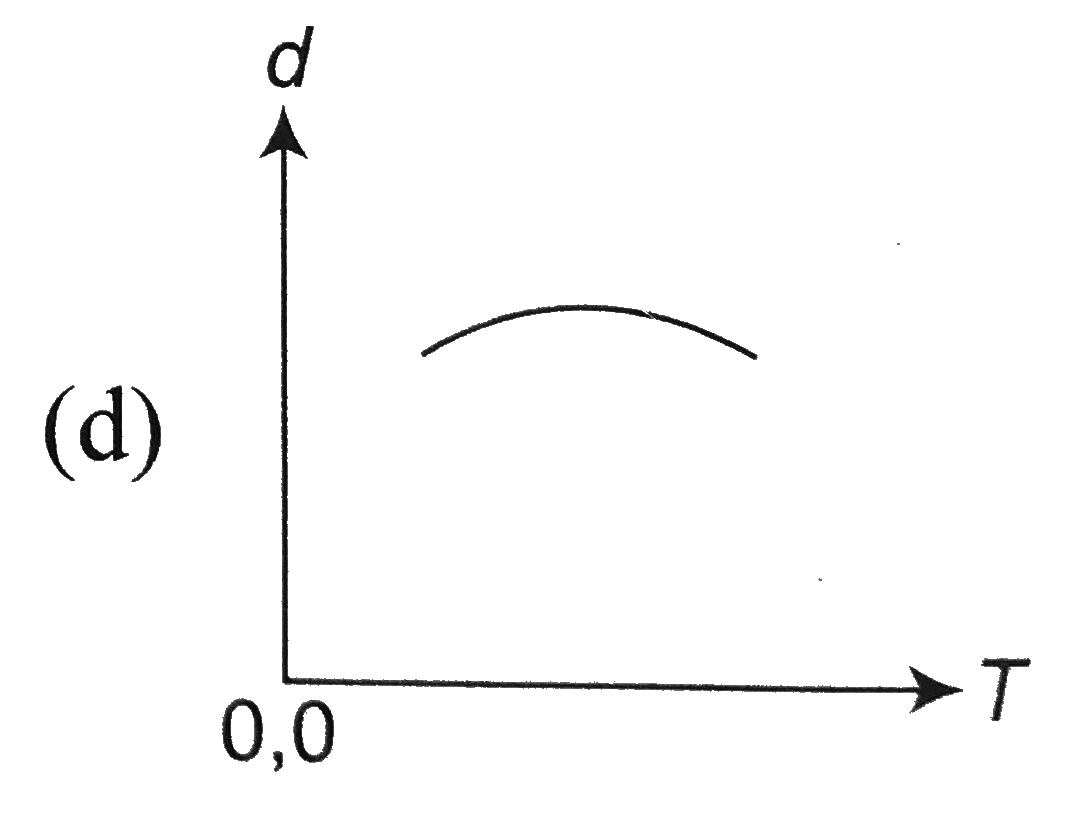
Which one of the following graphs represents variation of specific heat capacity of water with temperature?
A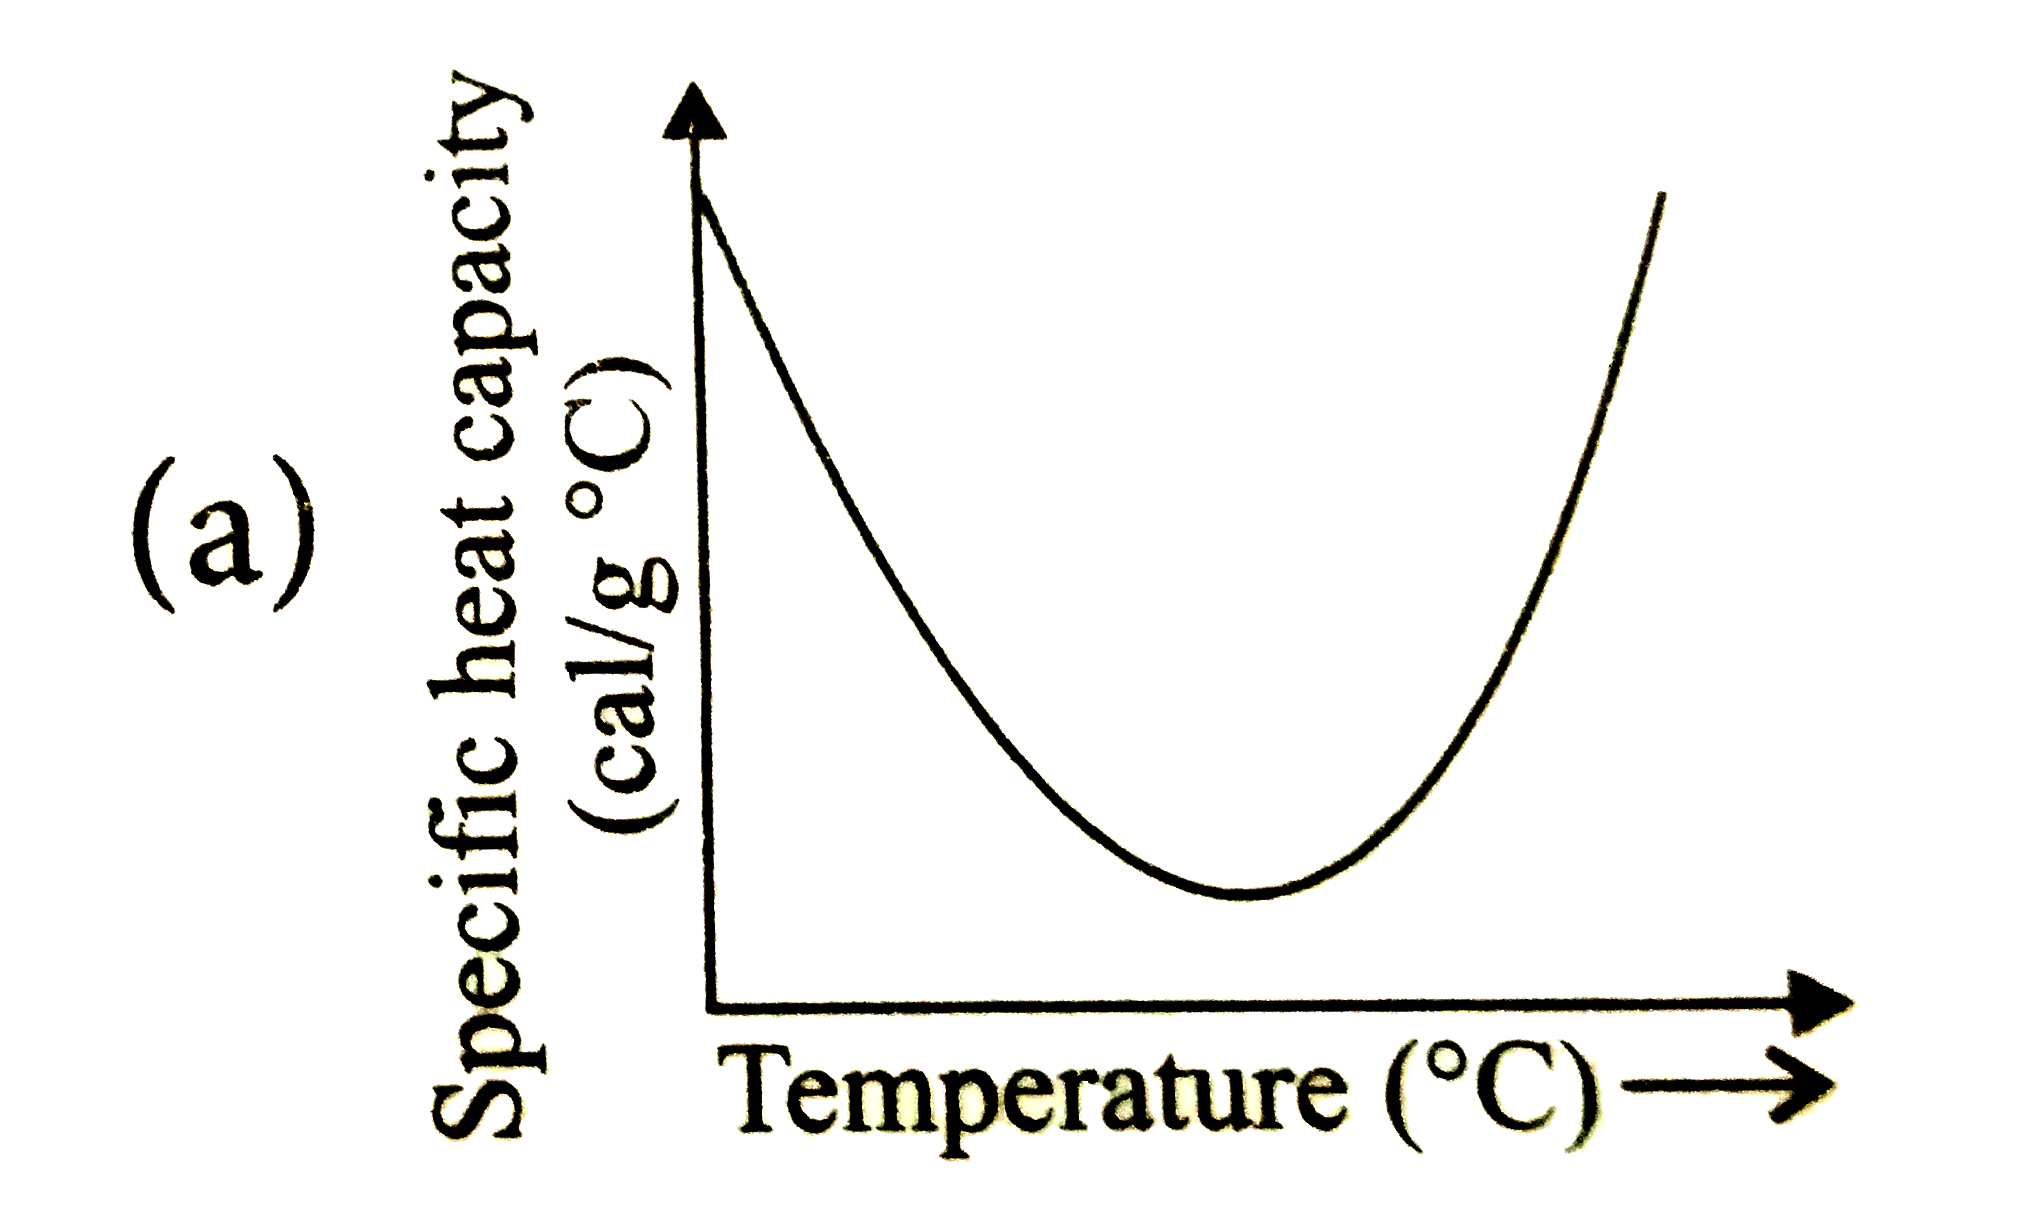 B
B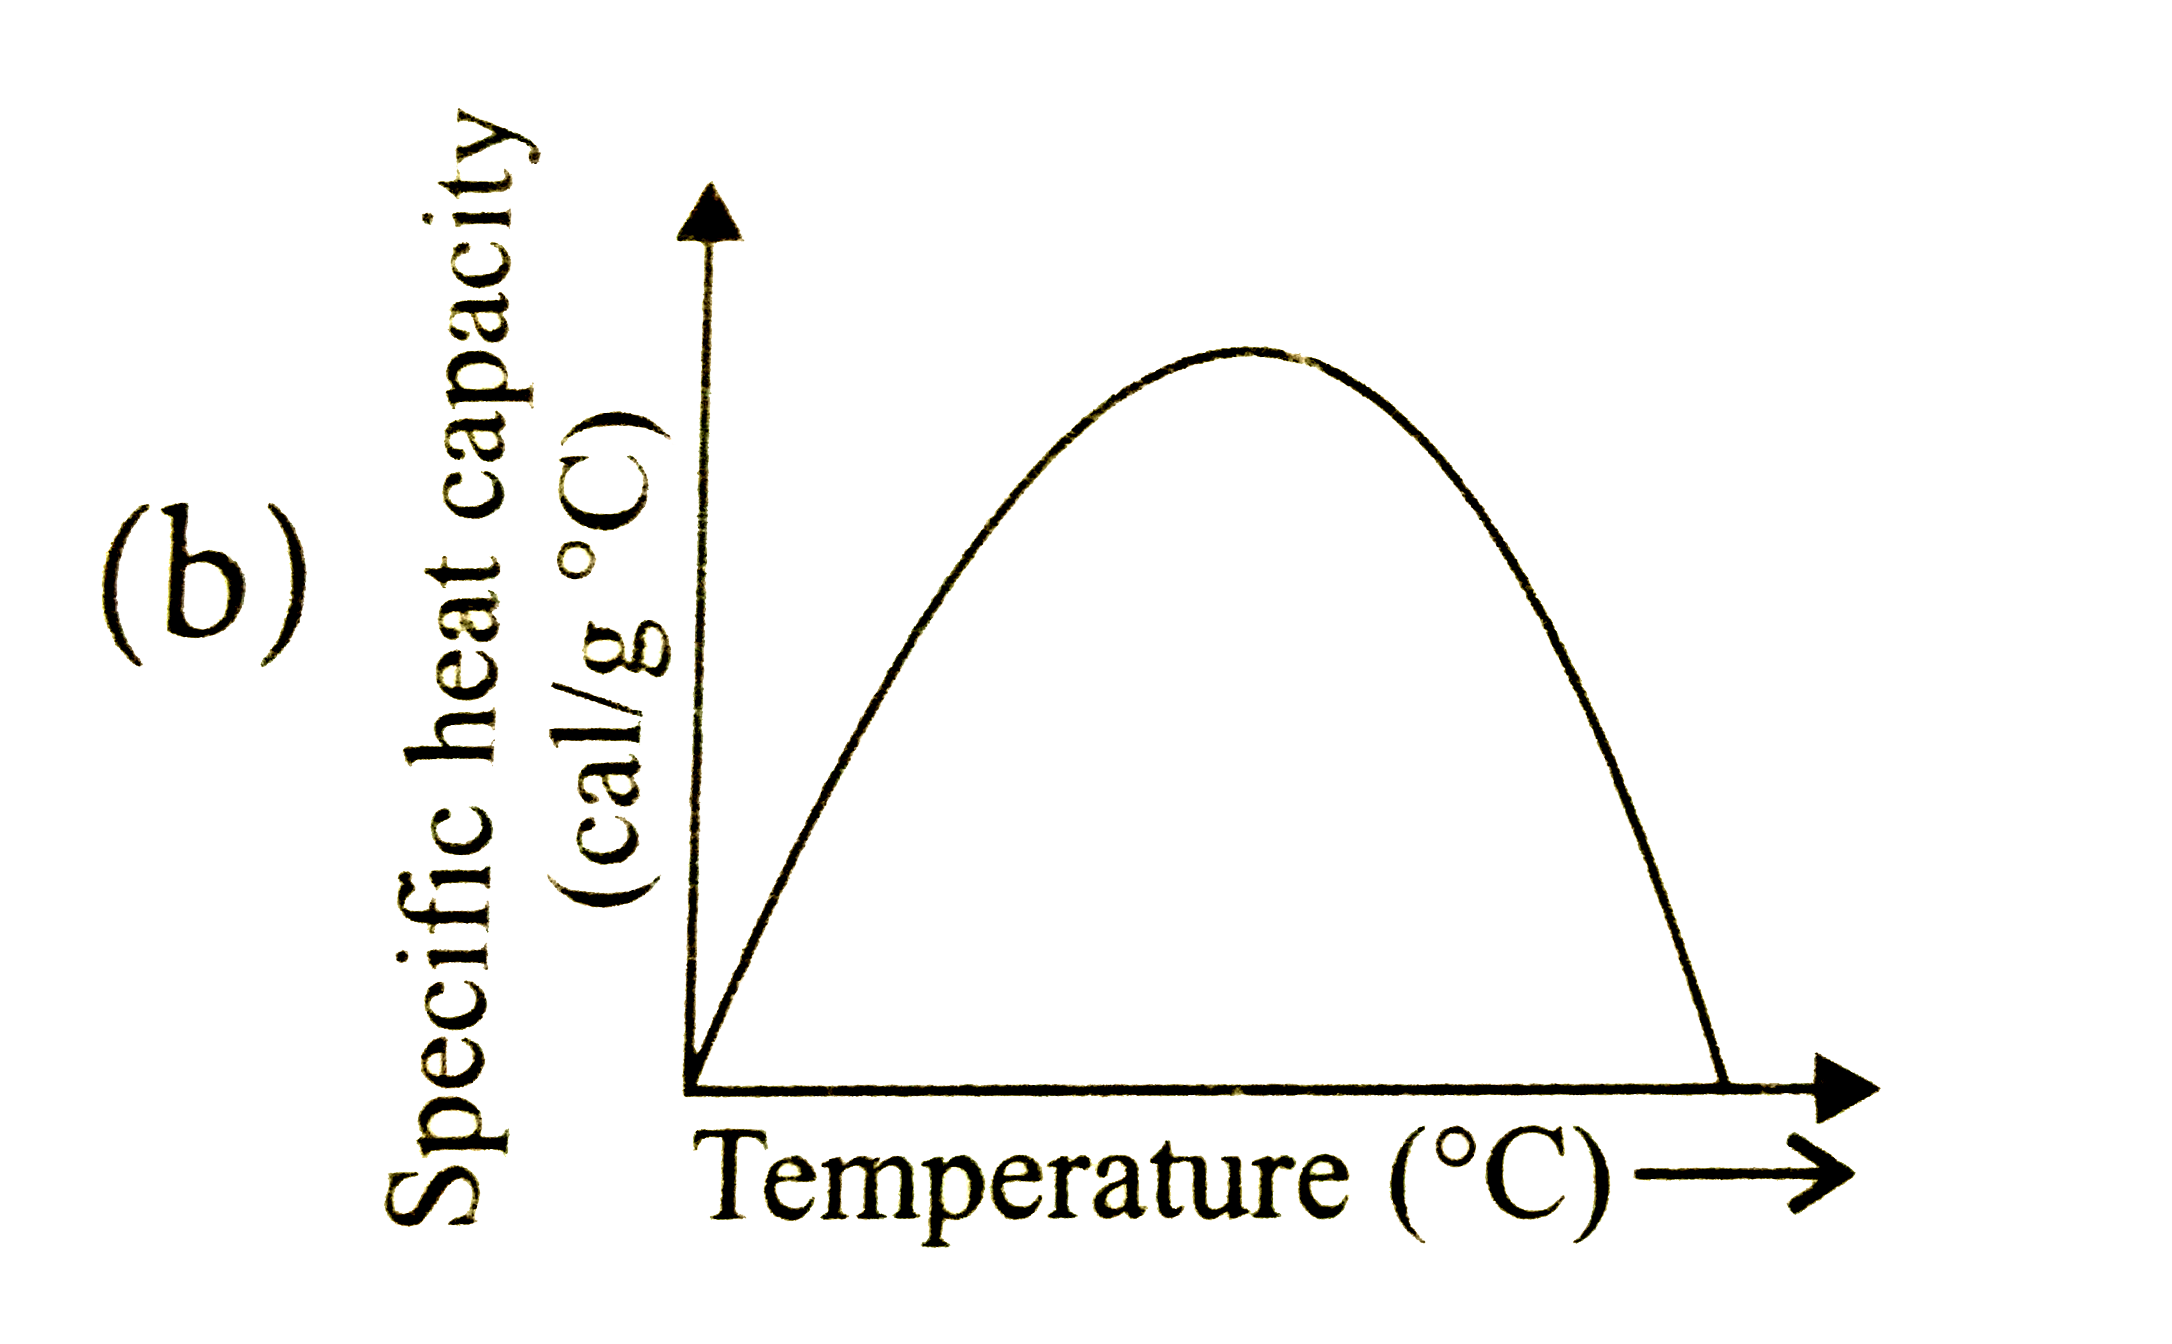 C
C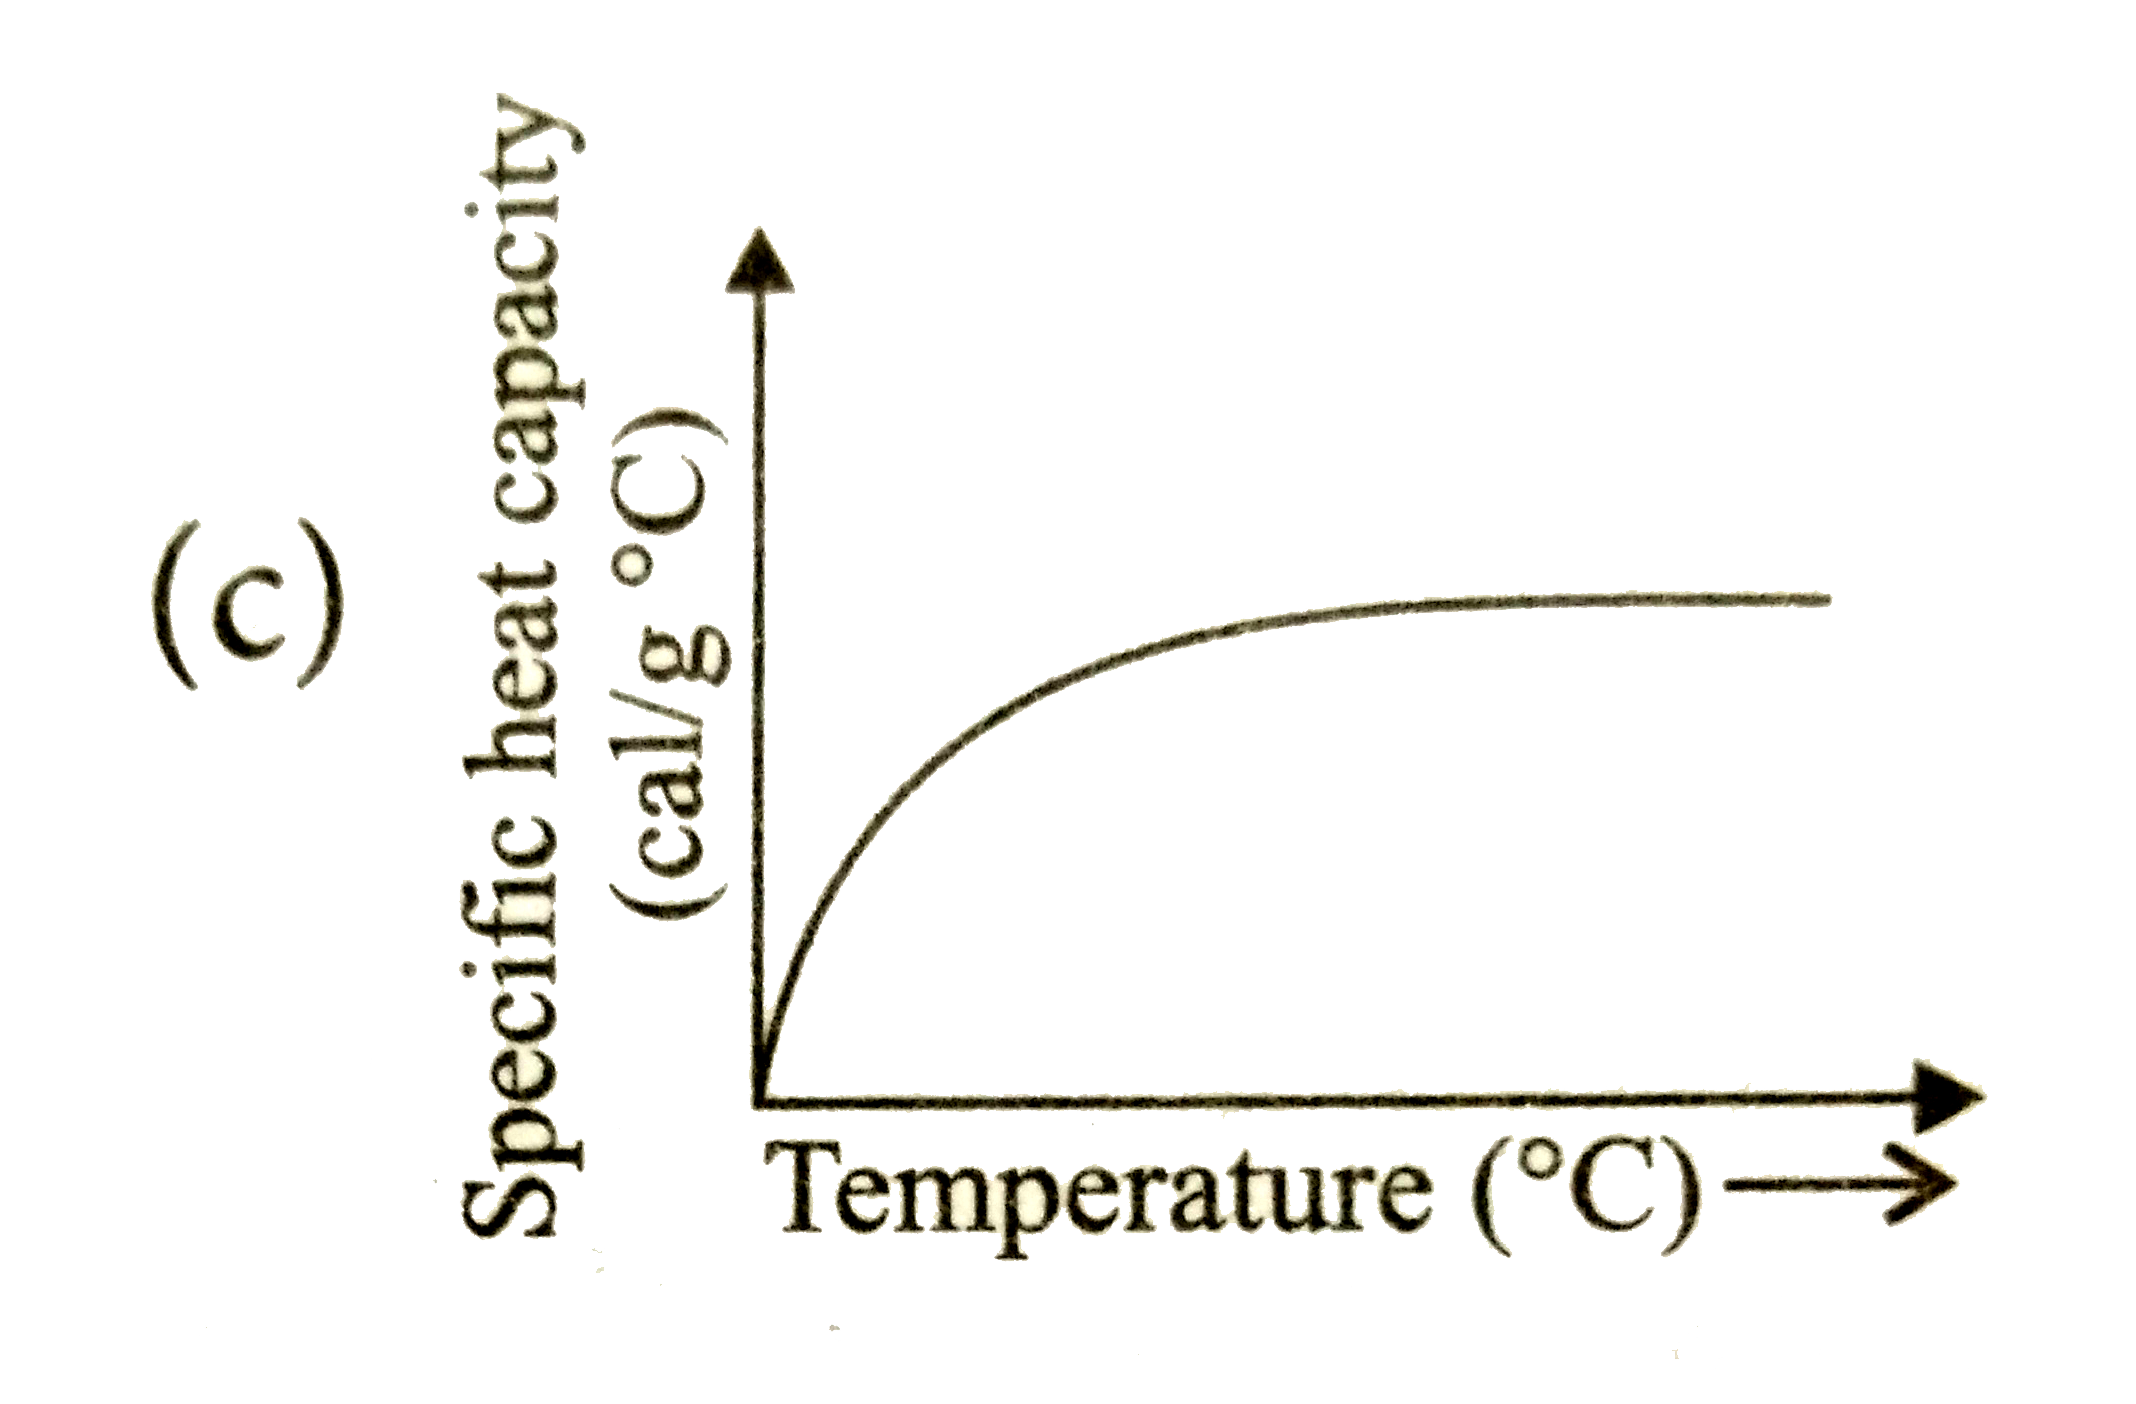 D
D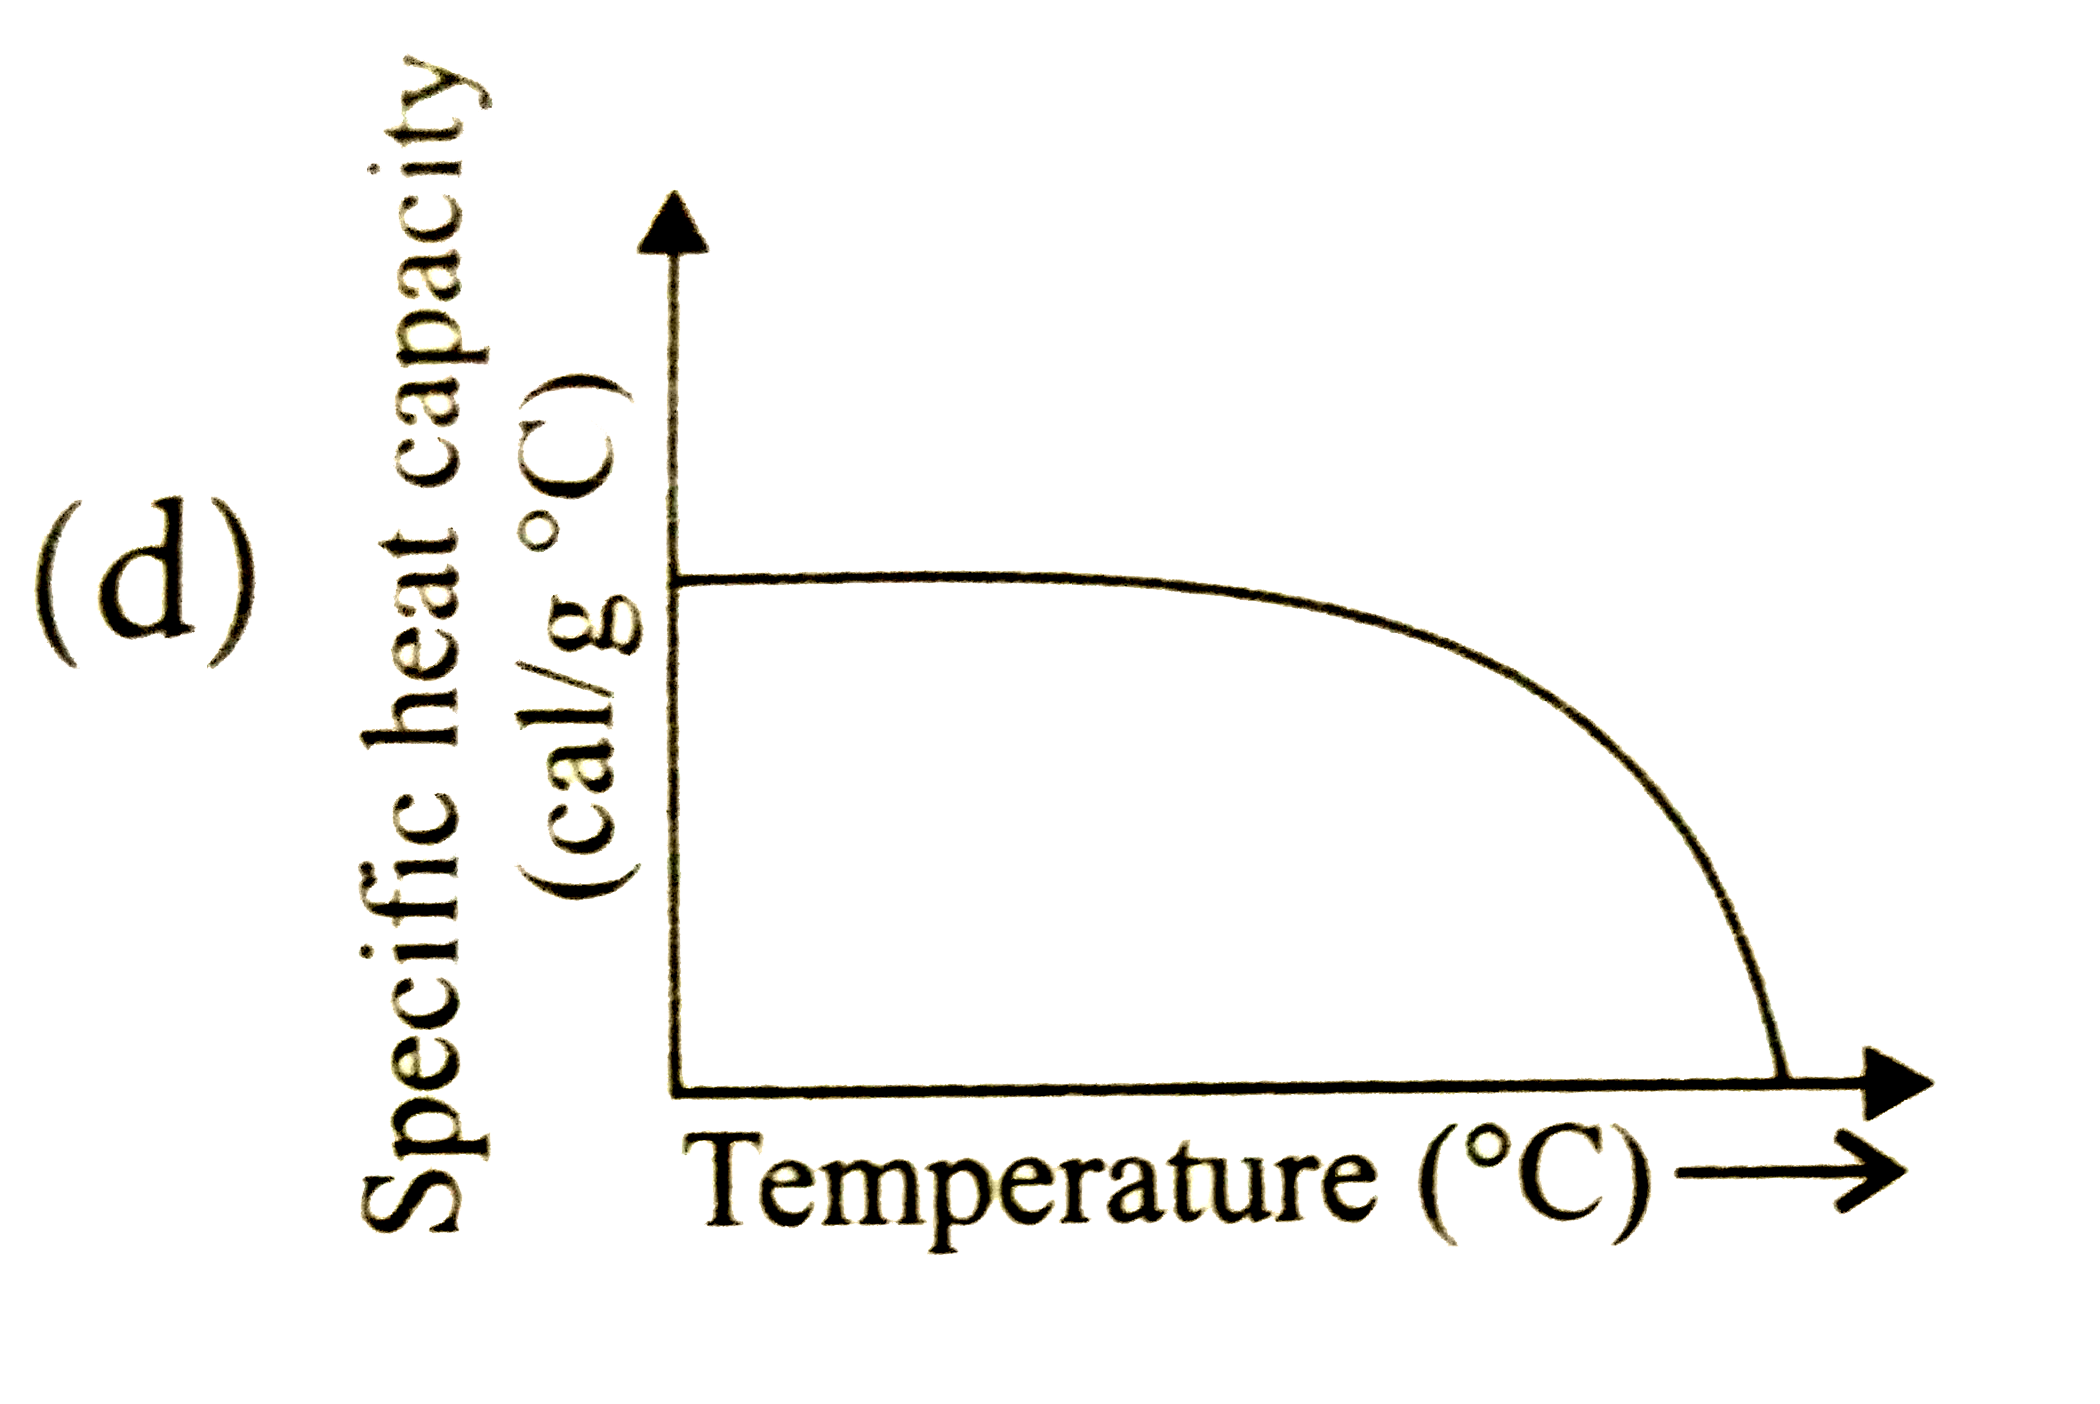
Which of the following graph represents the variation of resistivity (ρ) with temperature (T) for copper?
View Solutionwhich of the following graph represents the variation of resistivity (ρ) with temperature (T) for copper?
View SolutionWhich one of the following graphs represents variation of specific heat capacity of water with temperature?
View SolutionWhich of the following graphs represents the variation of activity (A) of a radioactive substance with time (t).
View Solutionwhich of the following graph represents the variation of resistivity (ρ) with temperature (T) for copper?
View Solution

