Given figure shows the distance-time graph of the motion of a car. It follows from the,| graph that the car is
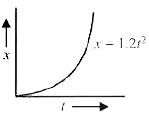
at rest
in uniform motion
in non-uniform acccleration
unifommly accelerated.
The correct Answer is:D
Since x = 1.2 t2 which is in form x=12at2 . Thus the motion is uniformly accelerated .
Topper's Solved these Questions
- KINEMATICS Book:MTG-WBJEEChapter:KINEMATICS Exercise:WB JEE WORKOUT ( CATEGORY 2 : Single Option Correct Type (2 Marks))
Explore 15 Videos
- KINEMATICS Book:MTG-WBJEEChapter:KINEMATICS Exercise:WB JEE WORKOUT ( CATEGORY 3 : One or More than One Option Correct Type (2 Marks))
Explore 10 Videos
- HEAT AND THERMAL PHYSICSBook:MTG-WBJEEChapter:HEAT AND THERMAL PHYSICSExercise:WB JEE PREVIOUS YEARS QUESTIONS
Explore 15 Videos
- KINETIC THEORY OF GASES Book:MTG-WBJEEChapter:KINETIC THEORY OF GASES Exercise:WB JEE PREVIOUS YEARS QUESTIONS (MCQ)
Explore 7 Videos
Similar Questions
Knowledge Check
Figure given shows the distance - time graph of the motion of a car. It follows from the graph that the car is
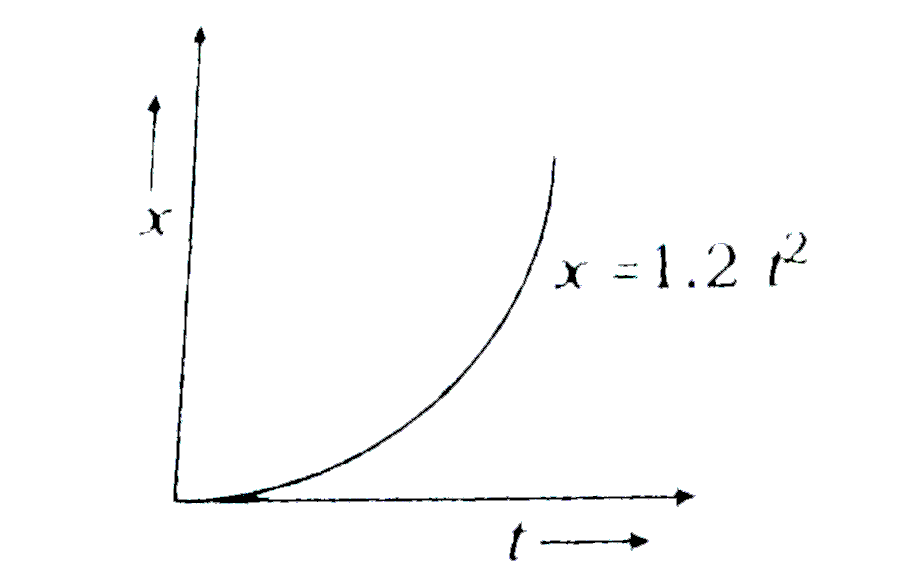 Aat restBin uniform motionCin non-uniform accelerationDuniformly accelerated
The velocity time graph of the motion of a car is given here.
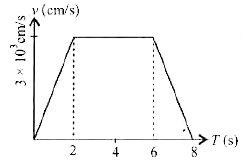 AThe distance travelled by the car in the first six seconds is 150 m.BThe deceleration of the car during the last two seconds are −15ms2.CThe distance travelled by the car in the first six second is 220 m.DThe deceleration of the car during the last two second is −20ms2
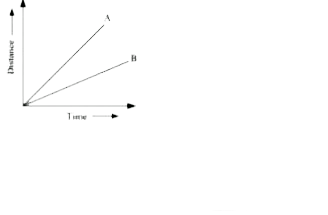
Figure shows position-time graph of two cars A and B.
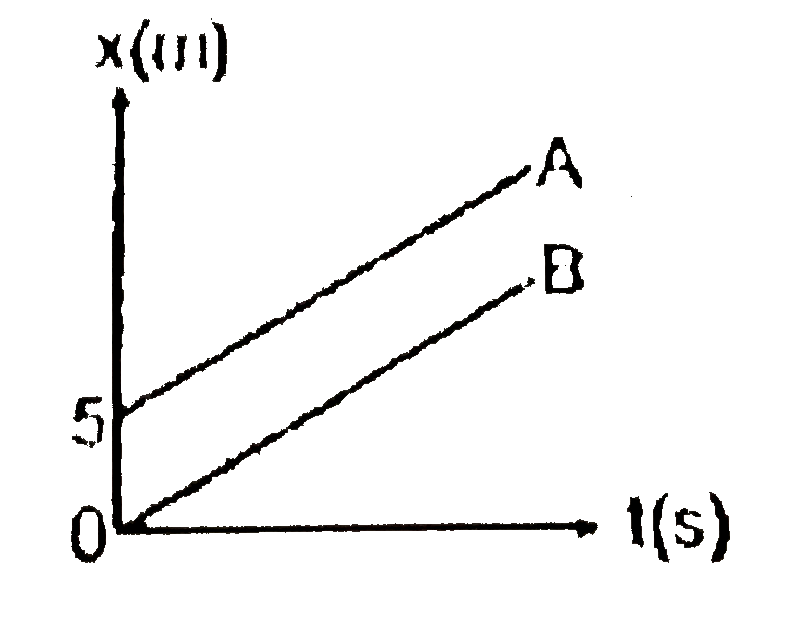 ACar A is faster than car B.BCar B is faster than car A.CBoth cars are moving with same velocity.DBoth cars have positive acceleration.
The shape of thedistance-time graph for the motion in the following case is,A car moving with a constantspeed is
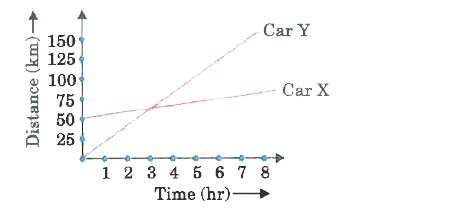
View SolutionThe figure given below shows the distance-time graph of the two cars, which began their journey together, in the same direction, from different points of start.
(i) find the speed of car X and Car Y.
(ii) When and where will car Y catch car X?
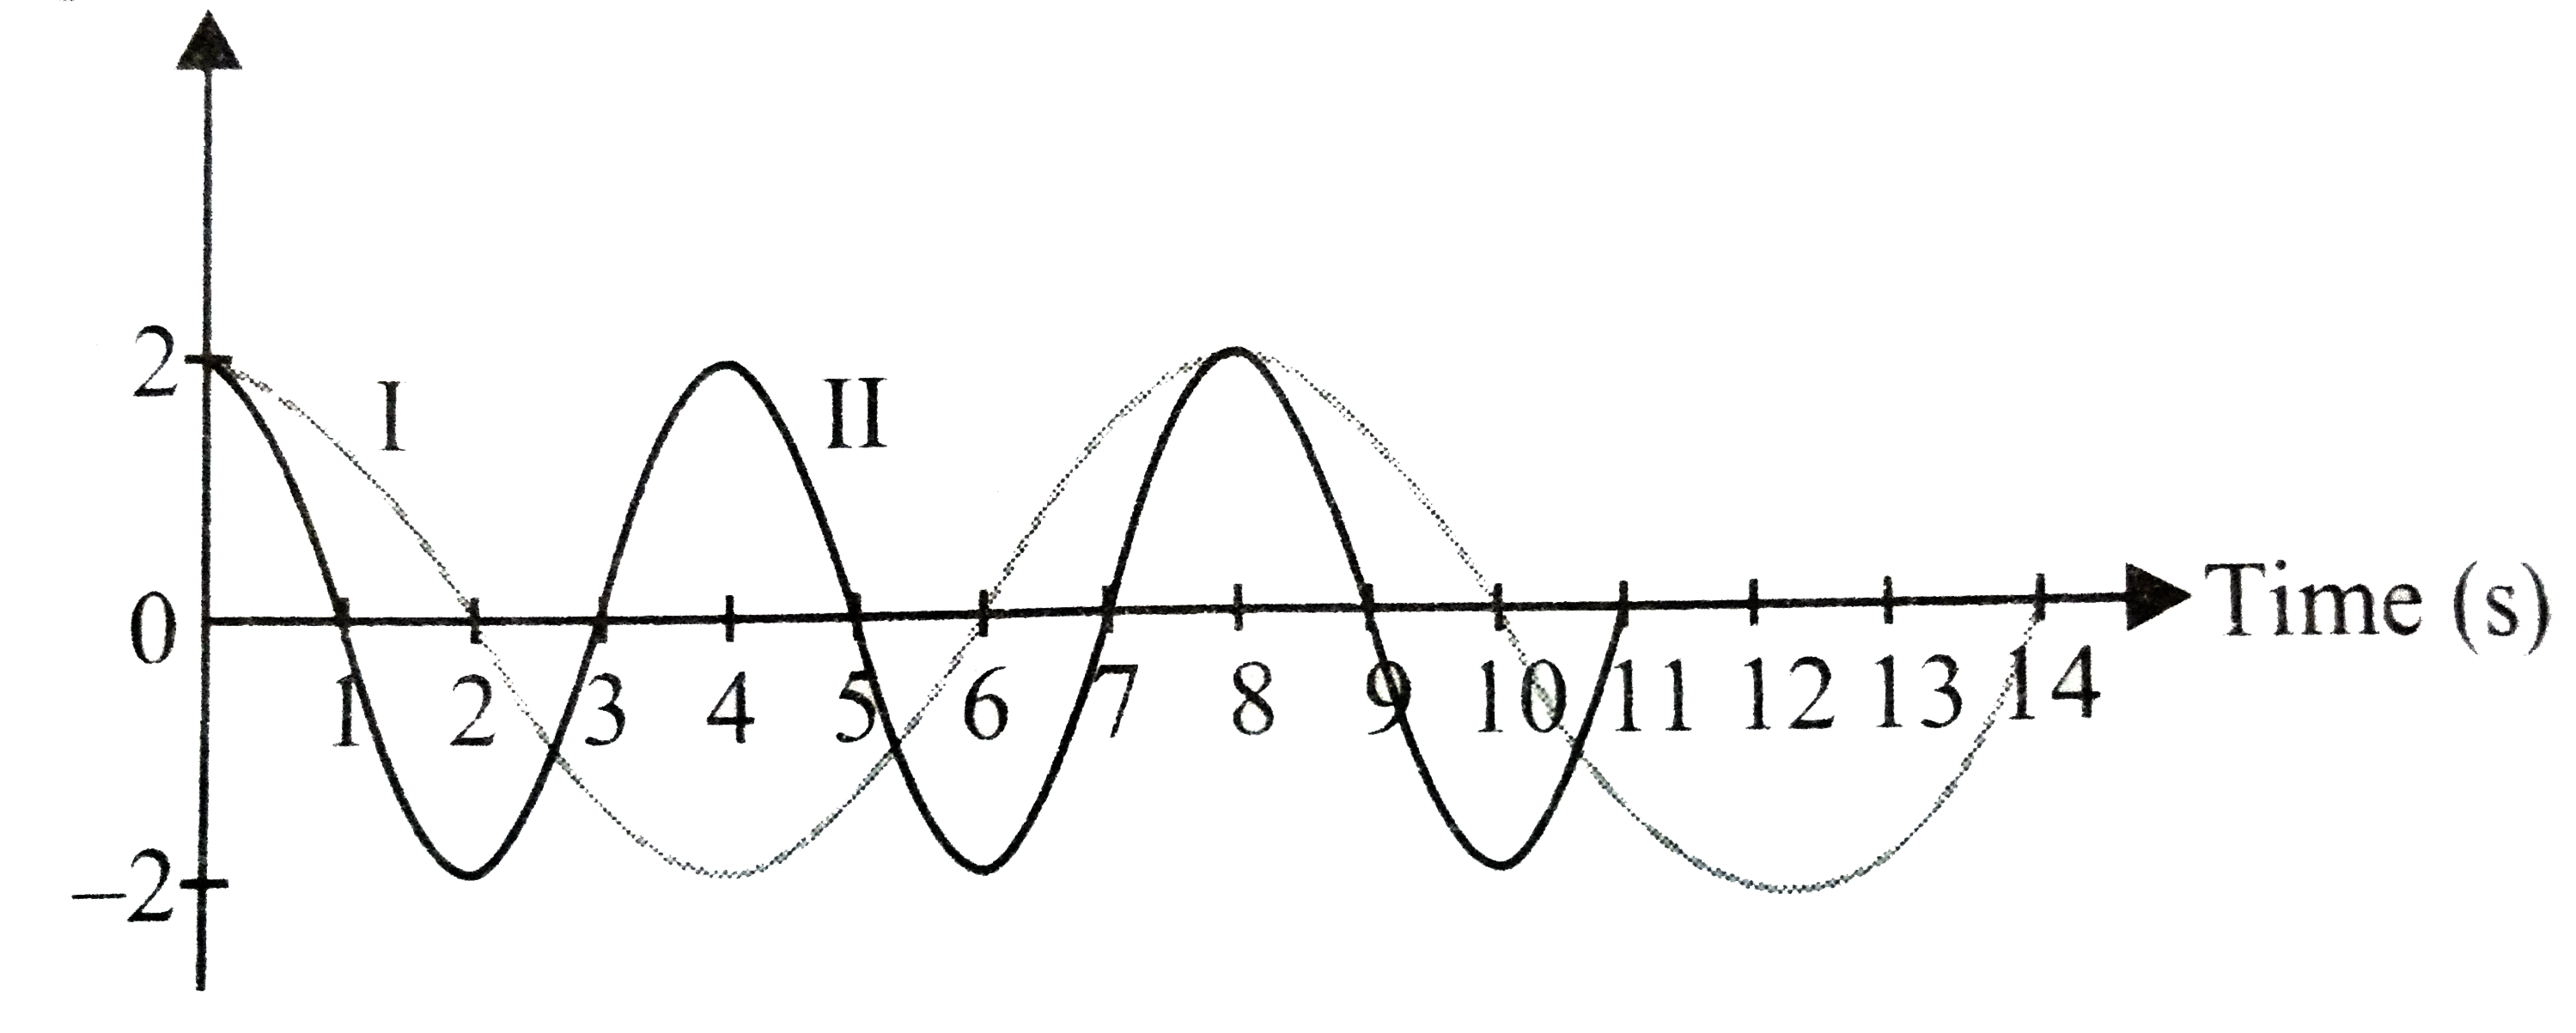
View SolutionFigure shows the displacement-time graphs of two simple harmonic motions I and II. From the graph it follows that
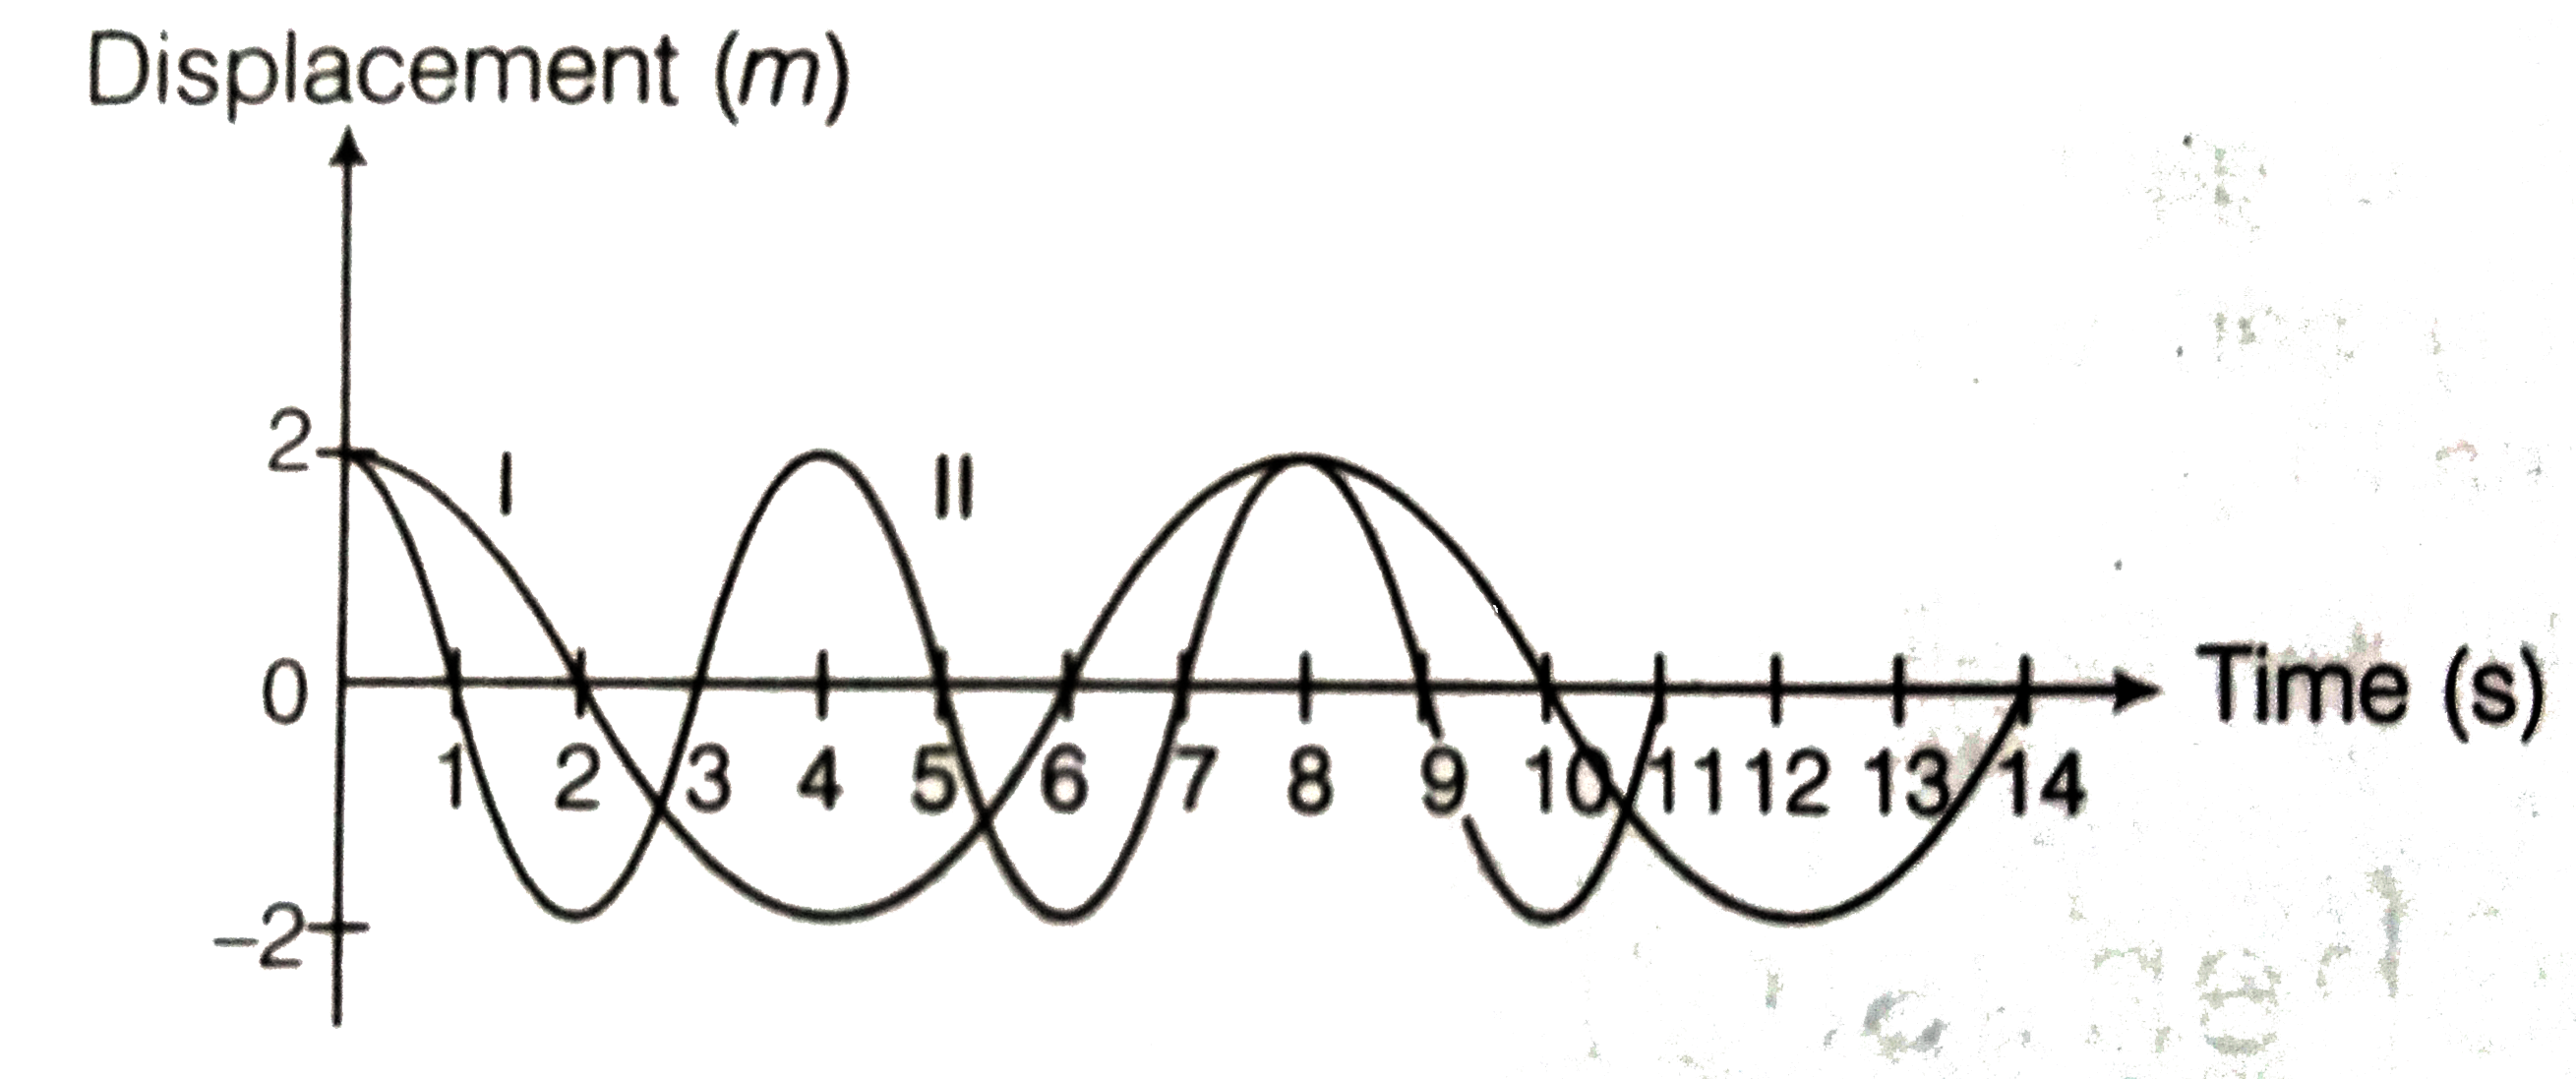
View SolutionFigure shows the displacement time graphs of two simple harmonic motions I and II. From the graph it follows that
View SolutionThe graph of distance -time graph for uniform motion for an object is
View Solution


