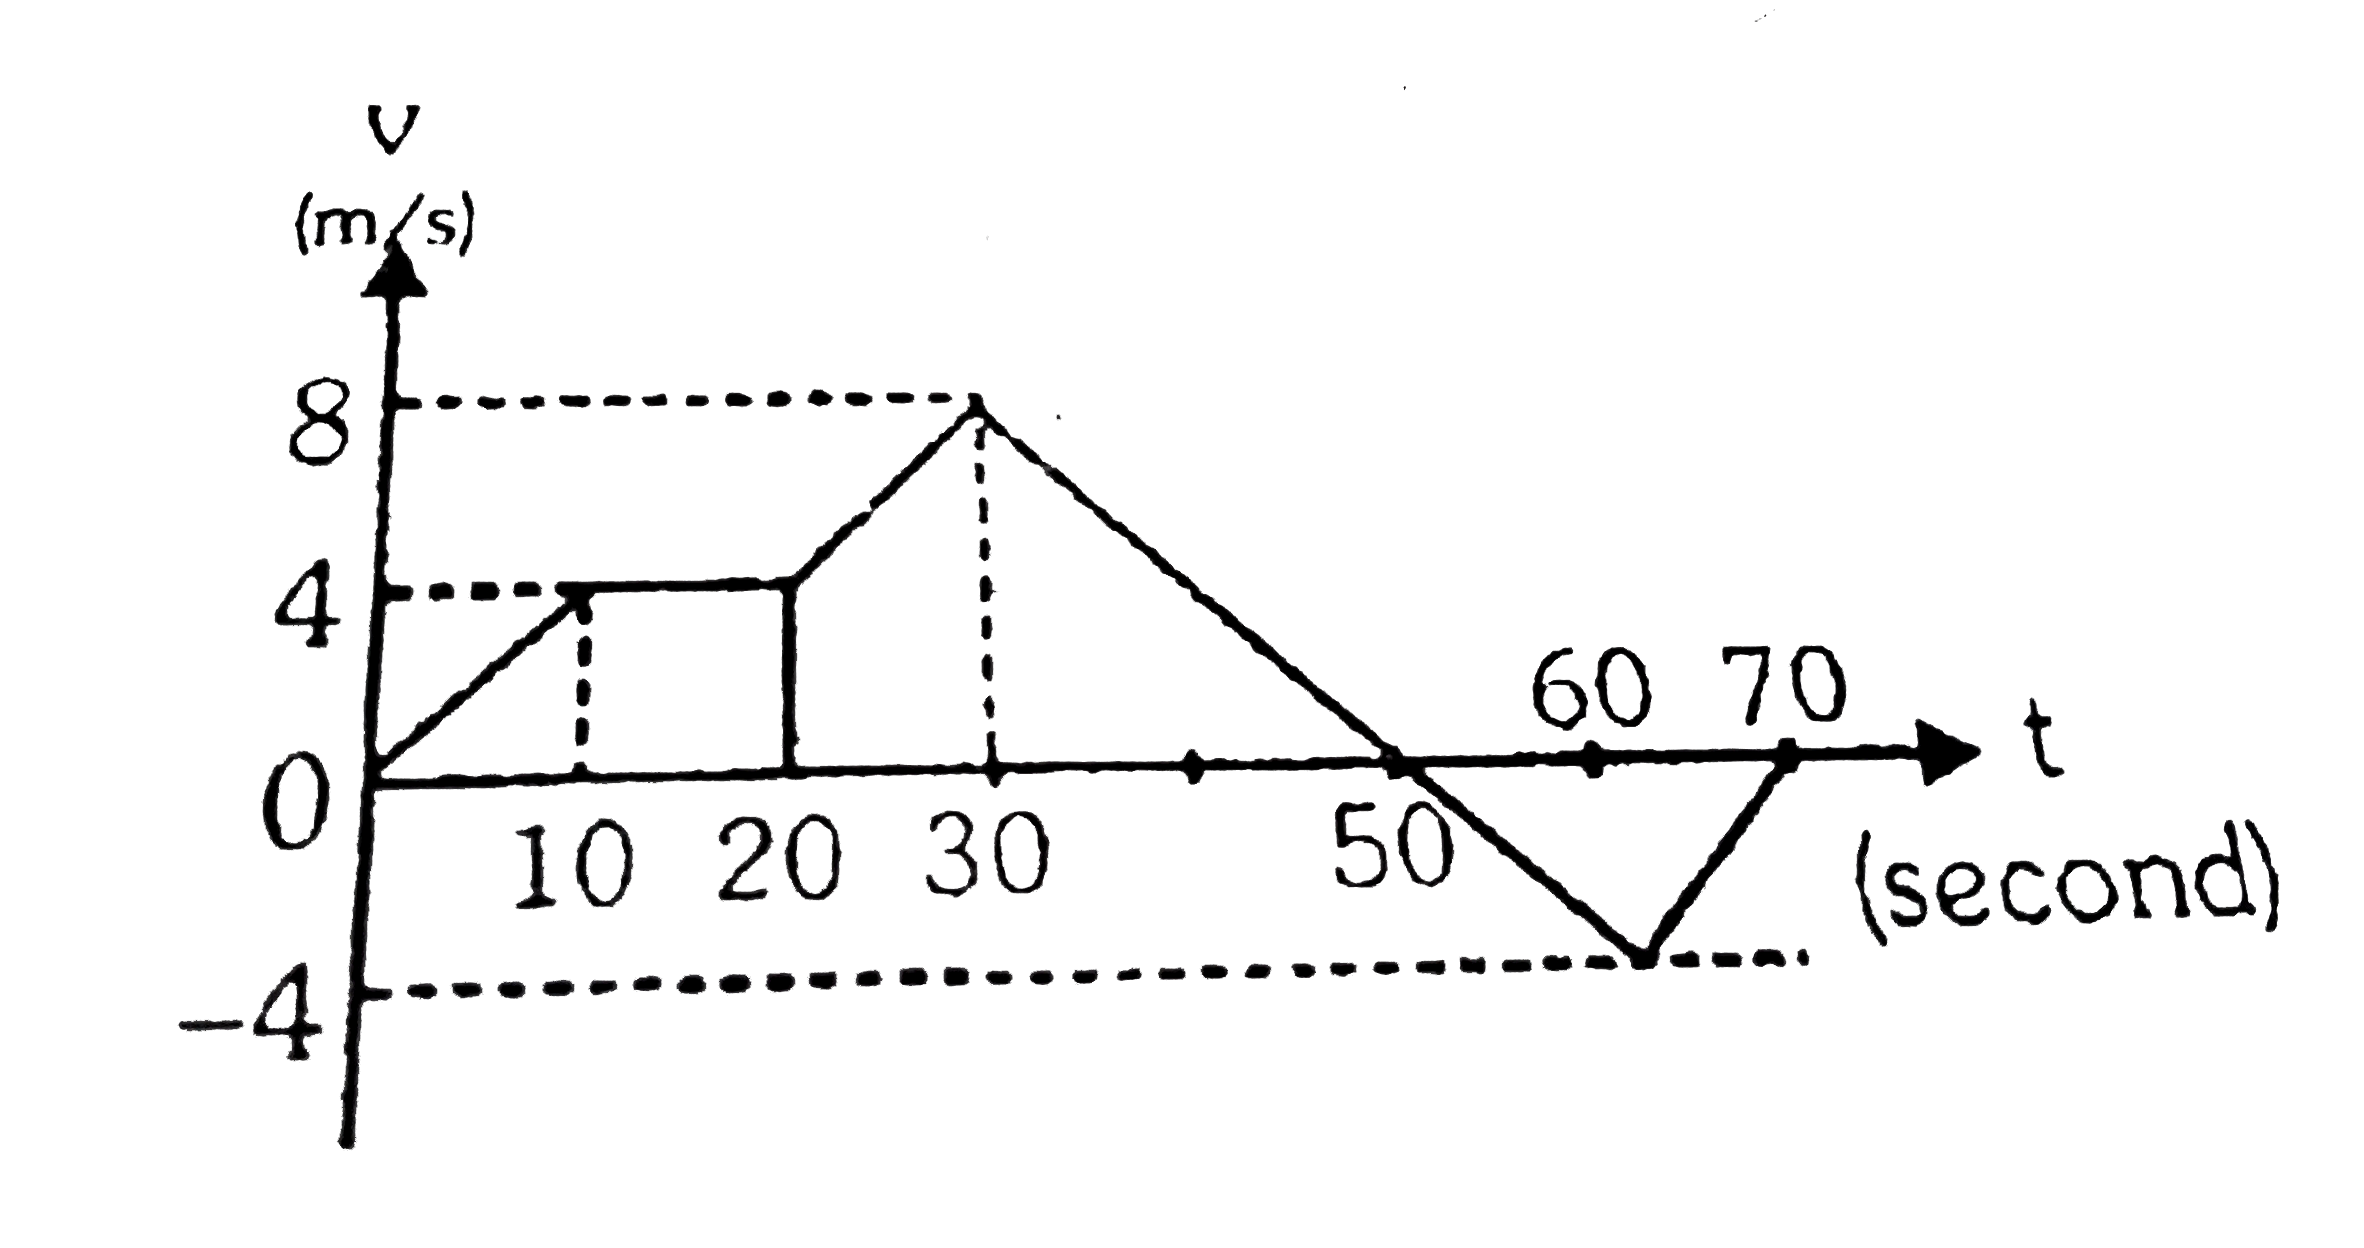
The x-t plot of a car is shown in the figure. The average velocity is zero in the time interval between 0 and t then t=_____sec.
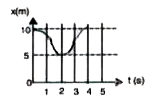
2
4
1
3
The correct Answer is:B
Similar Questions
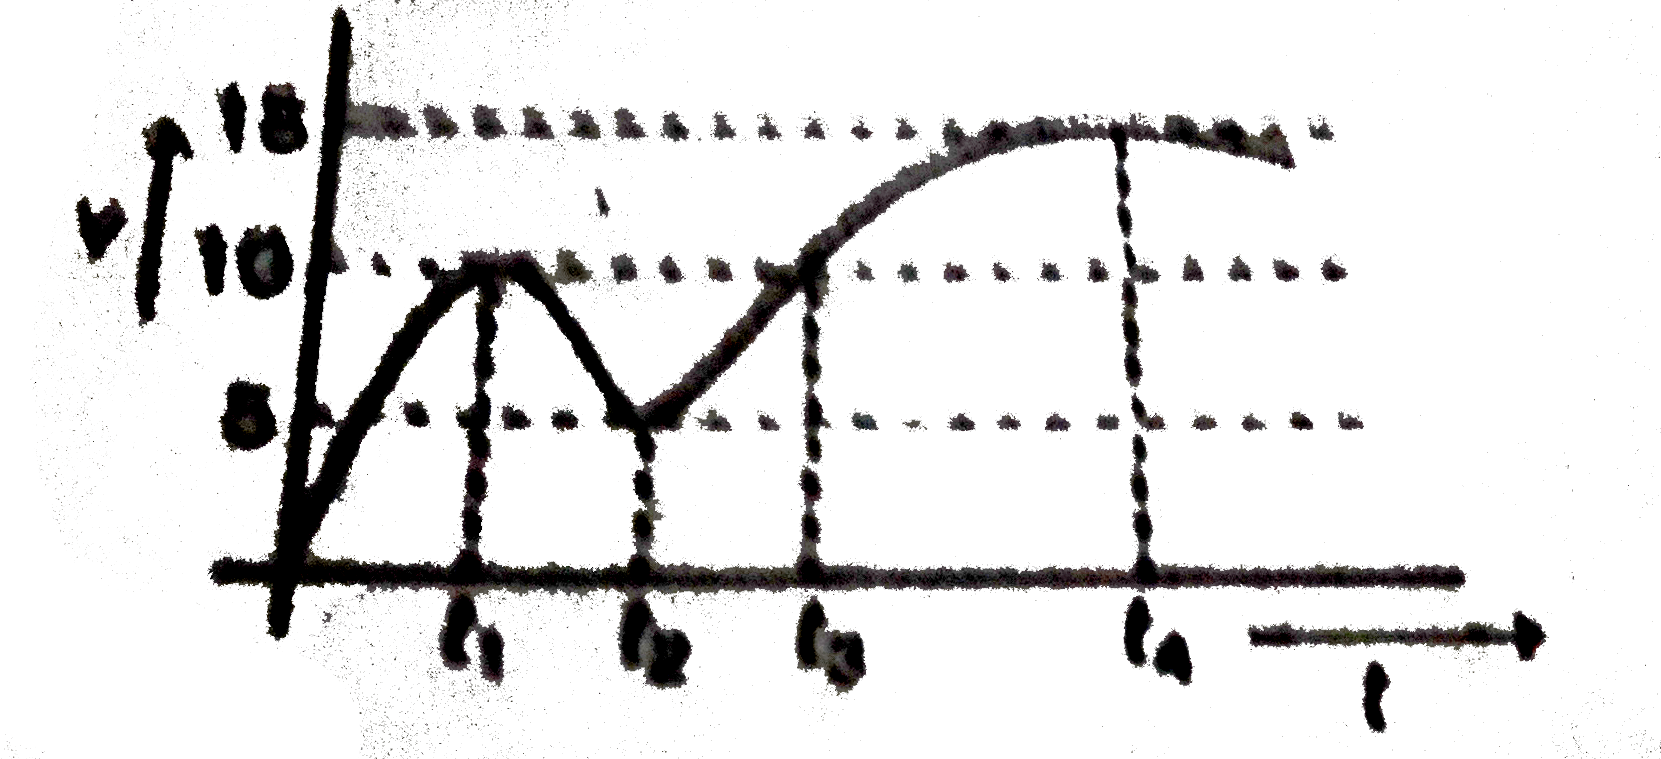
Veolocity-time graph of a particle undergoing rectilinear motioin is plotted upto t=t4 as shown in the figure. Average acceleration of the particle is zero in the time internal between
View SolutionFigure shows x-t graph of a particle. Find the Time T such that the average velocity of the particle during the period 0 to T is Zero.

View Solutionvelocity-time graph of a particle moving in a straight line is as shown in figure. At time t = 0, velocity of the particle is zero. Find (a) average acceleration in a time interval from t = 6 s to t = 12 s, (b) velocity of the particle at t = 14 s.
View SolutionAssertion : In the υ−t diagram as shown in figure, average velocity between the interval t = 0 and t=t0 is independent of t0
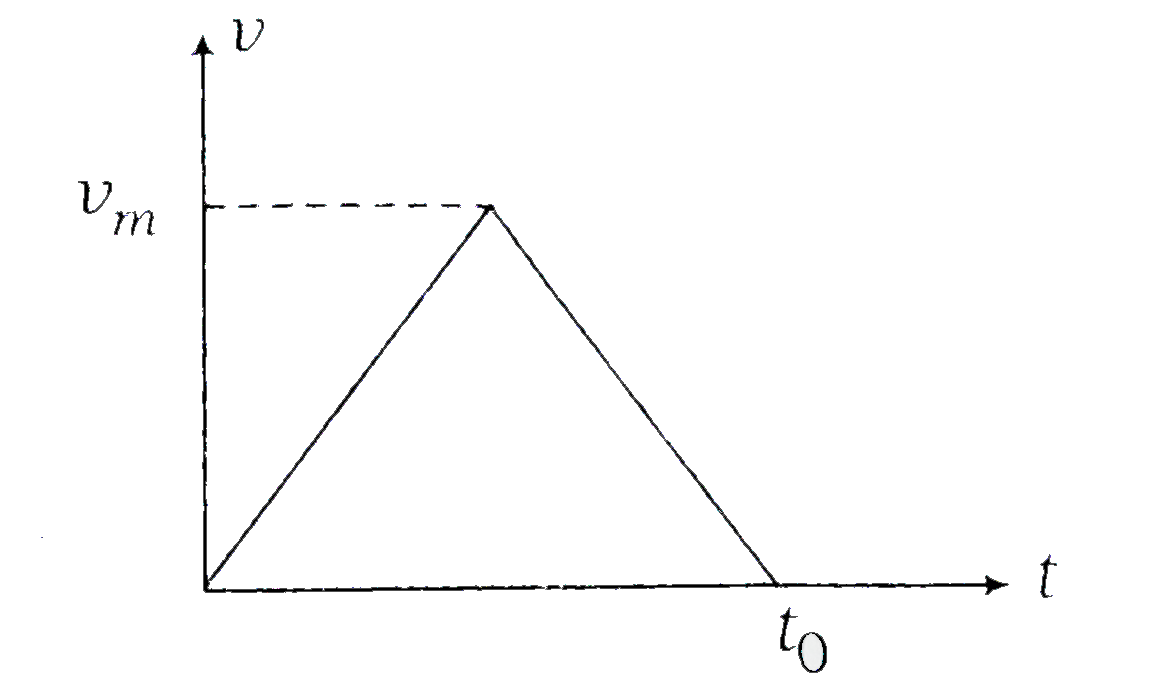
Reason : Average velocity in the given interval is 12υm.
View SolutionPosition - time graph for a particle is shown in figure. Starting from t = 0, at what time t, the average velocity is zer?
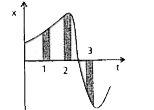
View SolutionFigure gives the x - t plot of a particle in one-dimensional motion. Three different equal intervals of time are shown. In which interval is the average speed greatest and in which is it the least ? Give the sign of average velocity for each interval.
View SolutionA car is moving on a straight road. The velocity of the car varies with time as shown in the figure. Initially (at t=0), the car was at x=0, where, x is the position of the car at any time 't'.
The displacement time graph will be best represented by :-
View Solution

