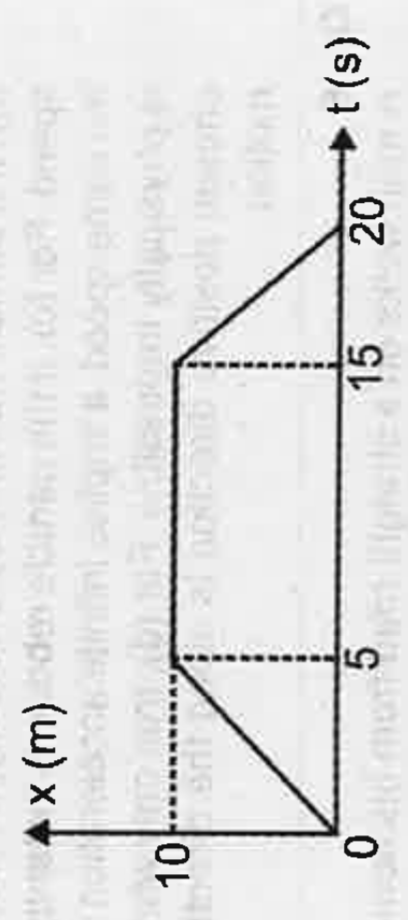
(a) The figure shows the position time graph of a body moving along a straight line.

i) Draw the velocity - time graph of the body.Solution in Malayalam
Step by step video & image solution for (a) The figure shows the position time graph of a body moving along a straight line. i) Draw the velocity - time graph of the body. by Physics experts to help you in doubts & scoring excellent marks in Class 11 exams.
Updated on:21/07/2023Similar Questions
The velocity versus time graph of a body moving along a straight line is as shown in figure. The ratio of displacement and distance covered body in 5 second is :-
View SolutionThe velocity time graph of a body moving along a straight line is shown in Fig. The acceleration of the body during OA will be:
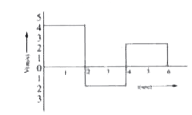
View SolutionThe velocity time graph of a body moving in a straight line is shown in the figure. The displacement and distance travelled by the body in 6 sec are respectively.

View SolutionThe figure shows the position time graph of a body moving along a straight line. ii) From the graph, find the displacement in 20 seconds.
View SolutionA body in motion along a straight line. From position time graph Calculate it's Time of rest of the body
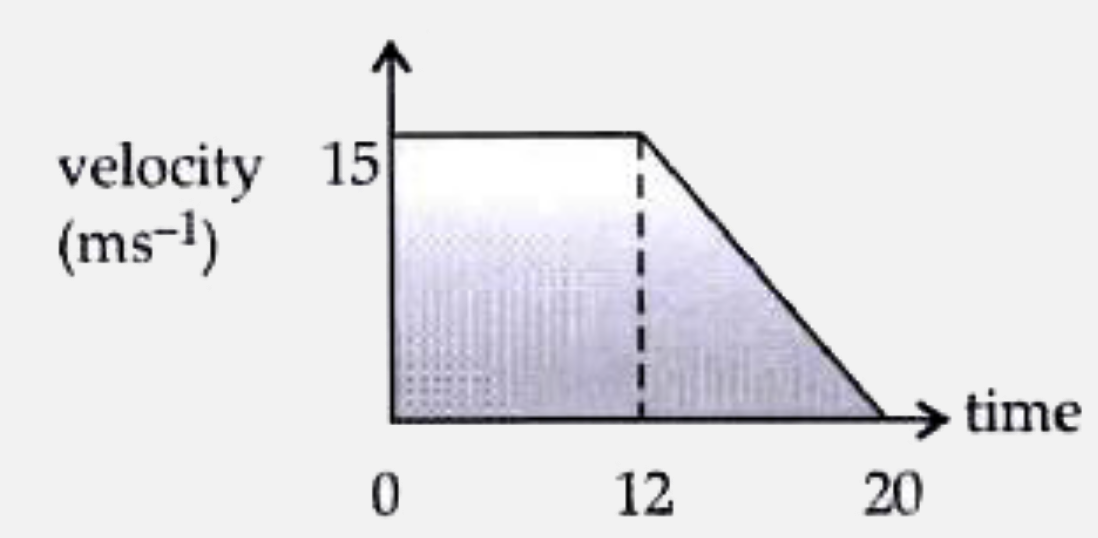
View SolutionThe figure below shows the velocity-time graph of a body moving in a straight line. Find the time interval in which the body is moving with zero acceleration
View SolutionThe figure below shows the velocity-time graph of a body moving in a straight line.

Find the total displacement of the body.
View Solution

