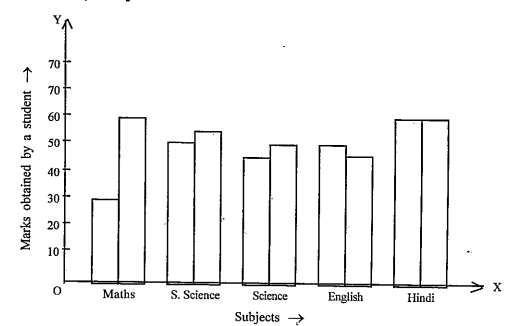
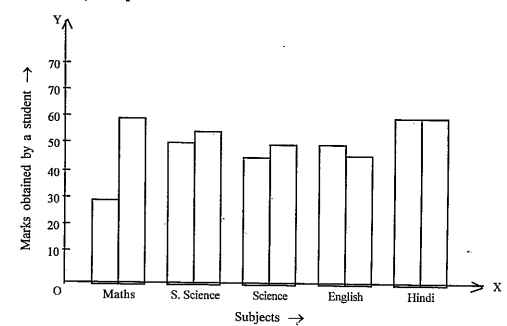
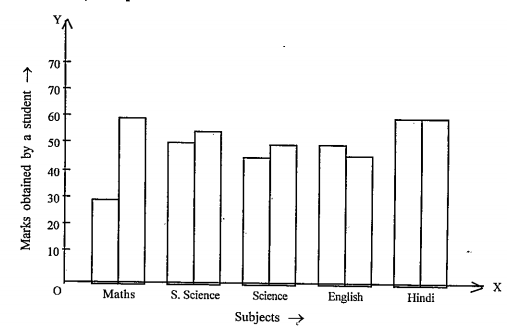
Double Bar Graph : A bar graph showing two sets of data simultaneously. It useful for the comparison of the data.

In which subject is the performance at par?Solution in Assamese
Step by step video & image solution for Double Bar Graph : A bar graph showing two sets of data simultaneously. It useful for the comparison of the data. In which subject is the performance at par? by Maths experts to help you in doubts & scoring excellent marks in Class 8 exams.
Updated on:21/07/2023Similar Questions
Which inequations represent the shaded region in the given figure
View SolutionIn the given figure, PQRS is a parallelogram. A and B are the mid-point of ¯¯¯¯¯¯PQ and ¯¯¯¯¯SR respectively. If PS=BR, then the quadrilateral ADBC is a…………………… ,
ltimg src="https://d10lpgp6xz60nq.cloudfront.net/physics_images/PS_MATH_IX_C12_E05_020_Q01.png" width="80%"gt
View SolutionWhich of the following statement is not correc for following straight line graph :-
ltimg src="https://d10lpgp6xz60nq.cloudfront.net/physics_images/ALN_PHY_R04_E01_015_Q01.png" width="80%"gt
View SolutionDouble Bar Graph : A bar graph showing two sets of data simultaneously. It useful for the comparison of the data.

What is the information given by the double bar graph?
View SolutionDouble Bar Graph : A bar graph showing two sets of data simultaneously. It useful for the comparison of the data.

In which subject has the performance improved the most?
View SolutionDouble bar graph : Bar graph showing two groups of data together In which subject has the performance declined?
View SolutionDouble bar graph : Bar graph showing two groups of data together In which subjects has the performance remained the same?
View SolutionWhich of the following statement is not correct for following straight line graph :-
ltimg src="https://d10lpgp6xz60nq.cloudfront.net/physics_images/ALN_PHY_R04_E01_015_Q01.png" width="80%"gt
View Solution
