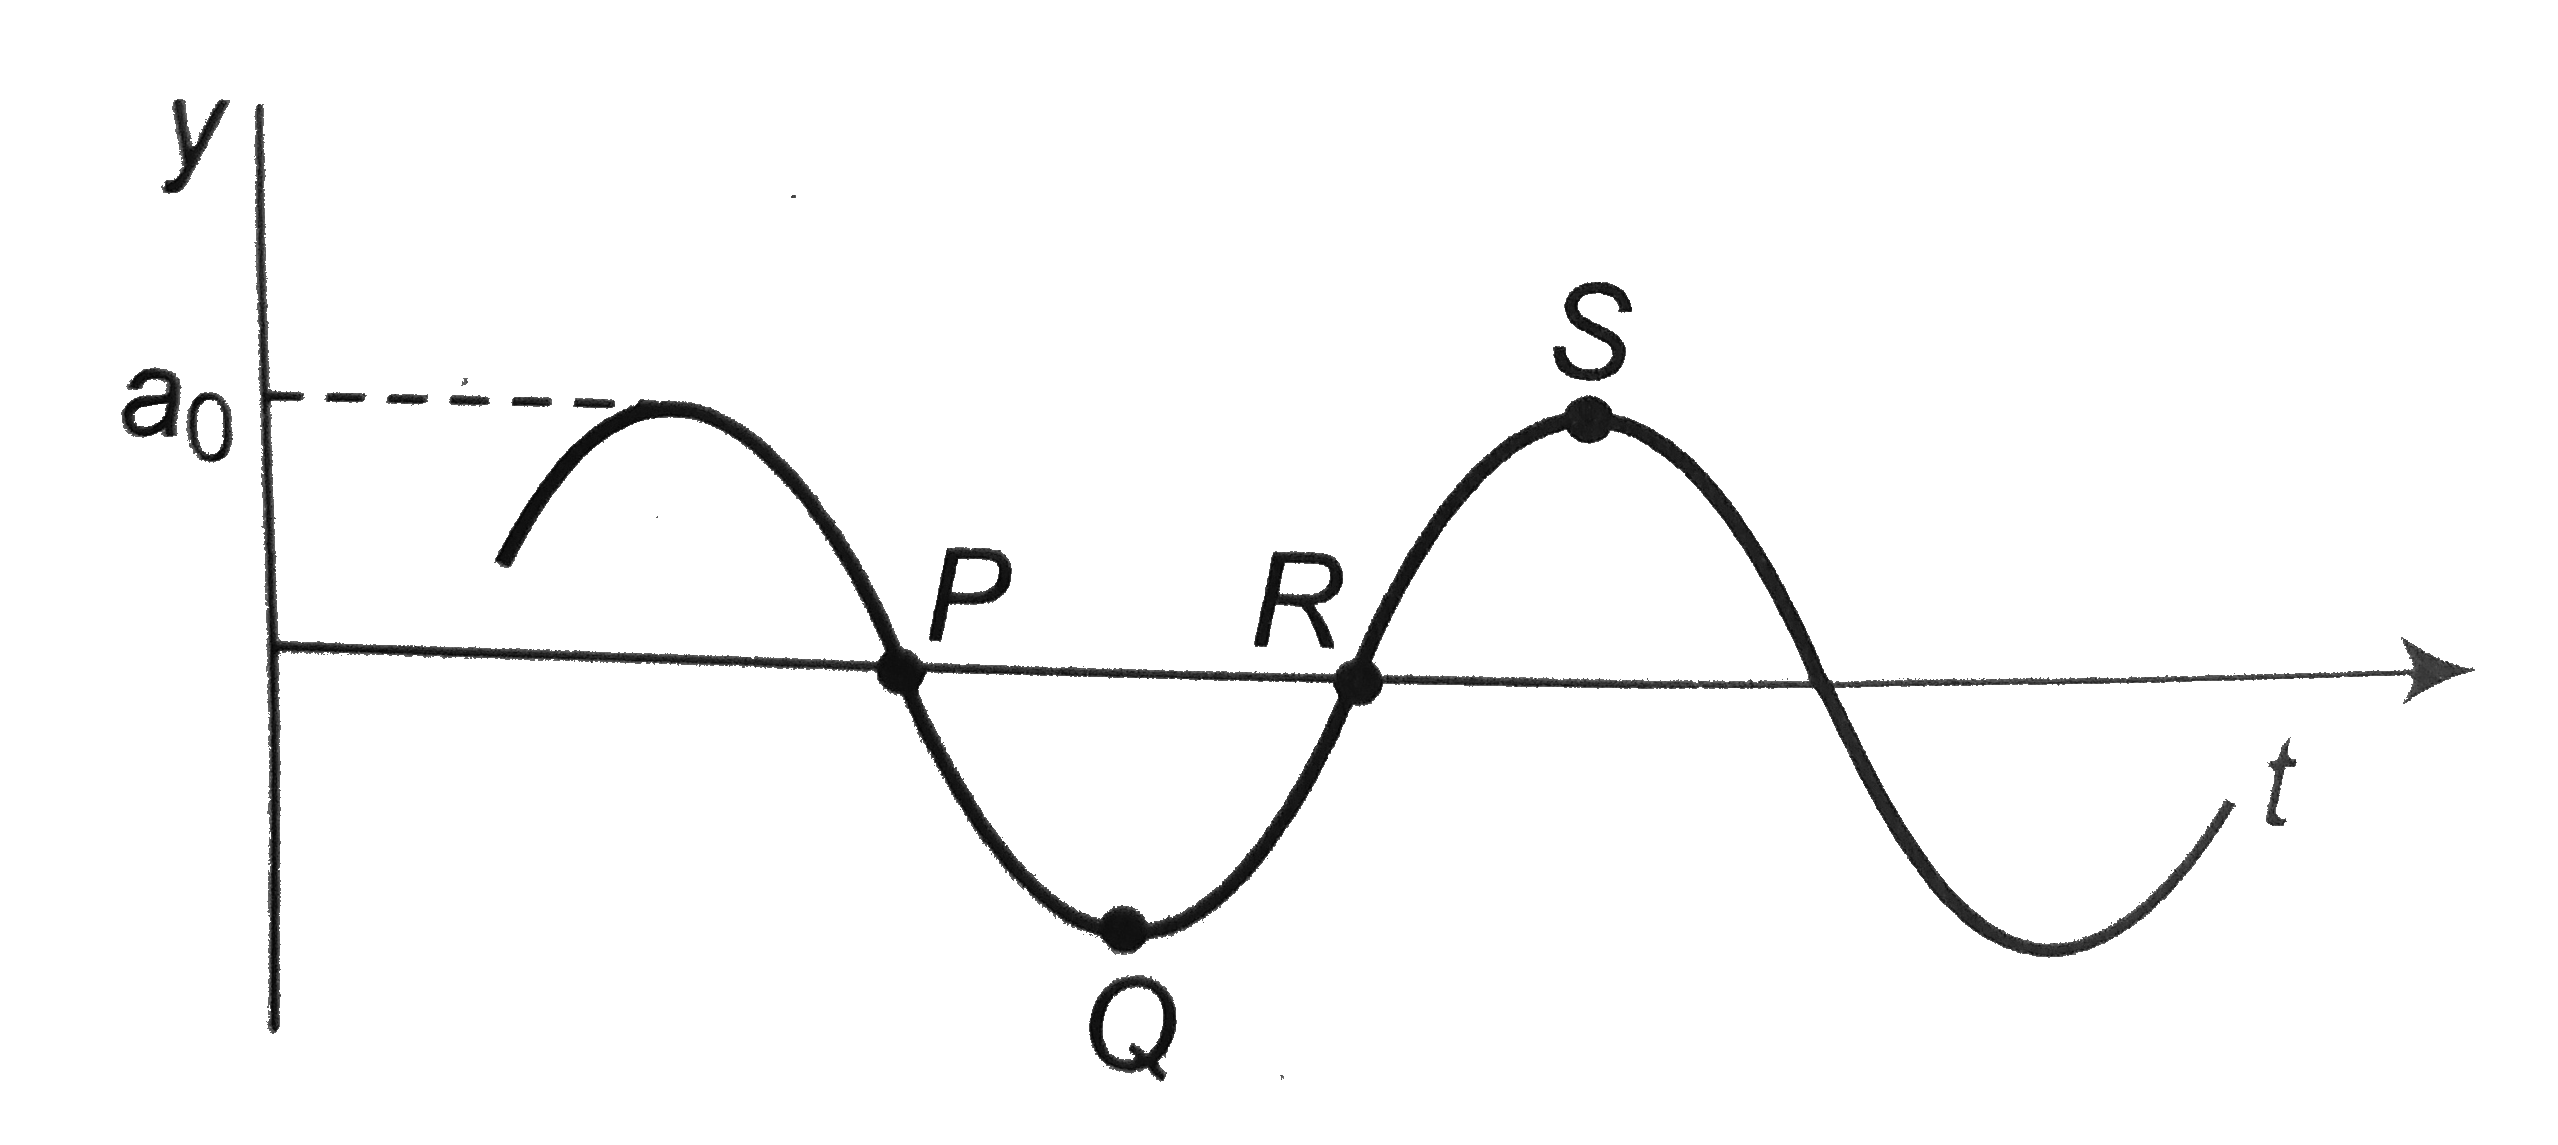
A wave motion has the function y=a0sin(ωt−kx). The graph in figure shows how the displacement y at a fixed point varies with time t. Which one of the labelled points Shows a displacement equal to that at the position x=π2k at time t=0?Solution in Marathi
P
Q
R
S
The correct Answer is:B
Step by step video & image solution for A wave motion has the function y=a_0sin(omegat-kx). The graph in figure shows how the displacement y at a fixed point varies with time t. Which one of the labelled points Shows a displacement equal to that at the position x=(pi)/(2k) at time t=0? by Physics experts to help you in doubts & scoring excellent marks in Class 12 exams.
Updated on:21/07/2023Similar Questions
For a diagonal architectural wave in a tense wire, a point of vibration is formed at the point x = 0 and the next point of vibration is formed x = 0.10 m In position. The displacement (y) -time (t) graph of the particle at x = 0 is shown:
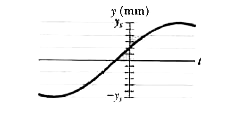
View SolutionFigure 16-54 shows the displacement y versus time t of the point on a string at x=0, as a wave passes through that point. The scale of the y axis is set by ys=6.0mm. The wave has form y(x,t)=ylnsin(kx−ωt+ϕ). What is the ϕ?

View SolutionThe displacement of a string carrying a travelling sinusoidal wave is given by y(x,t) =y_m sin(kx-omegat-phi) At time t=0 the point at x=0 has a velocity of 0 and a positive displacement. The phase constant phi is
View Solutionएक तरंग गति का फलन y=a0sin(ωt−kx) है। चित्र में, प्रदर्शित ग्राफ एक नियत बिन्दु से विस्थापन y और समय के सम्बन्ध को व्यक्त करता है। प्रदर्शित बिन्दुओं में से कौन-से बिन्दु का विस्थापन t = 0 पर स्थिति x=π2k के तुल्य होगा?

View Solutionएक समतल प्रगामी तरंग का समीकरण y=0.1sin(200πt−20πx17) है। यही y मीटर में विस्थापन, t सैकण्ड में समय एंव x मीटर में मूल बिंदु से विस्थापन है। तरंग की आवृत्ति तरंगदैर्घ्य एंव चाल कमशः होगी
View SolutionThe displacement x of a particle with a function of time t is shown in the figure. The graph shows that
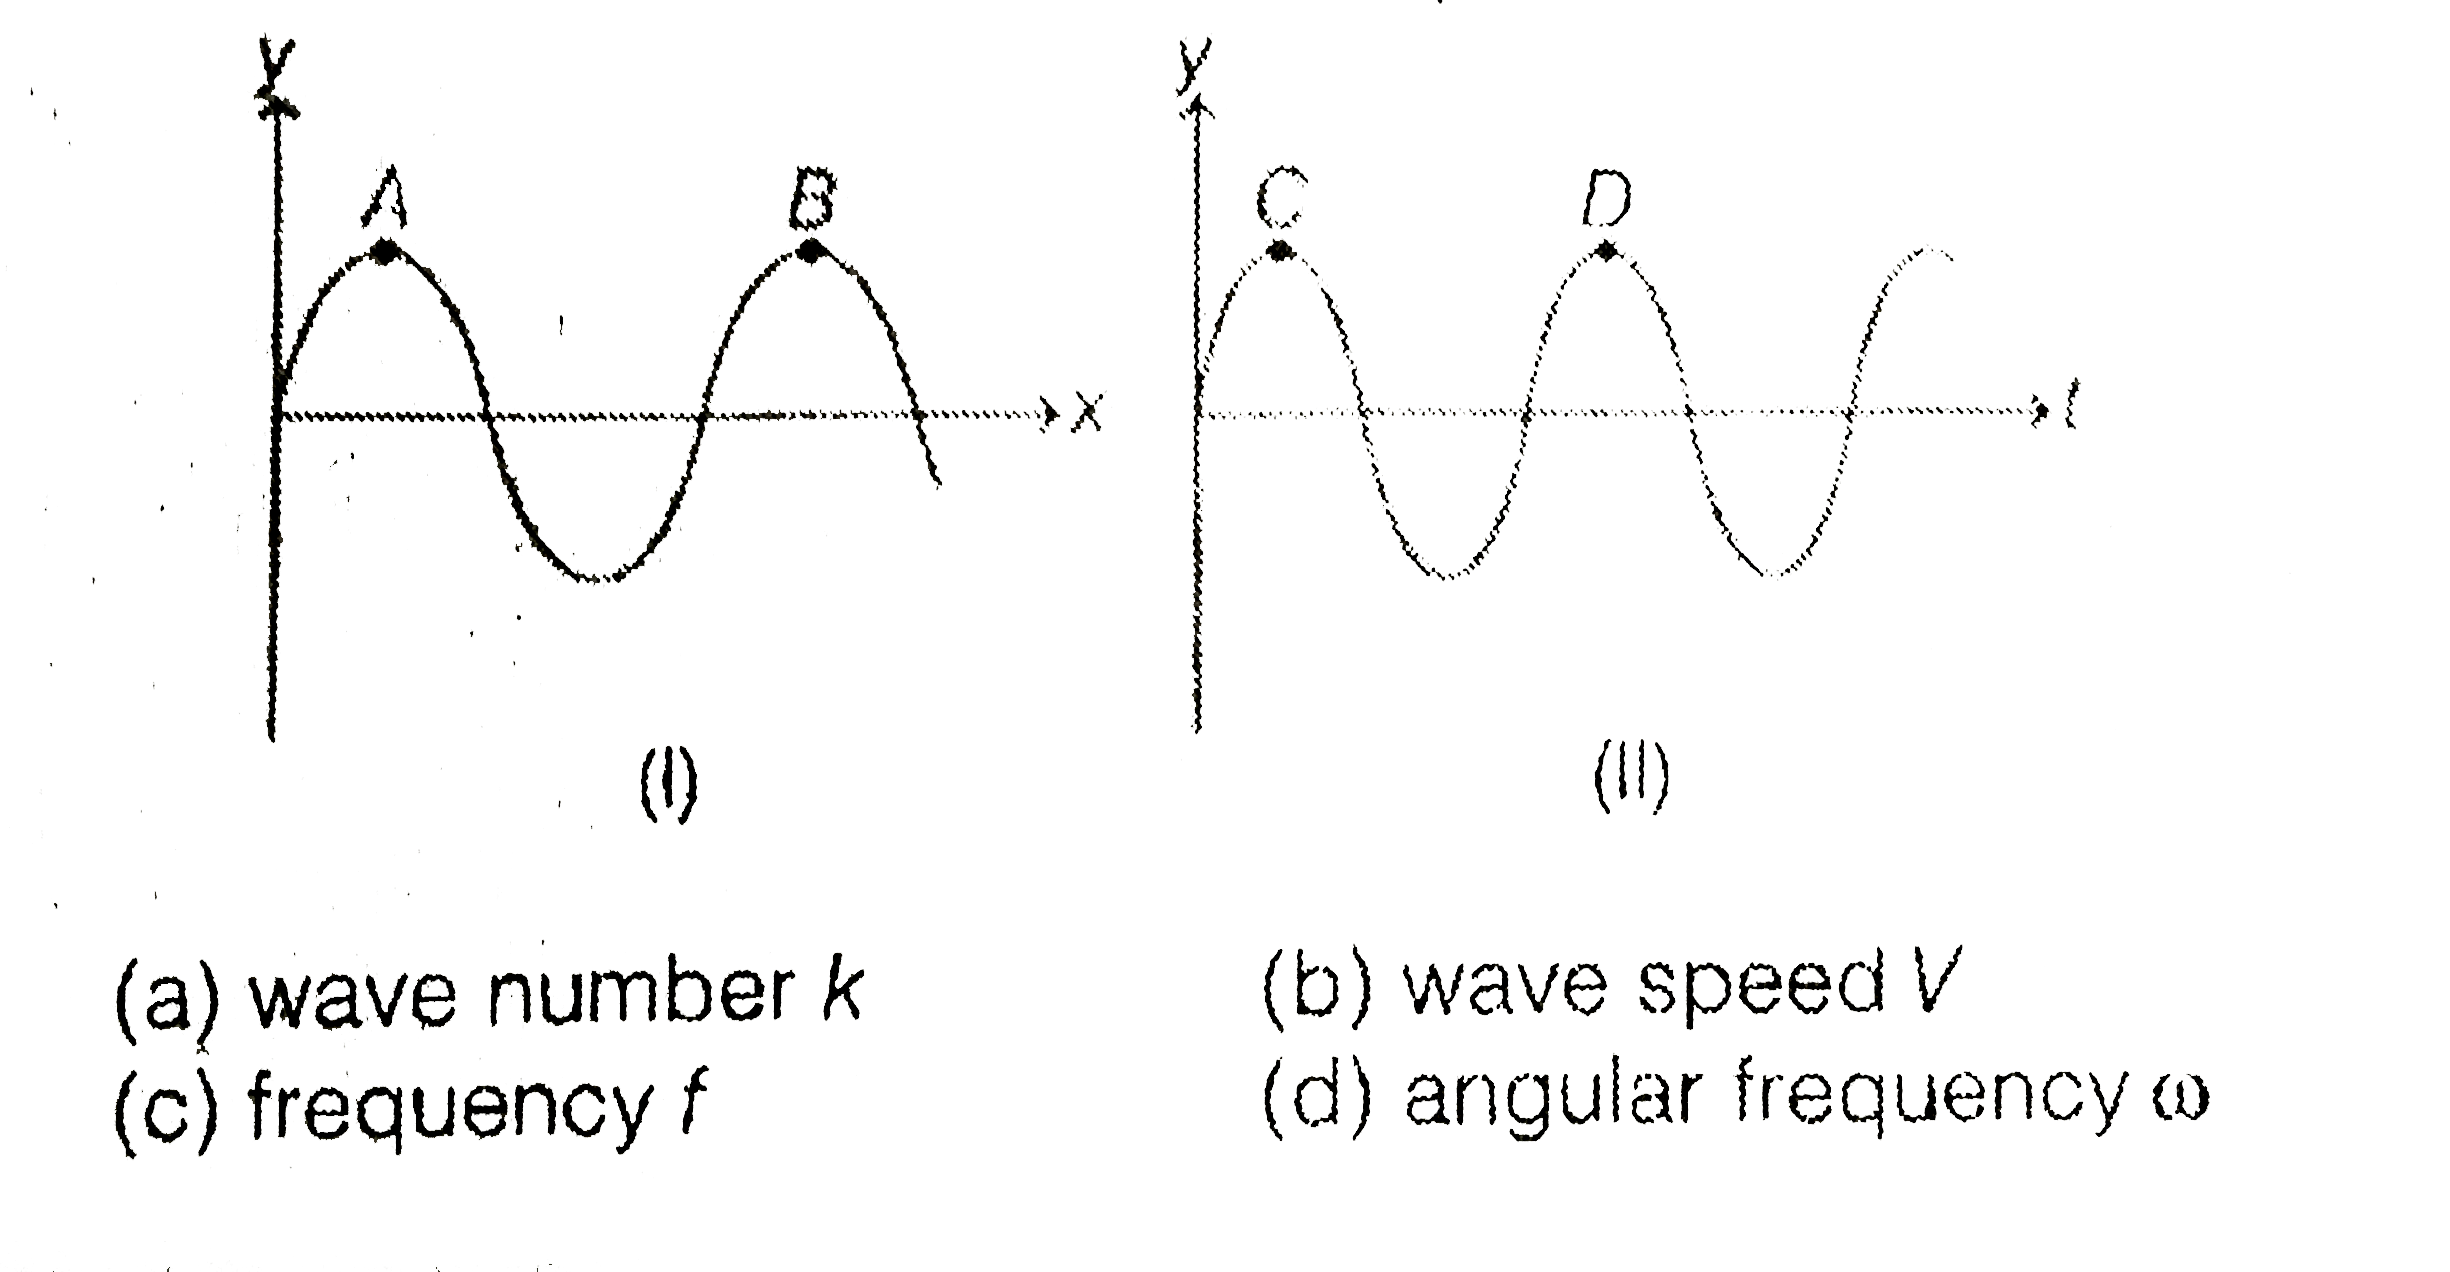
View Solutionthe same progressive wave is reprsented by two group I and II. Graoup I shows how the displacement 'y' varies with the distance x along the wave at a given time. Graph II shows how y varies with time t at a given point on the wave. The ratio of measurements AB to CD, marked on the curvse m repersents.

View Solution

