The experiment set up shown in the following diagram is for
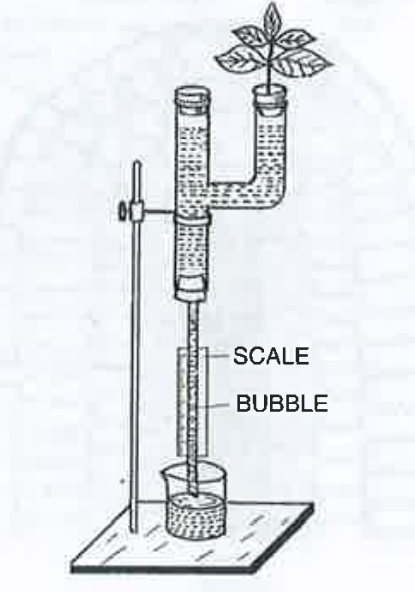
the demonstration of apoplastic pathway
measuring the rate of transpiration
the demonstration of mass flow
the demonstration of anaerobic respiration
The correct Answer is:B
It is student's Potometer .
Similar Questions
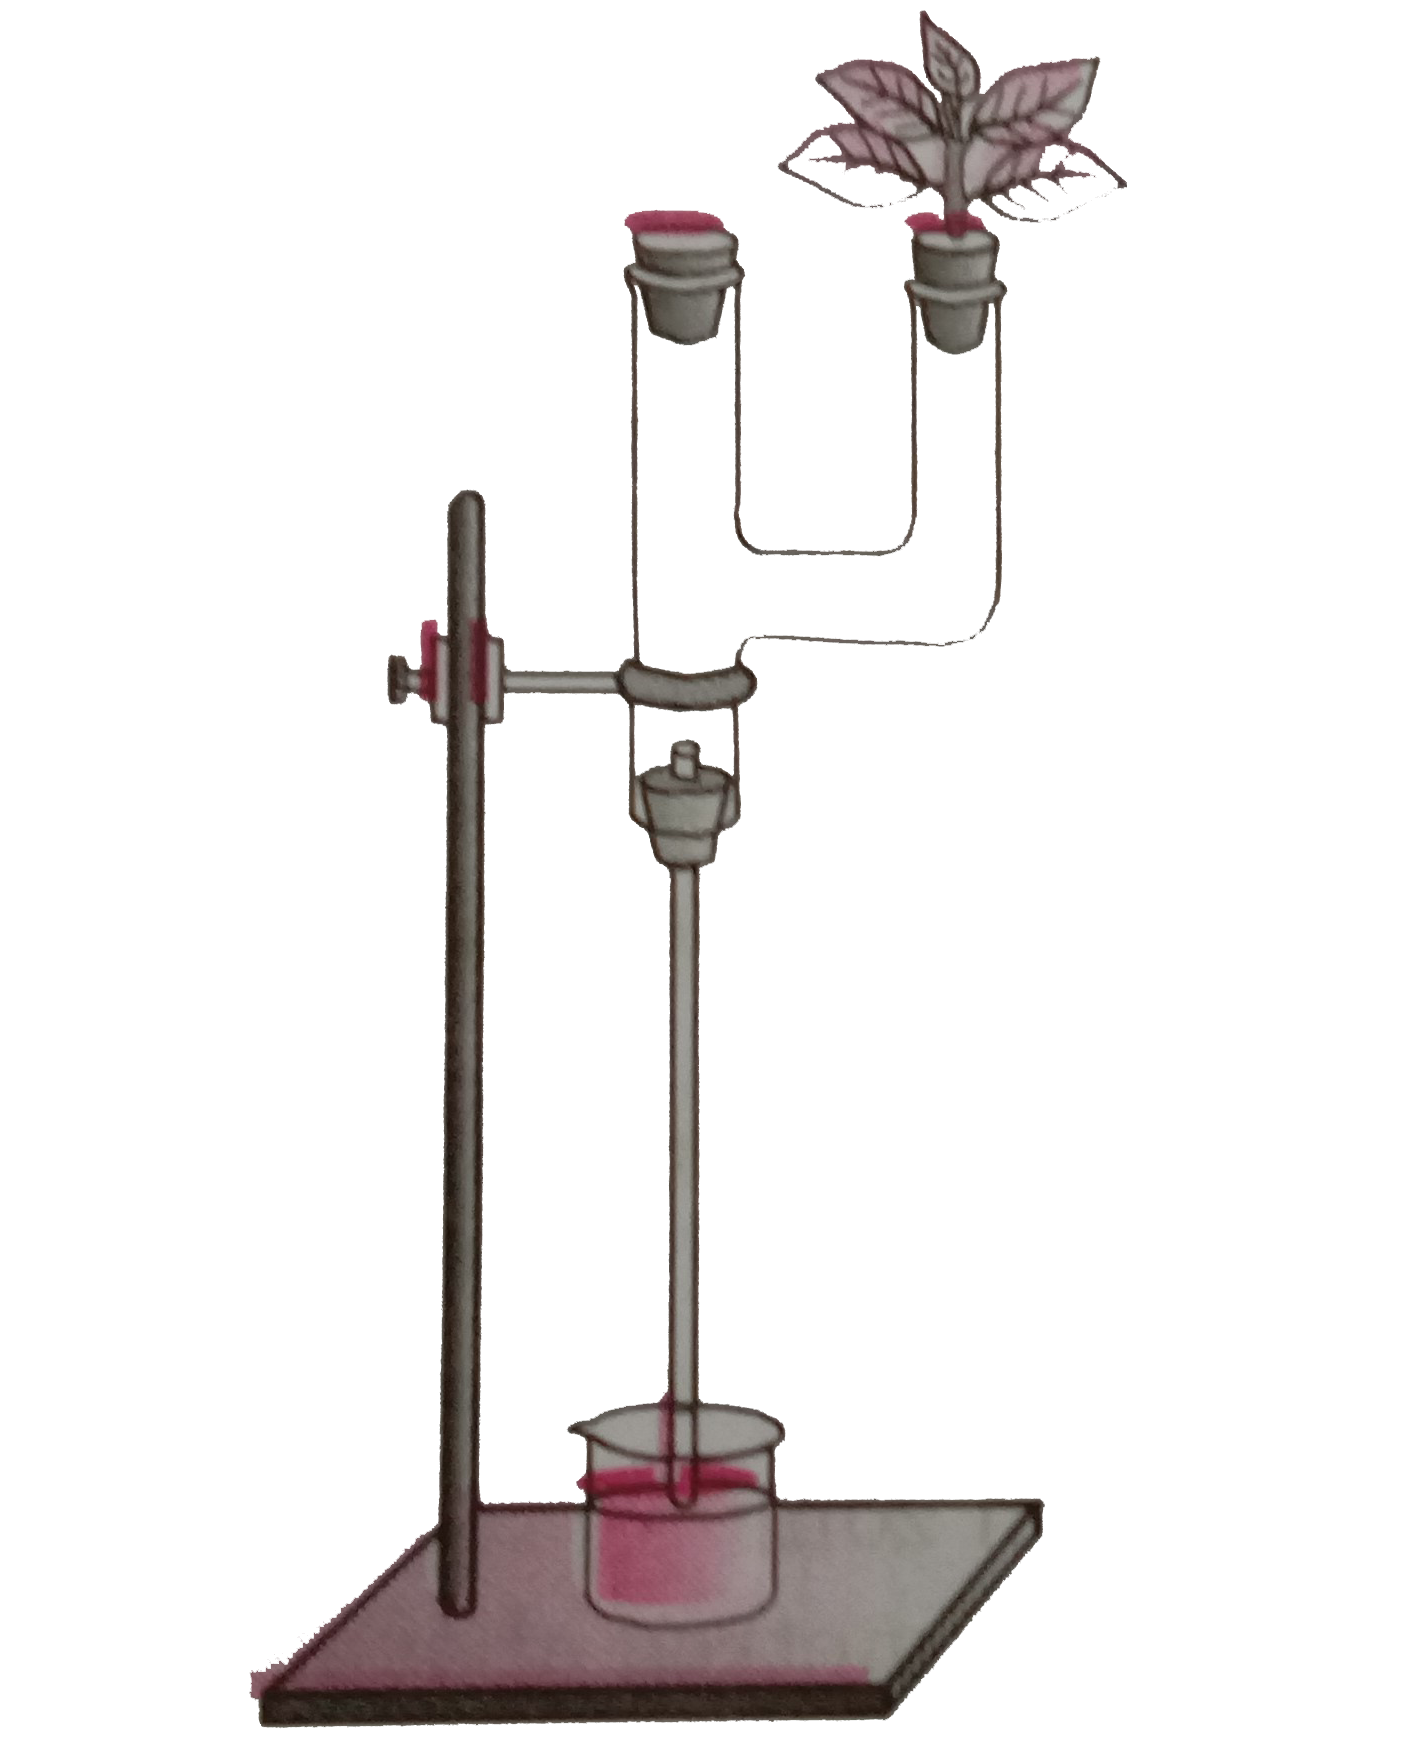
The experiment set up shown in the adjacent diagram is for
View SolutionThe diagram given below is a set up to demonstrate an experiment
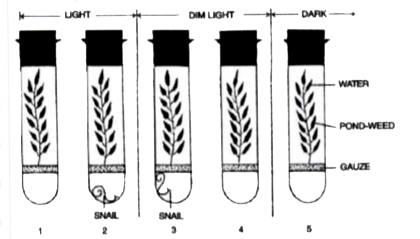
Pond-weed was placed in five water-filled tubes. The experiment was set-up as shown in the diagram. The tubes were then left for 24 hours
The tube in which most oxygen would be found is
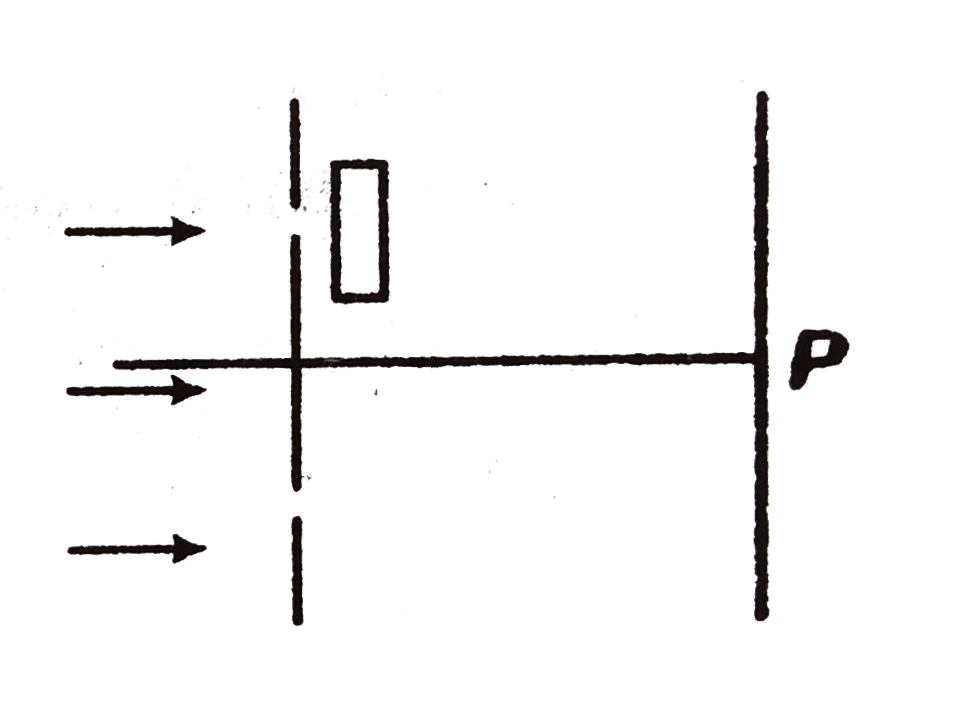
View SolutionYDSE set up shown in figure.
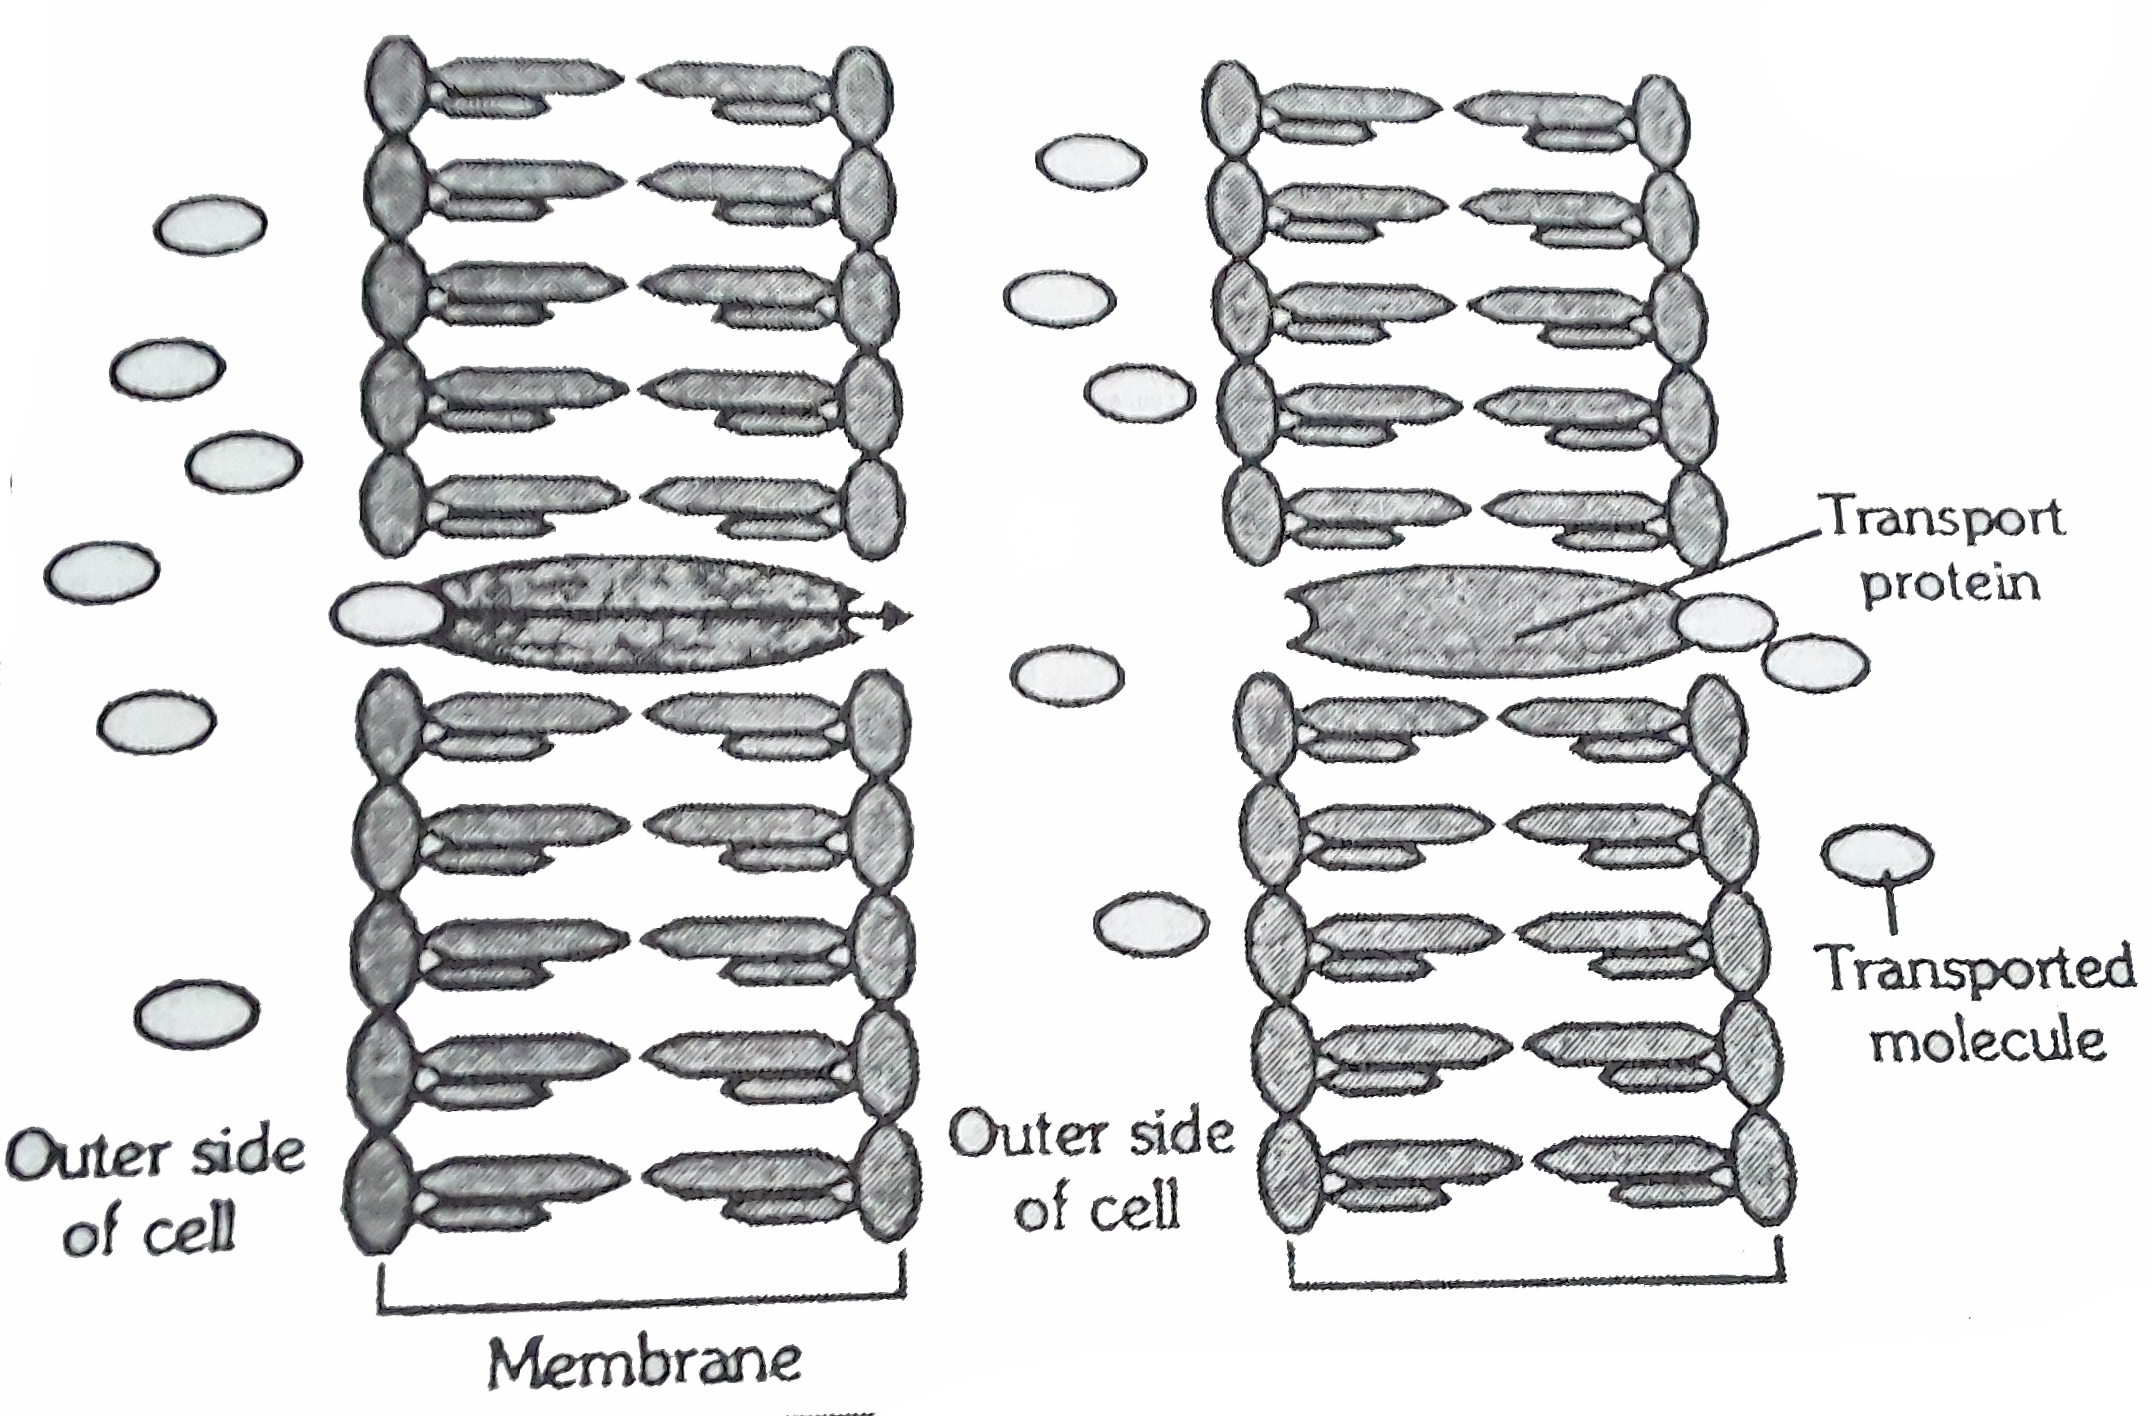
View SolutionFind the means of transport shown in following diagram
View SolutionThe diagram given below is a set up to demonstrate an experiment
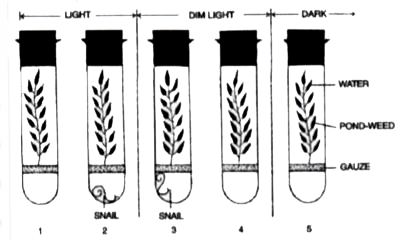
Pond-weed was placed in five water-filled tubes. The experiment was set-up as shown in the diagram. The tubes were then left for 24 hours
The tube in which least carbon dioxide would be found is
View SolutionThe diagram given below is a set up to demonstrate an experiment
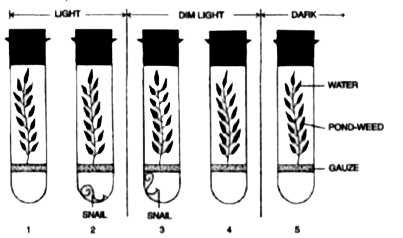
Pond-weed was placed in five water-filled tubes. The experiment was set-up as shown in the diagram. The tubes were then left for 24 hours
In which tube would you expect the greatest increase in dry weight to the pond-weed
View SolutionThe diagram given below is a set up to demonstrate an experiment
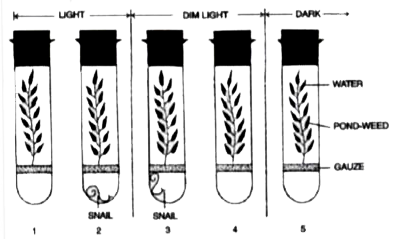
Pond-weed was placed in five water-filled tubes. The experiment was set-up as shown in the diagram. The tubes were then left for 24 hours
In which tube would you expect to find the plant with the least amount of starch?
View SolutionThe diagram given below is a set up to demonstrate an experiment
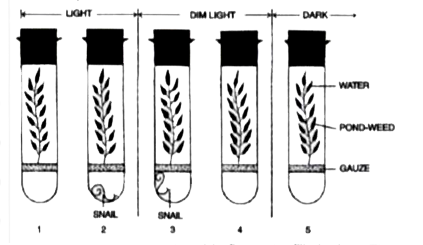
Pond-weed was placed in five water-filled tubes. The experiment was set-up as shown in the diagram. The tubes were then left for 24 hours
The tube in which the plant would survive for the shortest length of time is
View SolutionIdentify the phenomena shown by the organisms in the following diagram.

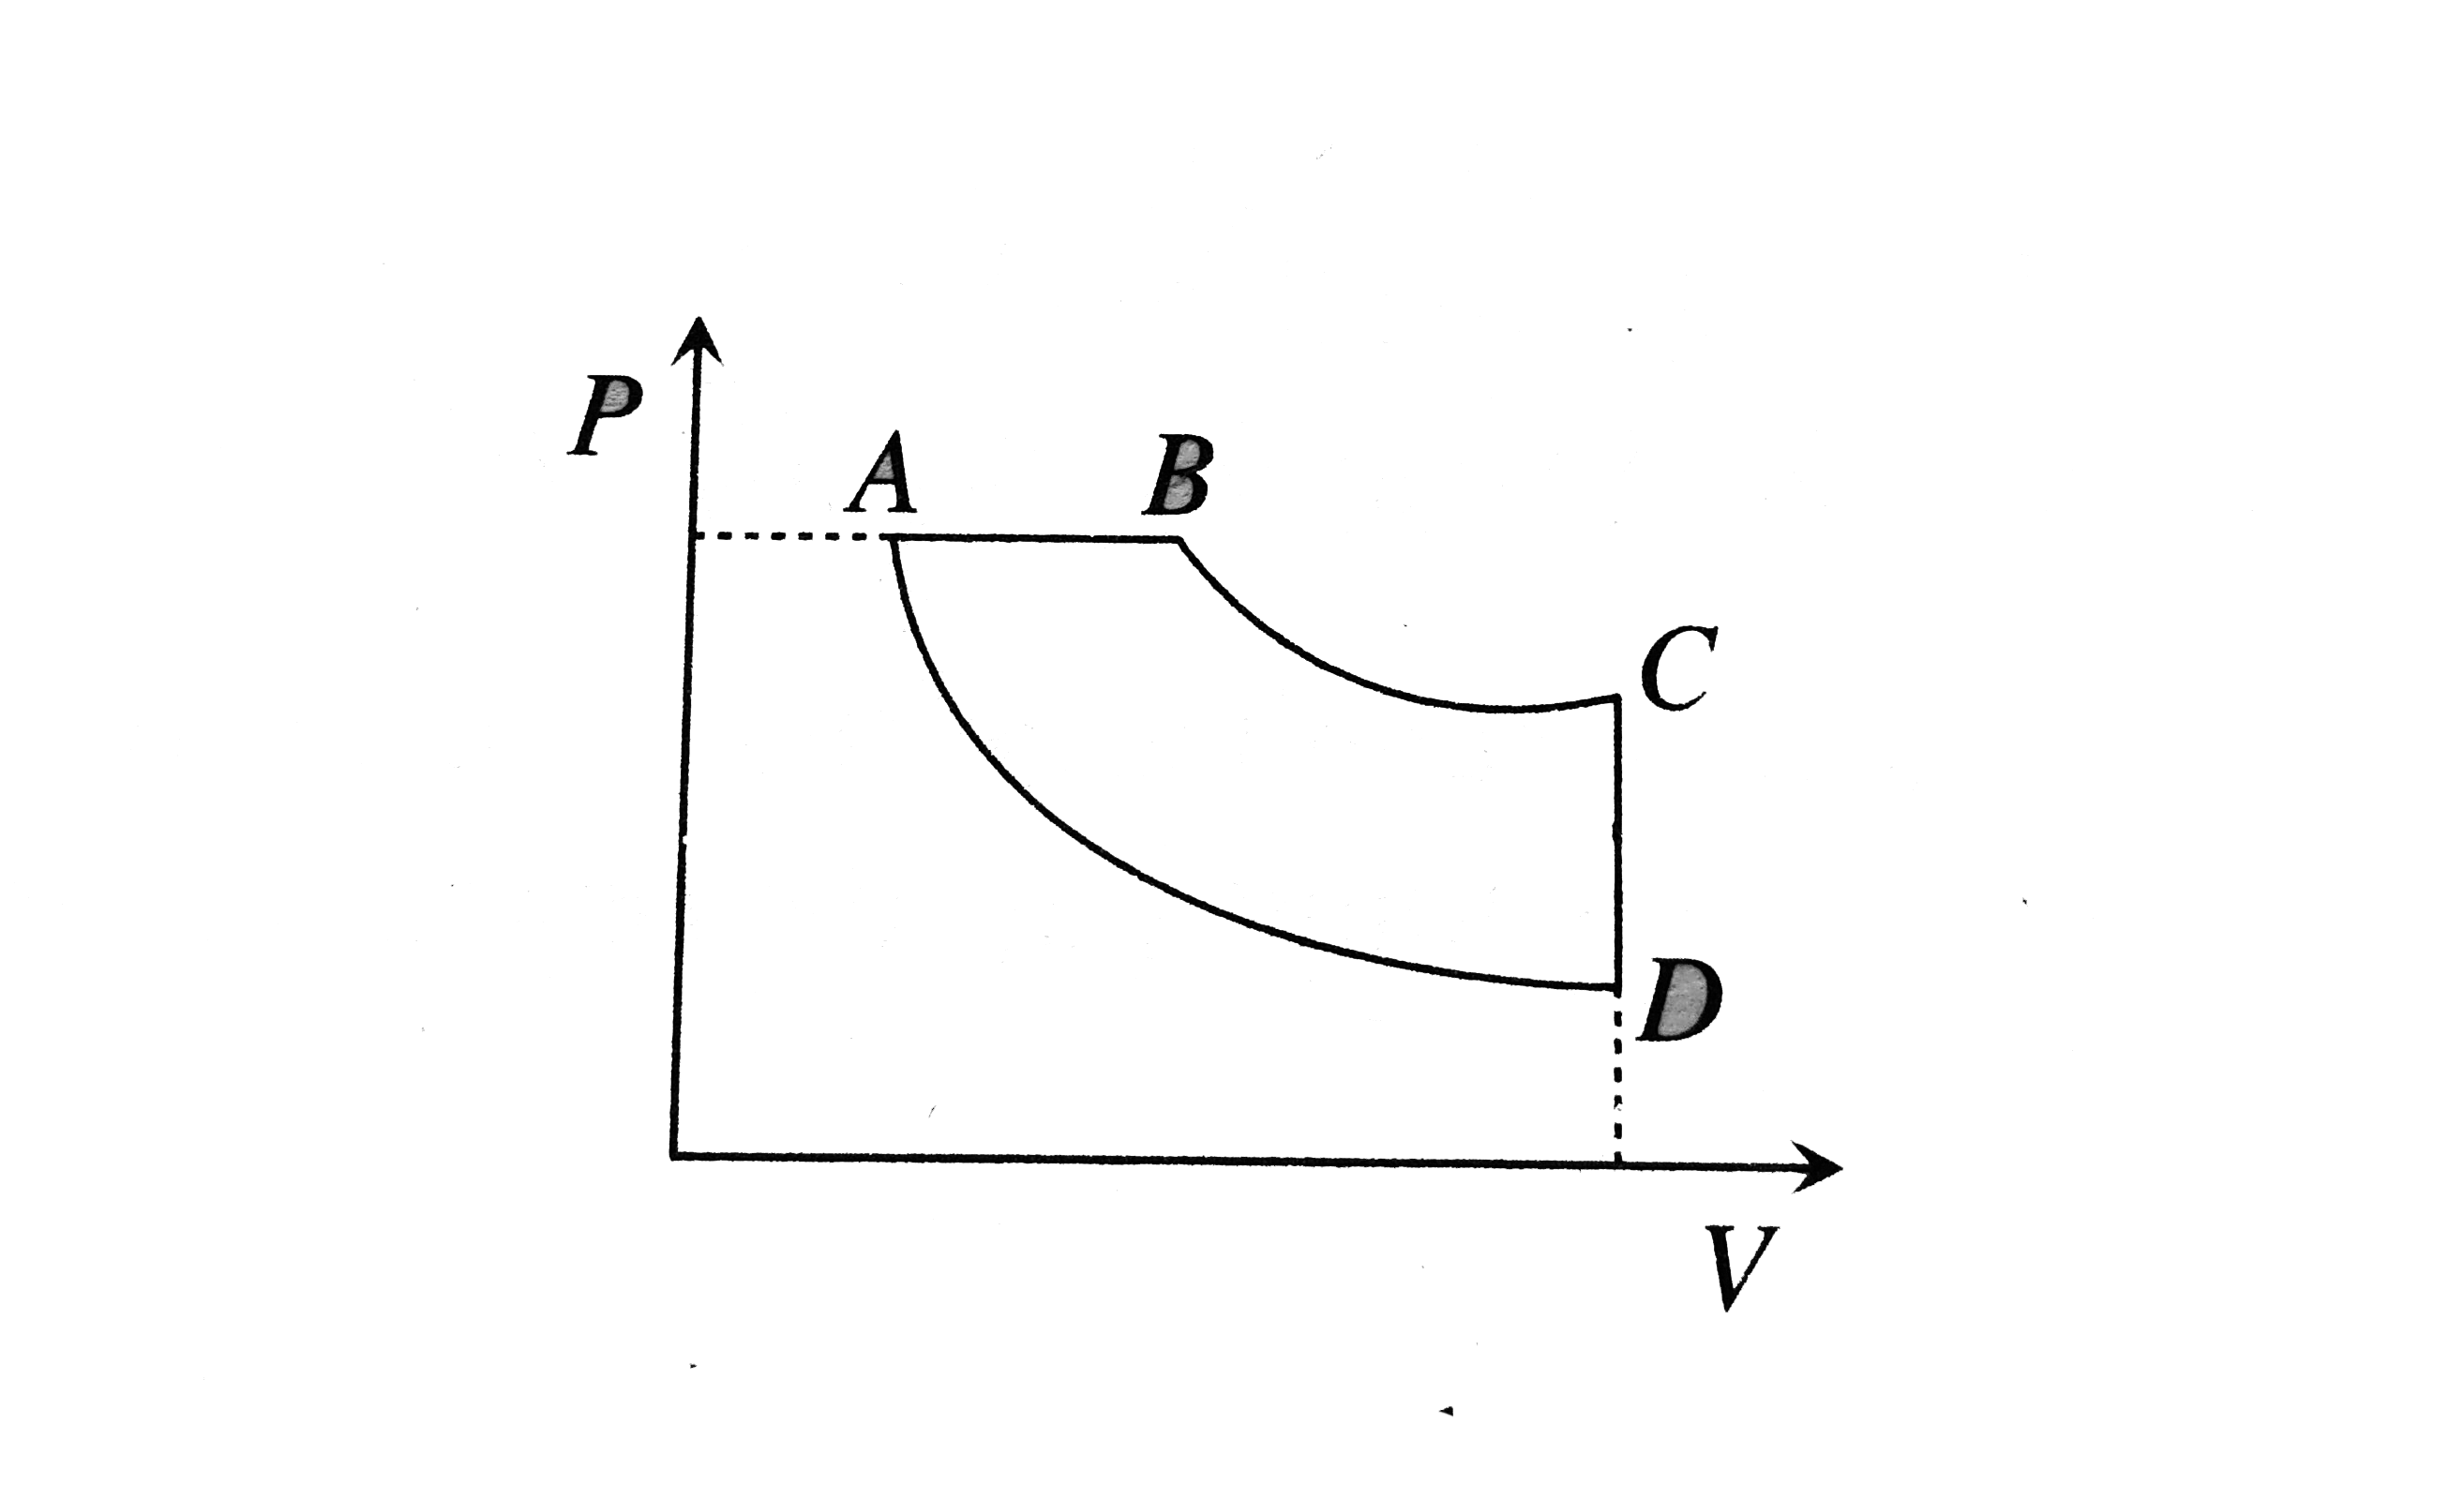
View SolutionA cyclic process ABCD is shown is shown in the following P−V diagram. Which of the following curves represent the same process ?
View Solution

