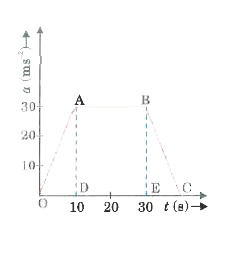
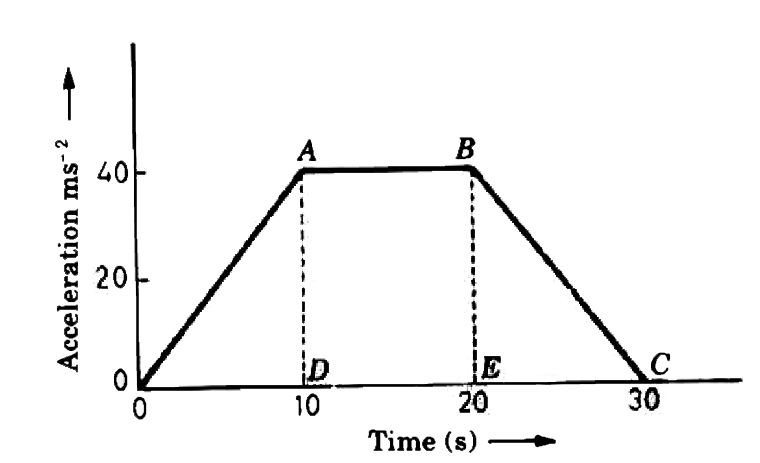
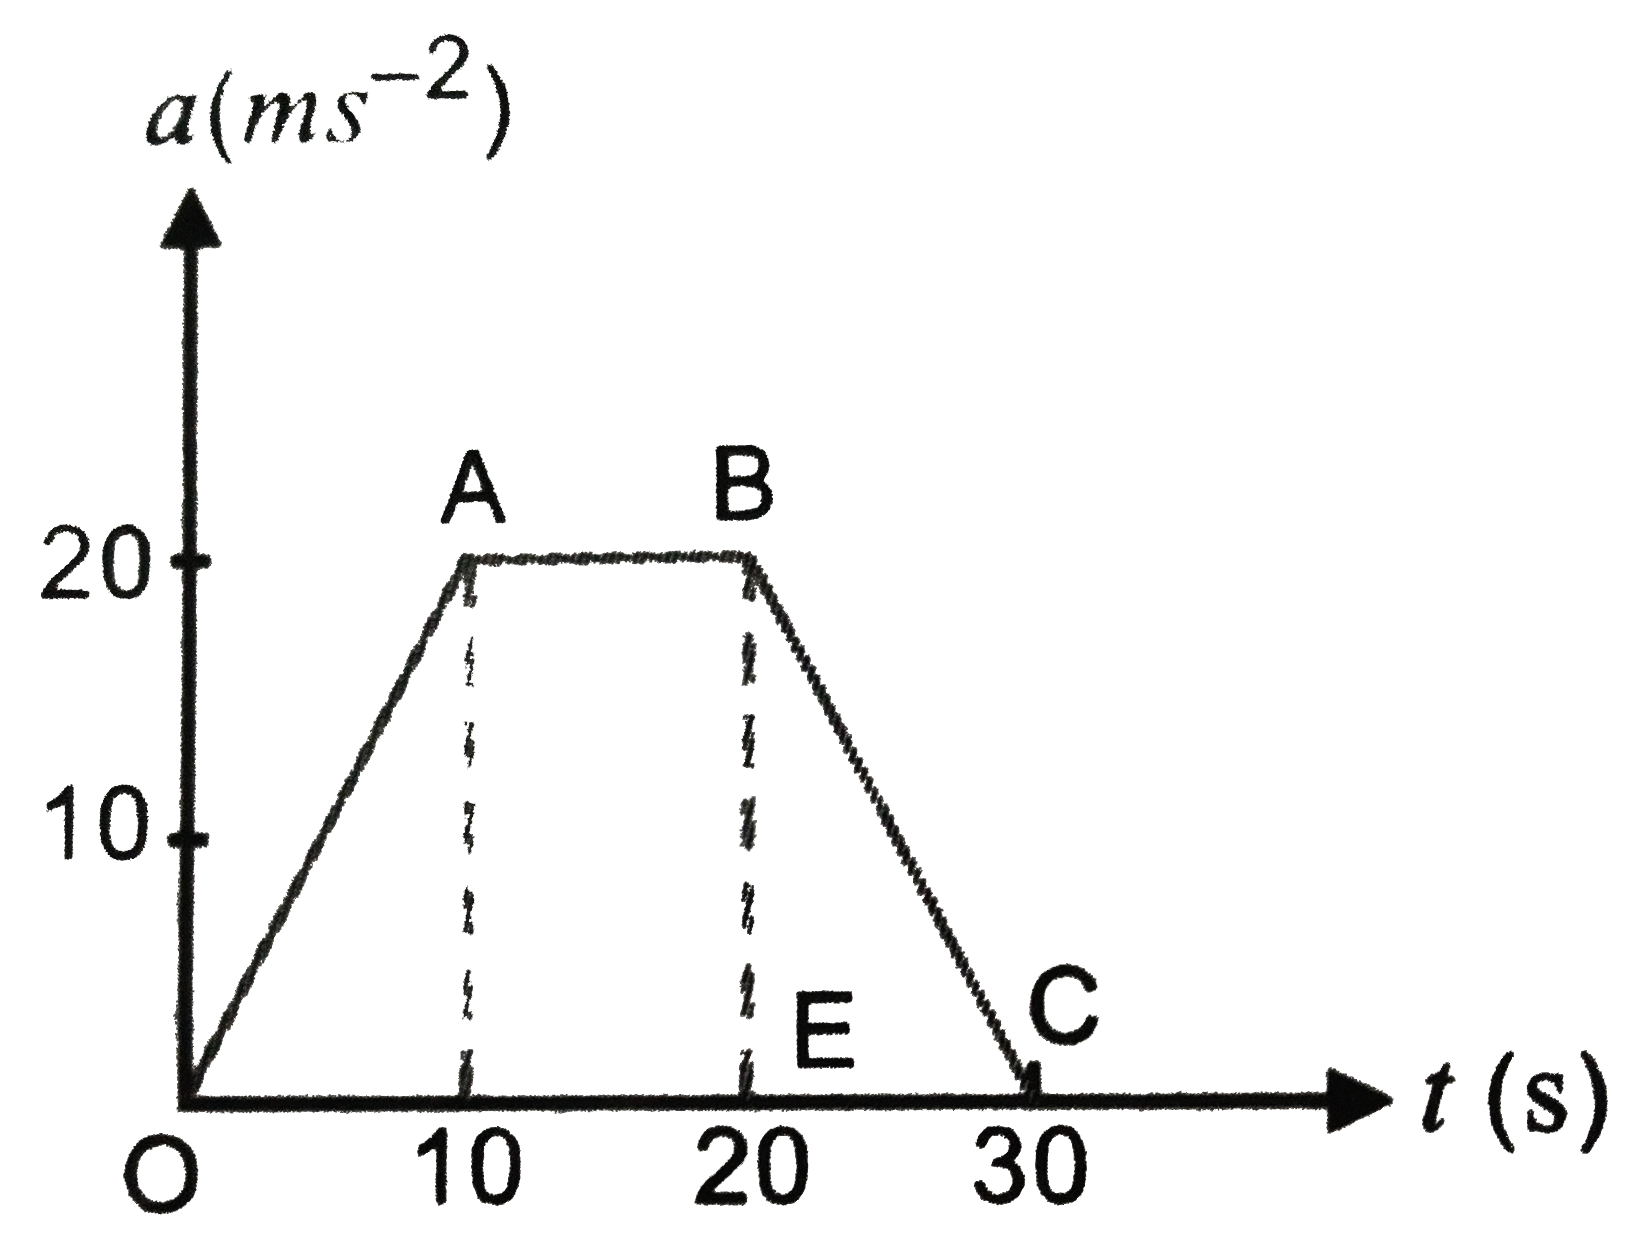
Fig. 3.39 shows the acceleration - time graph for a particle in rectilinear motion. Find the average acceleration in first 20 s.
A
40ms−2
B
30ms−2
C
20ms−2
D
15ms−2
Video Solution
Text Solution
The correct Answer is:D
Average acceleration =Area of a-t graphtime
=AreaOPQM20
=12(20+10)×20×120
=15ms−2 
|
Similar Questions
Knowledge Check
Acceleration time graph of a particle moving along a straight line is given. Then average acceleration between t=0 & t=4 is :−
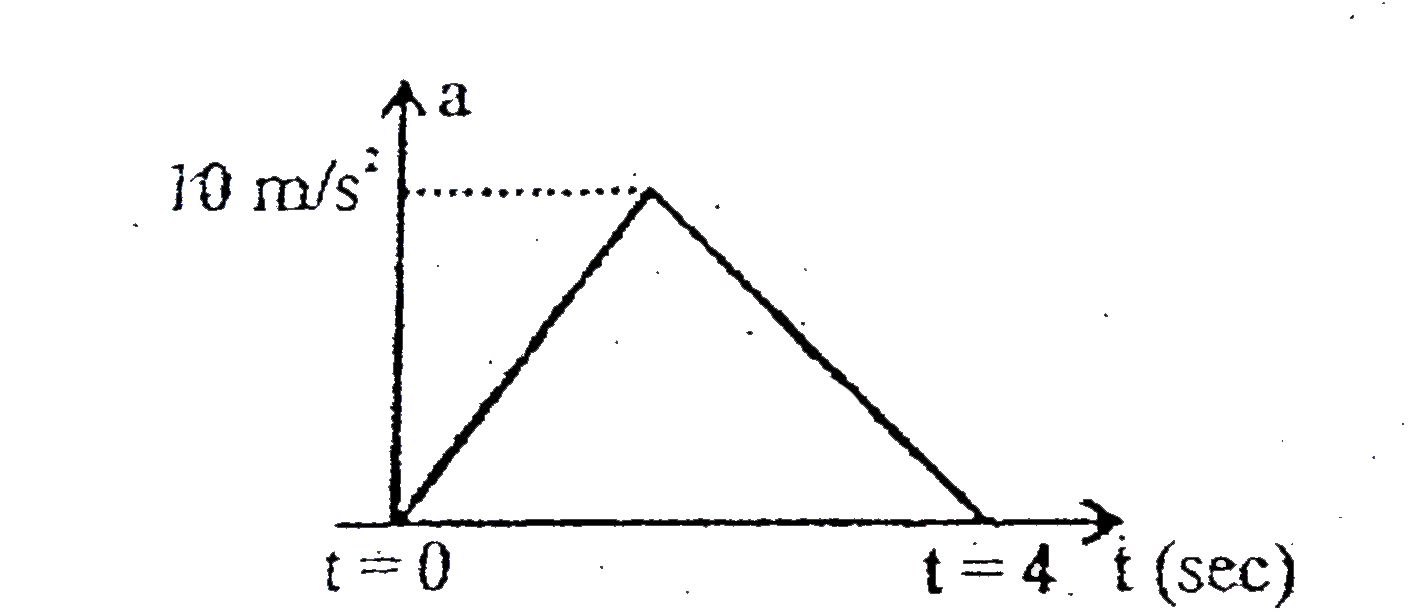 A0m/s2B5m/s2C10m/s2D7.5m/s2
Figure shows the position time graph for a particle in one dimensional motion. What is the displacement of the particle in first 4 seconds ?
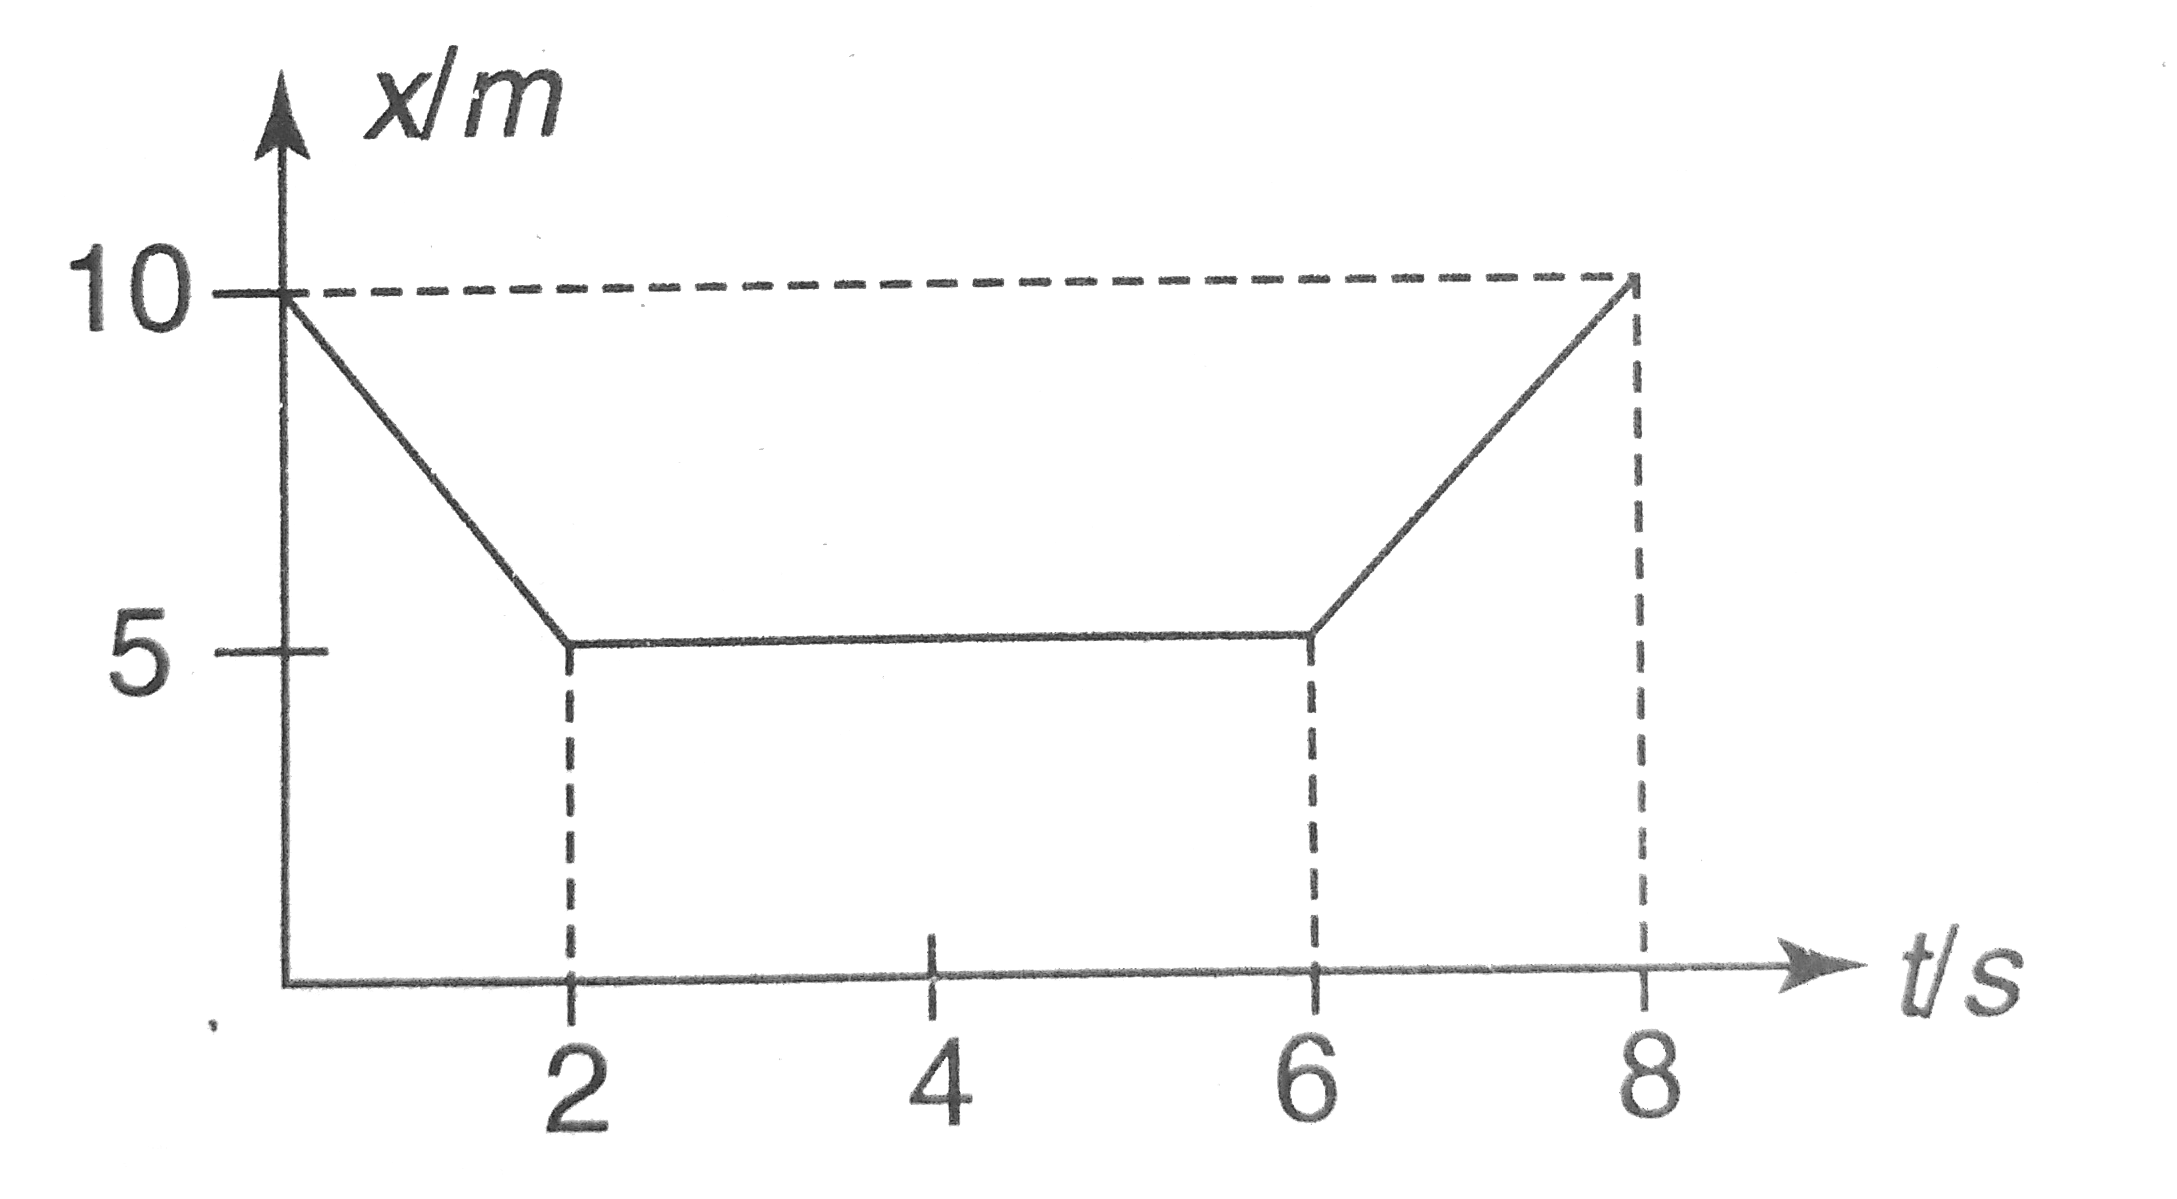 A5 mB−5mCzeroD15 m
For a uniformly accelerated motion, the average acceleration is equal to
AunityBnegativeCzeroDuniform acceleration
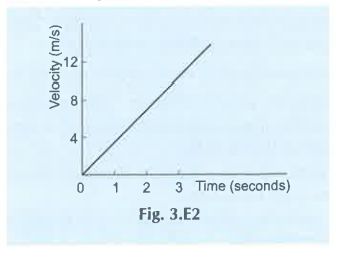
Figure 3.E2 shows the velocity -time graph for a particle moving in a fixed direction. Find the acceleration of the particle.
View Solutions-t graph of a particle in motion is shown in Fig. Calculate
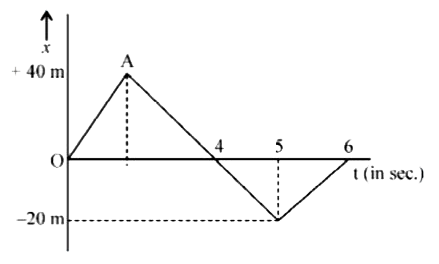
Average speed
View Solutions-t graph of a particle in motion is shown in Fig. Calculate
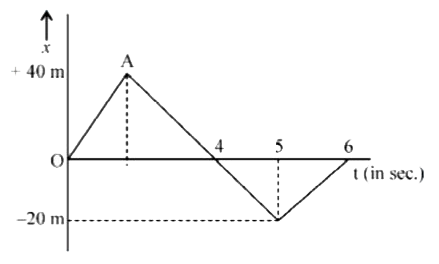
Average velocity
View SolutionThe average acceleration vector for a particle having a uniform circular motion is
View SolutionPosition-time graph for motion with zero acceleration is
View Solution

 .
.