Starting from mean position draw the acceleration time graph for the oscillations of simple pendulum.Solution in Odia
Step by step video & image solution for Starting from mean position draw the acceleration time graph for the oscillations of simple pendulum. by Physics experts to help you in doubts & scoring excellent marks in Class 12 exams.
Updated on:21/07/2023Similar Questions
A pendulum is hung in a very high building and is moving freely to and fro like a simple harmonic oscillator. If the acceleration of the bob is 16ms−1 at a distance of 4 m from the mean position, then the time period is
View SolutionAt mean position of an oscillating simple pendulum
View SolutionTime period of a simple pendulum is T. The time taken to complete 5/8 oscillations starting from mean position is (alpha)/(beta)T . The value of alpha is …………. .
View SolutionThe time period of simple pendulum inside a stationary lift is T. If lift starts accelerating upwards with the acceleration of g/2, then the new time period of the simple pendulum will be
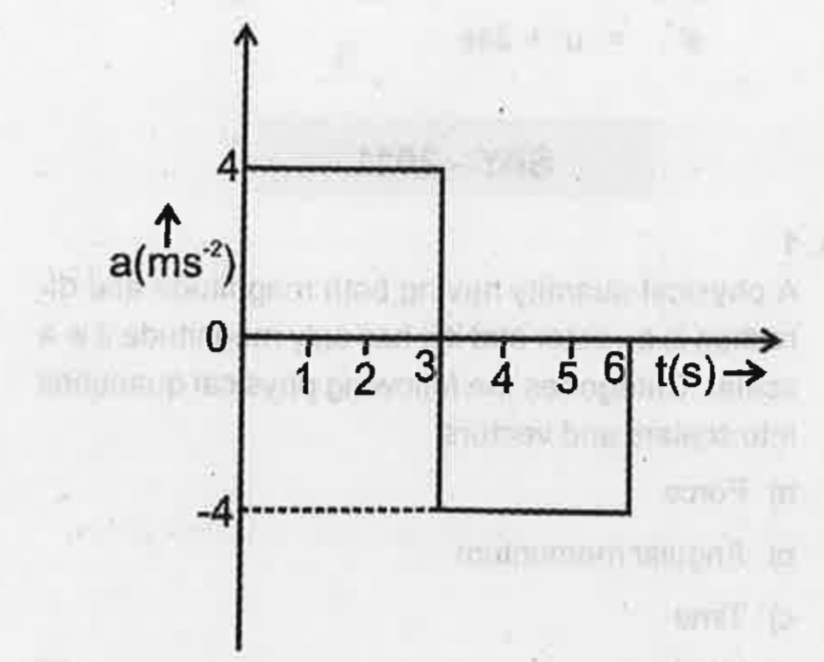
View SolutionAcceleration -time graph of a body starts from rest as shown below :

Draw the velocity-time graph using the above graph
View SolutionStarting from the mean position, a body oscillates simple harmonically with an amplitude of 2m and a period of 2s. draw the variation of displacement with time for the above motion.
View SolutionThe time period of simple pendulum inside a stationary lift is T. If lift starts accelerating upwards with the acceleration of g/2, then the new time period of the simple pendulum will be
View Solution

