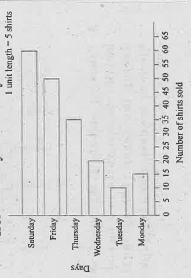
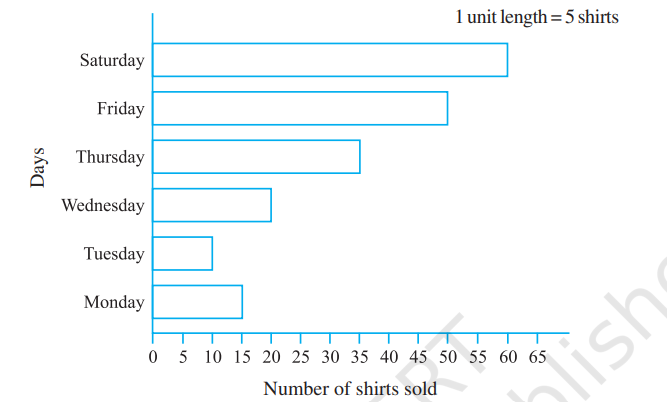
Observe this bar graph which is showing the sale of shirts in a ready made shop from Monday to Saturday. Now answer the following questions : (b) What is the scale chosen on the horizontal line representing number of shirts?
 Solution in Kannada
Step by step video & image solution for Observe this bar graph which is showing the sale of shirts in a ready made shop from Monday to Saturday. Now answer the following questions : (b) What is the scale chosen on the horizontal line representing number of shirts? by Maths experts to help you in doubts & scoring excellent marks in Class 6 exams.
Updated on:21/07/2023Topper's Solved these Questions
Similar Questions
Find the rule which gives the number of matchsticks required to make the following matchstick patterns. Use a variable to write the rule. (a) A pattern f letter Z as
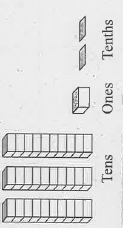
View SolutionWrite the fraction representing the place value blocks. (a)

View SolutionObserve this bar graph which is showing the sale of shirts in a ready made shop from Monday to Saturday

View SolutionDetermine the point of symmetry of a regular hexagon.
View SolutionMatch the following Column A to Column B

View SolutionMatch the following Column A to Column B

View SolutionMatch the following Column A to Column B

View SolutionThe inequation represented by the graph given below is :
View SolutionThe inequation that best describes the graph given below is _________
View SolutionThe inequation that best describes the following graph is _________
View SolutionFrom the following figure, the correct observation is :- ltimg src="https://d10lpgp6xz60nq.cloudfront.net/physics_images/ALN_PHY_R03_E08_015_Q01.png" width="80%"gt
View SolutionObserve this bar graph which is showing the sale of shirts in a ready made shop from Monday to Saturday
View SolutionObserve this bar graph which is showing the sale of shirts in a ready made shop from Monday to Saturday. Now answer the following questions : ( c) On which day were the maximum number of shirts sold? How many shirts were sold on that day?
View SolutionObserve this bar graph which is showing the sale of shirts in a ready made shop from Monday to Saturday. Now answer the following questions : (d) On which day were the minimum number of shirts sold?
View SolutionObserve this bar graph which is showing the sale of shirts in a ready made shop from Monday to Saturday. Now answer the following questions : (e) How many shirts were sold on Thursday?
View Solution
