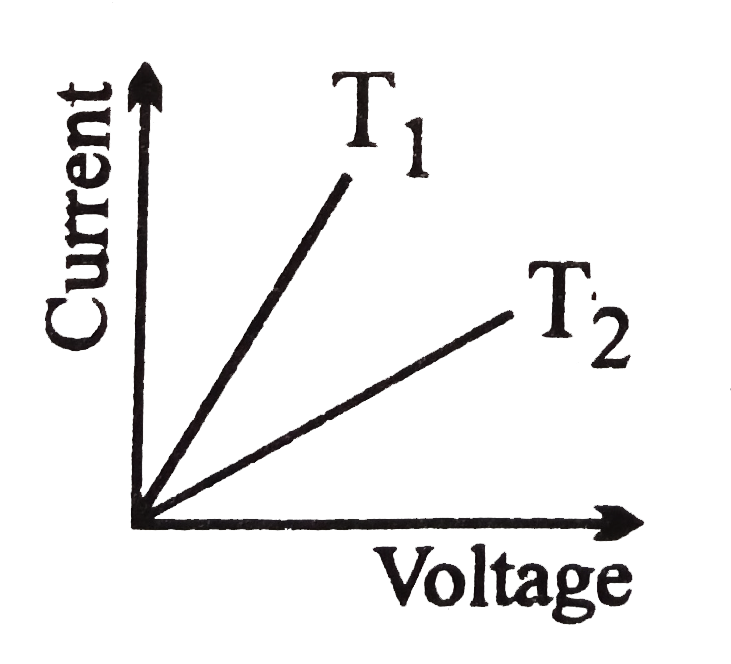
The current (I) and voltage (V) graphs for a given metallic wire at two different temperature (T1) and (T2) are shown in fig. It is concluded that
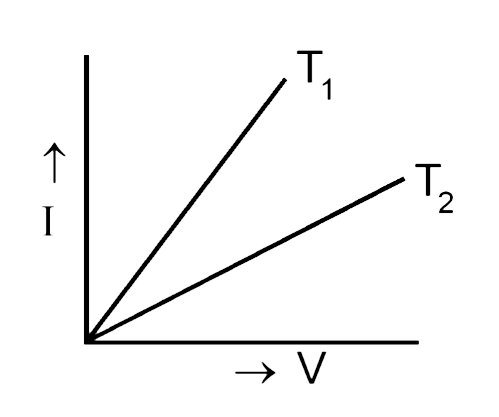
T1>T2
T1<T2
T1=T2
T1>2T2
The correct Answer is:B
Step by step video solution for The current (I) and voltage (V) graphs for a given metallic wire at two different temperature (T_(1)) and (T_(2)) are shown in fig. It is concluded that by Physics experts to help you in doubts & scoring excellent marks in Class 12 exams.
Updated on:21/07/2023टॉपर्स ने हल किए ये सवाल
- CURRENT ELECTRICITYBook:DC PANDEY ENGLISHChapter:CURRENT ELECTRICITYExercise:B. Assertion and reason
Explore 18 Videos
- CURRENT ELECTRICITYBook:DC PANDEY ENGLISHChapter:CURRENT ELECTRICITYExercise:Match the columns
Explore 4 Videos
- CURRENT ELECTRICITYBook:DC PANDEY ENGLISHChapter:CURRENT ELECTRICITYExercise:Check point
Explore 70 Videos
- COMMUNICATION SYSTEMBook:DC PANDEY ENGLISHChapter:COMMUNICATION SYSTEMExercise:Subjective
Explore 11 Videos
- ELECTROMAGNETIC INDUCTIONBook:DC PANDEY ENGLISHChapter:ELECTROMAGNETIC INDUCTIONExercise:Medical entrances gallery
Explore 25 Videos
समान प्रश्न
The current - voltage graphs for a given metallic wire at two different temperatures T1andT2 are shown in the figure.
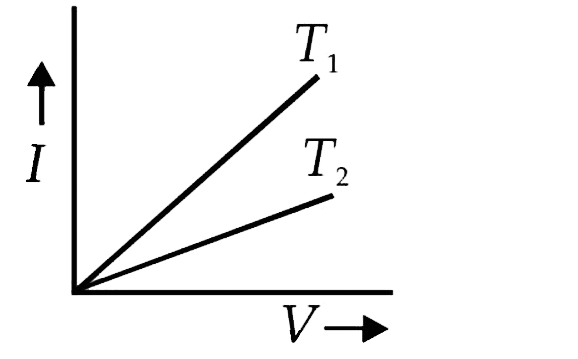
The temperature T2 is greater than T1.
View SolutionThe current - voltage graphs for a given metallic wire at two different temperatures T1andT2 are shown in the figure.

The temperature T2 is greater than T1.
View Solution
ज्ञान जांच
The voltage V and current I v graphs for a conductor at two different temperatures T1andT2 are shown in the figure. The relation between T1andT2 is
 AT1>T2BT1<T2CT1=T2DT1=1T2
Assertion : Current versus potential difference (i-V) graph for a conductor at two different temperatures T1 and T2 is shown in figure. Hence T1>T2.
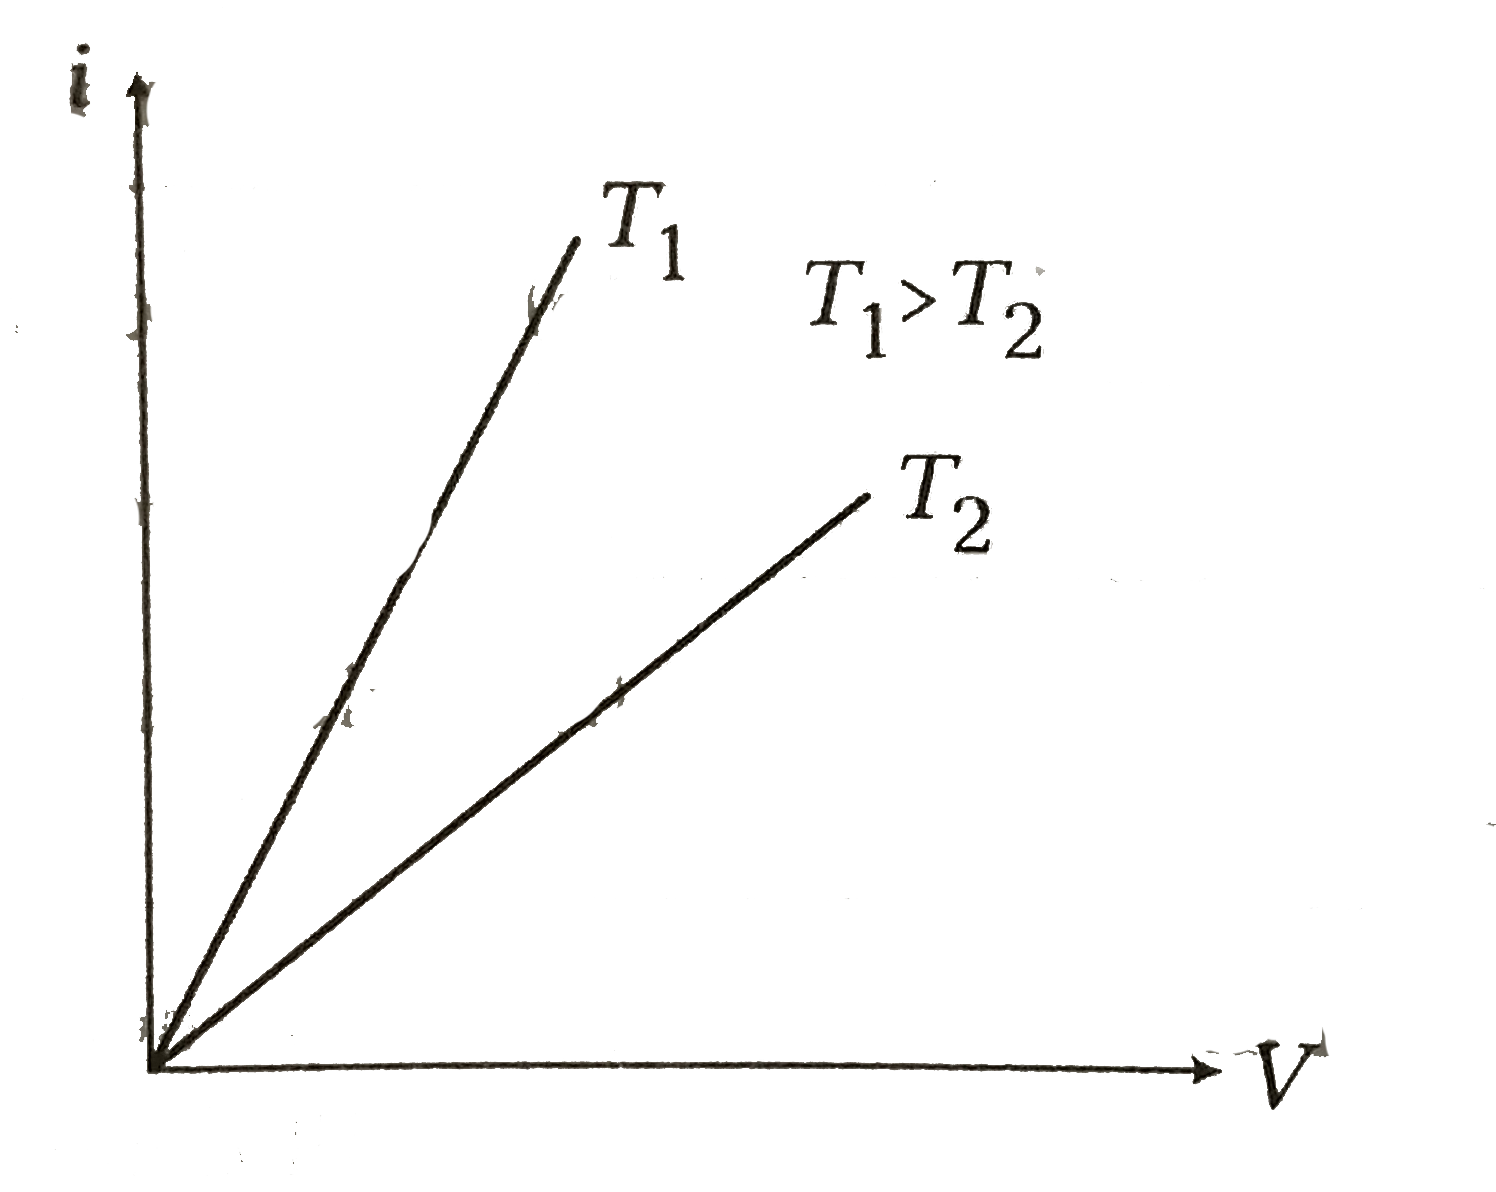
Reason : Resistance of a conductor increases with rise in temperature.Acos2θBsin2θCcot2θDtan2θ
The current voltage graphs for a given metalic wire two different temperature T1 and T2 are shown in figure The temperature T2 is greater than T1. Is this statement true or false?
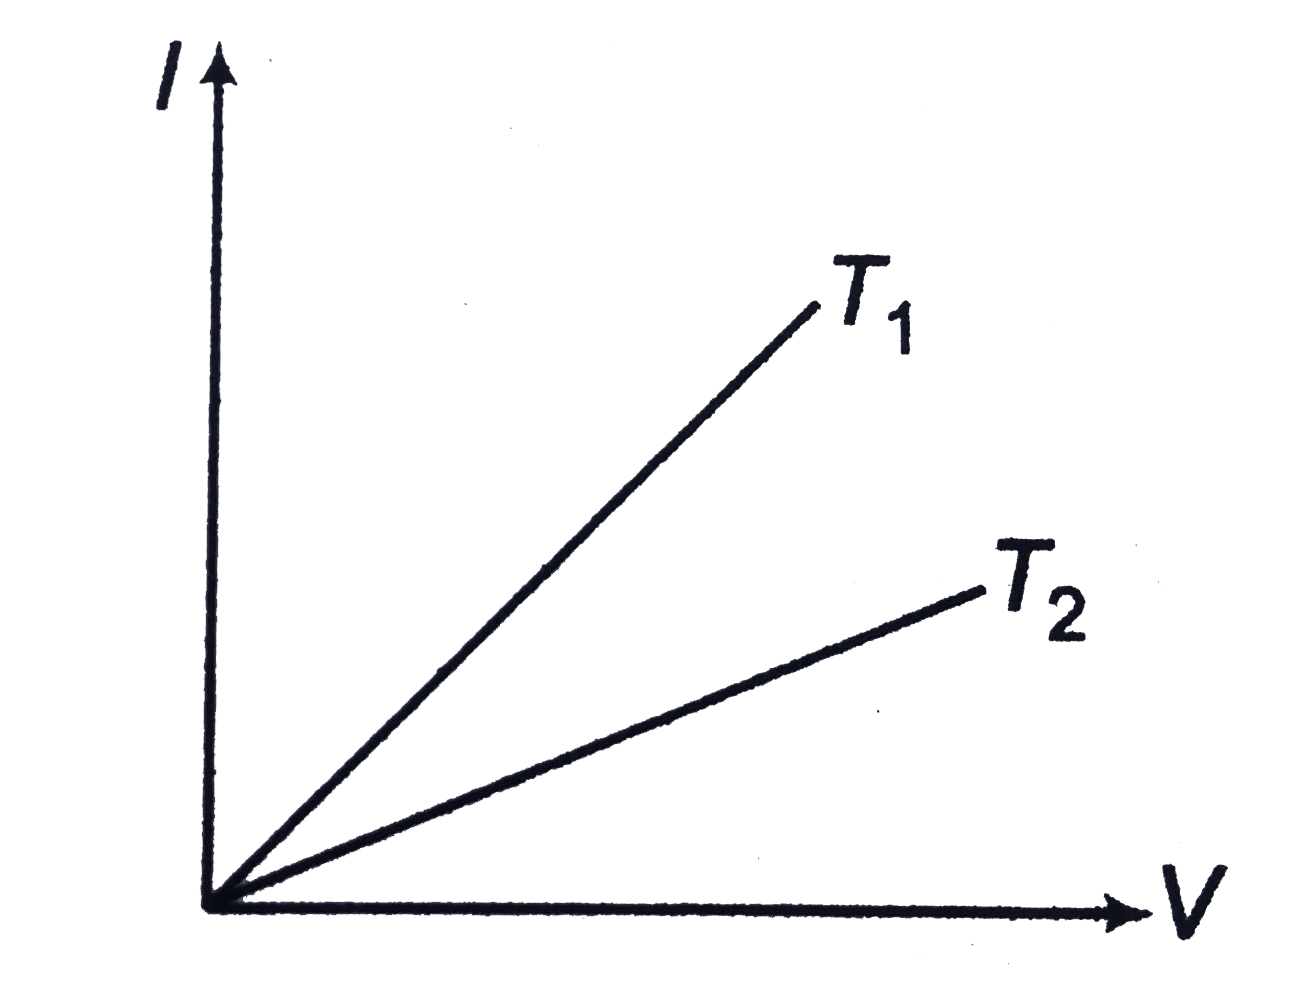
View SolutionThe current voltage graphs for a given metalic wire two different temperature T1 and T2 are shown in figure The temperature T2 is greater than T1. Is this statement true or false?

View SolutionI-V graph for a metallie wire at two different tempearture, T1andT2 is as shown in the figure. Which of the two temperatures is lower and why ?

View SolutionThe stress-strain graph for a metallic wire is shown at two different temperature, T1 and T2 which temperature is high T1 or T2 ?
View SolutionAssertion : Current versus potential difference (i-V) graph for a conductor at two different temperatures T1 and T2 is shown in figure. Hence T1>T2.

Reason : Resistance of a conductor increases with rise in temperature.
View SolutionThe current in a metallic conductor is plotted against voltage at two different temperatures T1 and T2. Which is correct
View Solution
