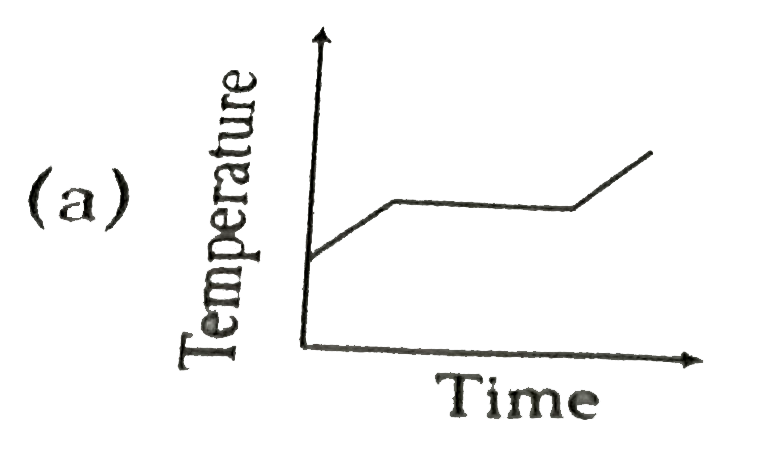
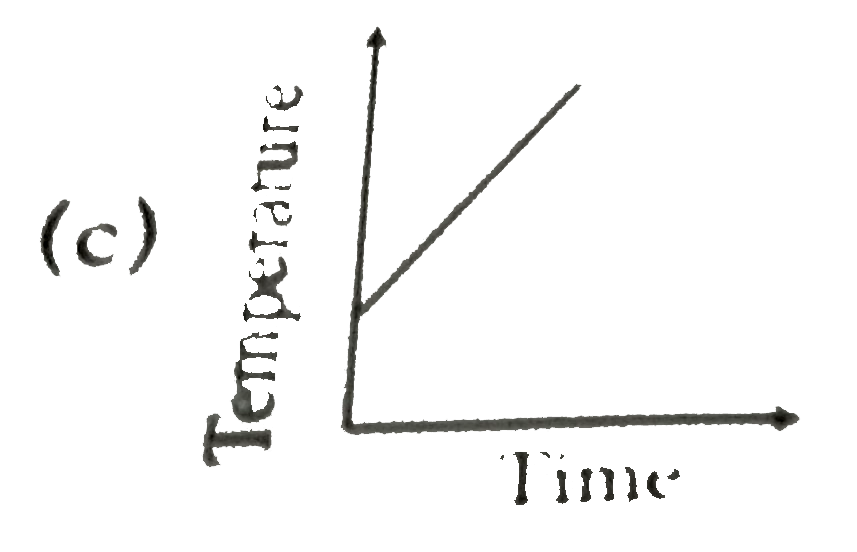
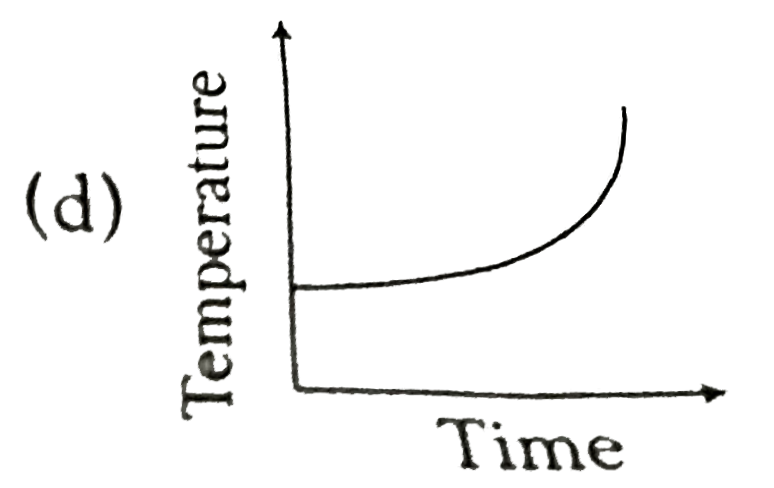
Liquid oxygen at 50K is heated to 300K at constant pressure of 1atm. The rate of heating is constant. Which of the following graphs represents the variation of temperature with time?


The correct Answer is:A
Graph a) shows the variation of temperature with time. At first, temperature will increase, then there will be state change from liquid to gas.
Topper's Solved these Questions
- CALORIMETRY AND HEAT TRANSFERBOOK - DC PANDEY ENGLISHCHAPTER - CALORIMETRY AND HEAT TRANSFEREXERCISE - Match the columns
4 Videos
- CALORIMETRY & HEAT TRANSFERBOOK - DC PANDEY ENGLISHCHAPTER - CALORIMETRY & HEAT TRANSFEREXERCISE - Level 2 Subjective
14 Videos
- CENTRE OF MASSBOOK - DC PANDEY ENGLISHCHAPTER - CENTRE OF MASSEXERCISE - Medical entrances gallery
27 Videos
Similar Questions
Match the following columns, Column1Coloumn2a Specific heatp [MLT^(-3)K^(-1)]b Coefficient of thermal conductivityq [MT^(-3)K^(-4)]c Boltzmann constantr [L^(2)T^(-2)K^(-1)]d Stefan's constats [ML^(2)T^(-2)K^(-1)]
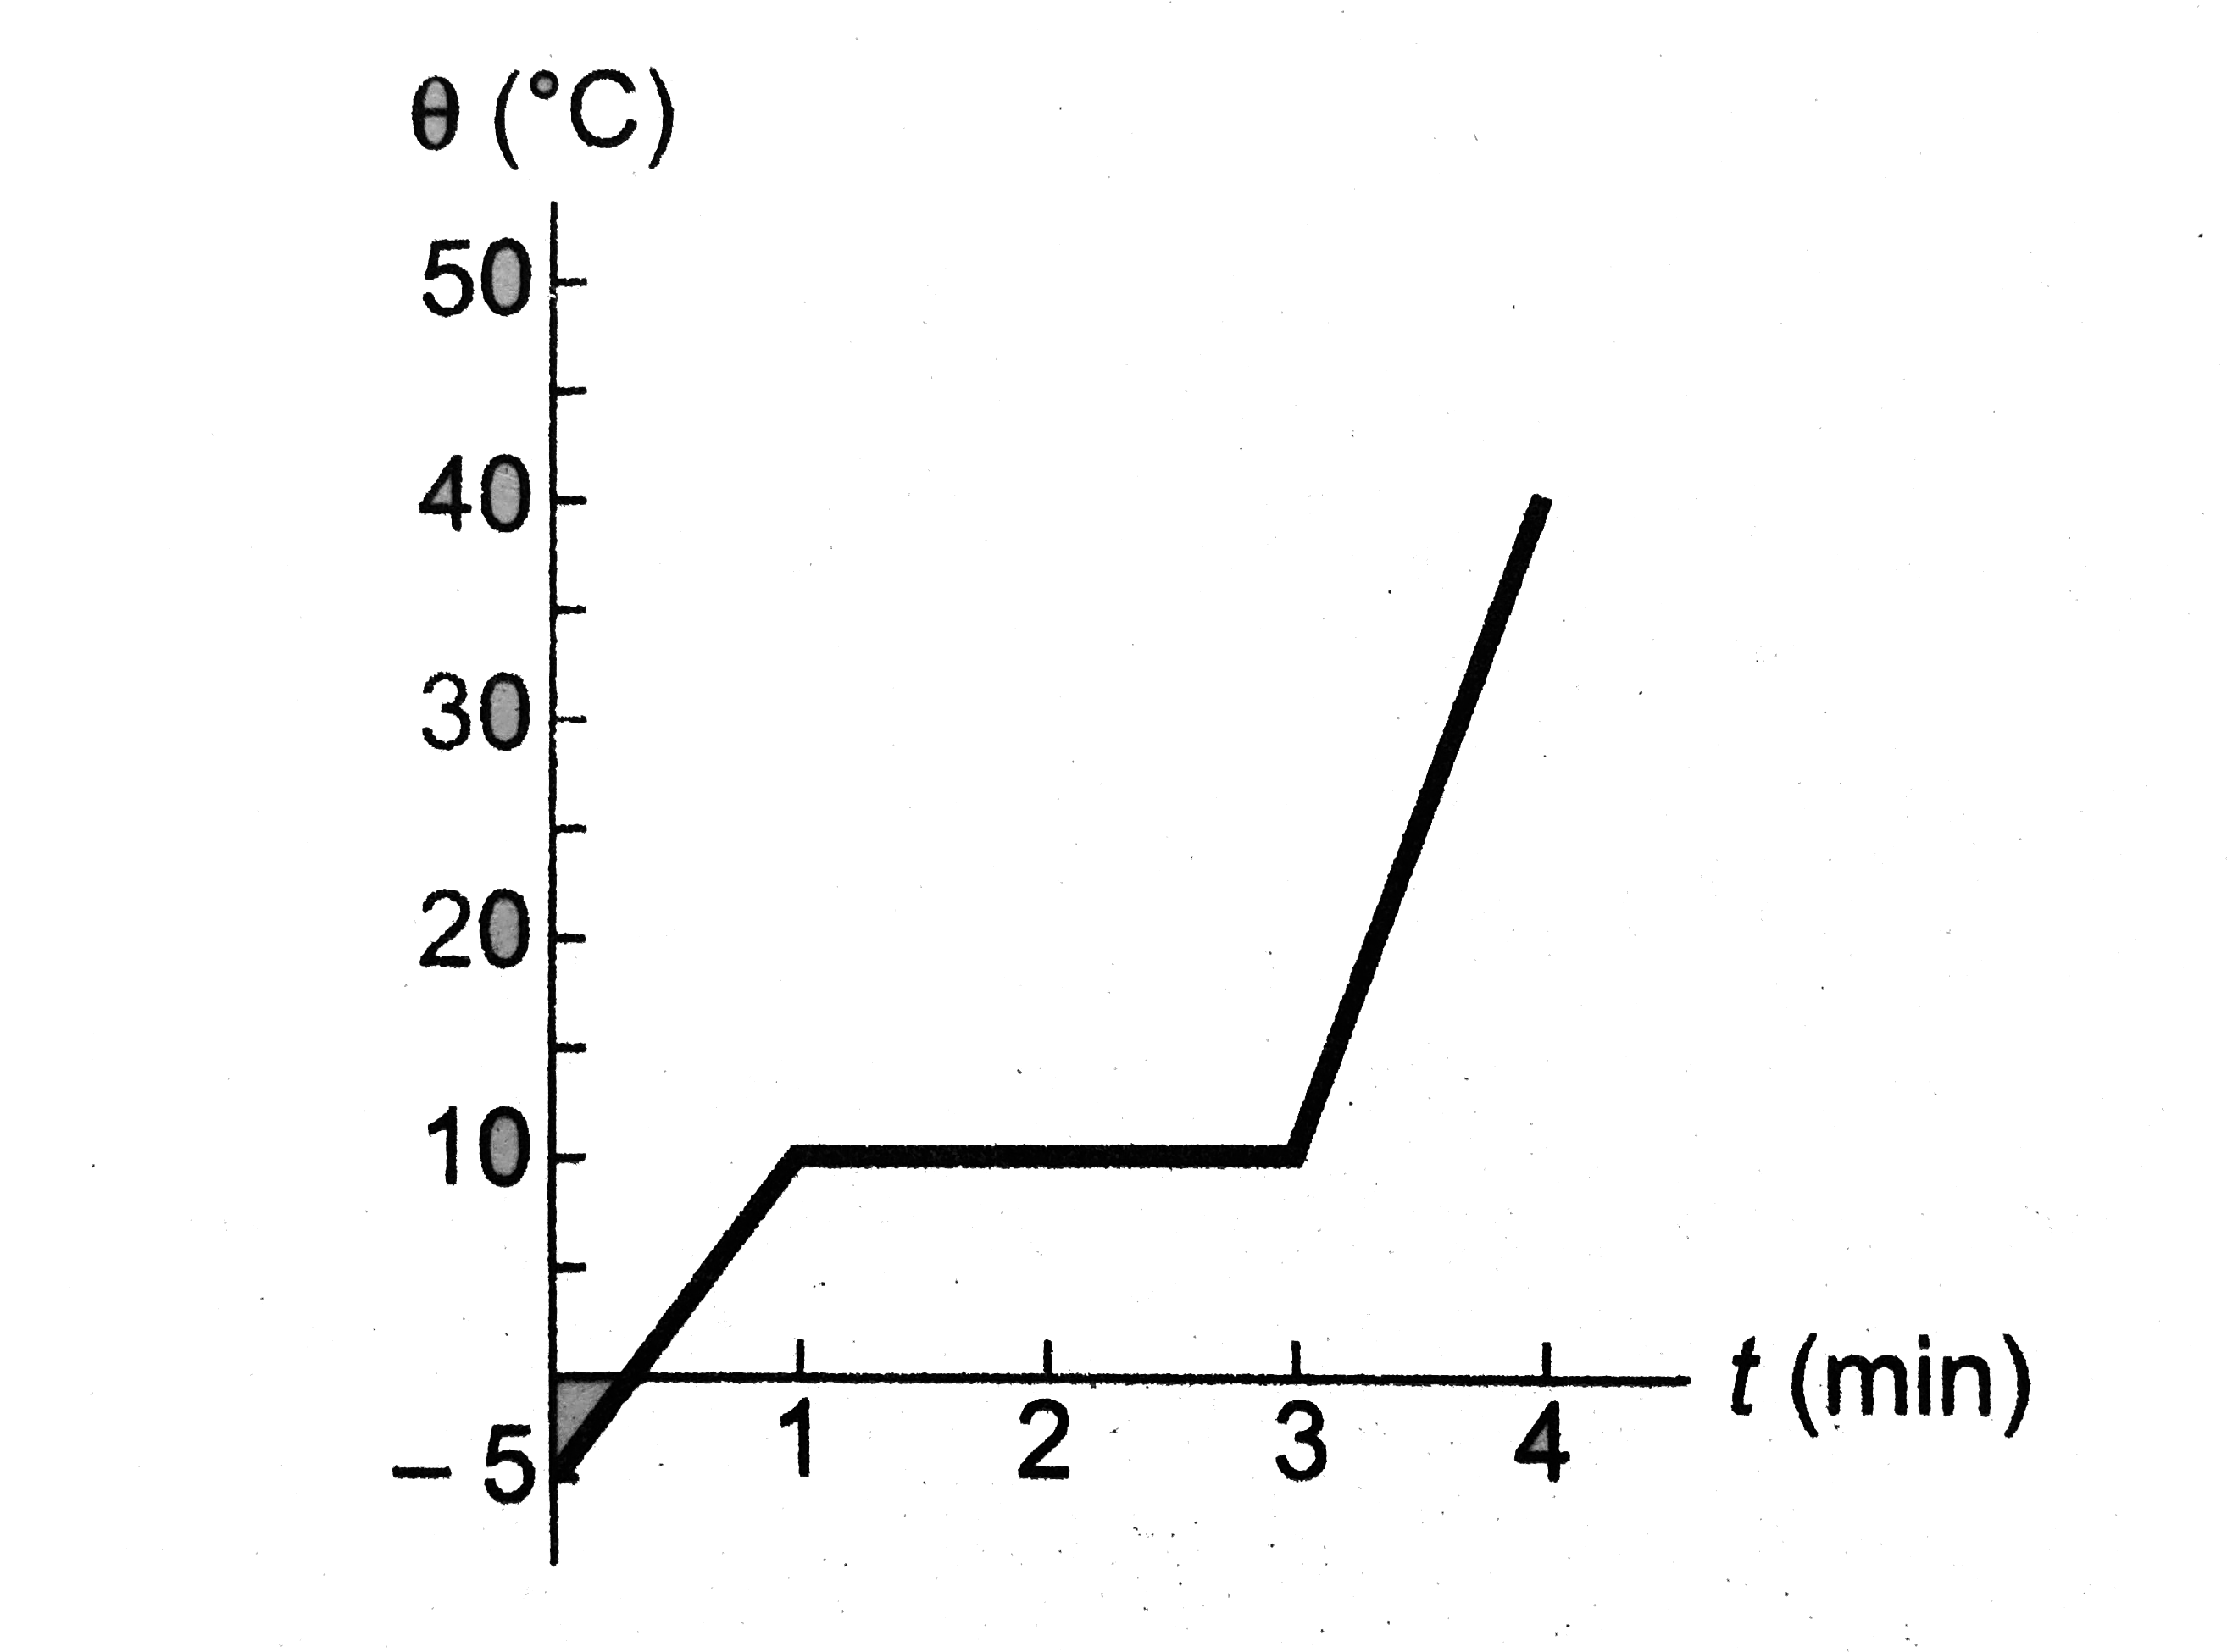
View SolutionAs a physicist, you put heat into a 500 g solid sample at the rate of 10.0kJ/min, while recording its temperature as a function of time. You plot your data and obtain the graph shown in figure.
 .
.
(a) What is the latent heat of fusion for this solid?
(b) What is the specific heat of solid state of the material?
View SolutionA rod of weight w is supported by two parallel knife edges A and B and is in equilibrium in a horizontal position. The knives are at a distance d from each other. The centre of mass of the rod is at distance x from A. The normal reaction on A is.. And on B is......
View SolutionIf liquefied oxygen at 1 atmospheric pressure is heated from 50K to 300k by supplying heat at constant rate. The graph of temperature vs time will be
View SolutionLiquid oxygen at 50K is heated to 300K at constant pressure of 1atm. The rate of heating is constant. Which of the following graphs represents the variation of temperature with time?
View Solution50 K ताप पर द्रव ऑक्सीजन को 300 K तक एक वायुमंडलीय स्थिर दाब पर गर्म किया जाता है | यदि गर्म करने की दर स्थिर हो , तो निम्न में से कौन - सा ग्राफ समय के साथ ताप परिवर्तन प्रदर्शित करता है -
View Solution1 वायुमण्डल के स्थिर दाब पर द्रव्य ऑक्सीजन (Liquid oxygen) का ताप 50 केल्विन से बढ़ाकर 300 केल्विन कर दिया जाता है | ऊष्मा की दर नियत है | निम्न में से कौन - सा वक्र ताप का समय के साथ सही परिवर्तन दर्शाता है ?
View SolutionLiquid oxygen at 50K is heated to 300K at constant pressure of 1atm. The rate of heating is constant. Which of the following graphs represents the variation of temperature with time?
View SolutionLiquid oxygen at 50 K is heated to 300 K at constant pressure of 1 atm. The rate of heating is constant. Which of the following graphs represents the variation of temperature with time ?
View SolutionIf liquefied oxygen at 1 atmospheric pressure is heated from 50K to 300k by supplying heat at constant rate. The graph of temperature vs time will be
View SolutionLiquid oxygen at 50 K is heated to 300 K at constant pressure of 1 atm. The rate of heating is constant. Which of the following graphs represent the variation of temperature with time ?
View SolutionLiquid oxygen at 50 K is heated to 300 K at constant pressure of 1 atm. The rate of heating is constant. Which of the following graphs represent the variation of temperature with time?
View SolutionLiquid oxygen at 50 K is heated to 300 K at constant pressure of 1 atm. The rate of heatingis constant. Which of the following graph represent the variation of temperature with time ?
View SolutionIf liquefied oxygen at 1 atmospheric pressure is heated from 50K to 300k by supplying heat at constant rate. The graph of temperature vs time will be
View SolutionThe difference of heat of reaction at constant pressure and at constant volume for combustion of 2 mol of liquid benzene at 300 K
View Solution

