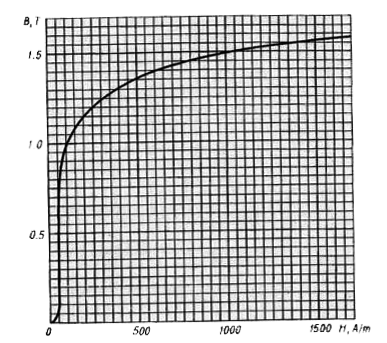
The initial magnetization curve of technically pure iron is shown in Fig. 29.9a. Making use of the graph find the magnetic permeabilities of this material at magnetic fields strength of: 50 N/m: 75 A/m, 100 A/m: 200 Alm: 500 A/m: 1000 N/m, 1500 A/m.
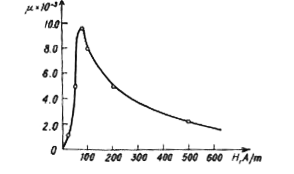
Plot the graph of the dependence of the magnetic permeabilily on the magnetic field. Making use of the graph estimate the field at which the magnetic permeability is at its maximum (μmex), and the approximate value of the latter.

Text Solution
From the graph 29.92a we compile the table 
The graph for μ is given in Fig. 29.9. 
|
Similar Questions
Knowledge Check
If m is magnetic moment and B is the magnetic field, then the torque is given by
A→m.→BB|→m|∣∣→B∣∣C→m×→BD|→m|.∣∣→B∣∣The magnetic field is made radial in a M.C.G.
Ato make field strongerBto make field weakerCto make scale linearDto reduce its resistanceThe work done in rotating a magnet of magnetic moment 2A−m2 in a magnetic field to opposite direction to the magnetic field, is
AZeroB2×10−2JC10−2JD10J
Magnetic Field on the Axis OF a Ring || Examples on Magnetic Field Due to Straight Wire || Graph OF Magnetic Field Due to a Ring
View SolutionAn iron specimen has relative permeability of 600 when placed in uniform magnetic field of intensity 110amp/m. Then the magnetic flux density inside is……tesls.
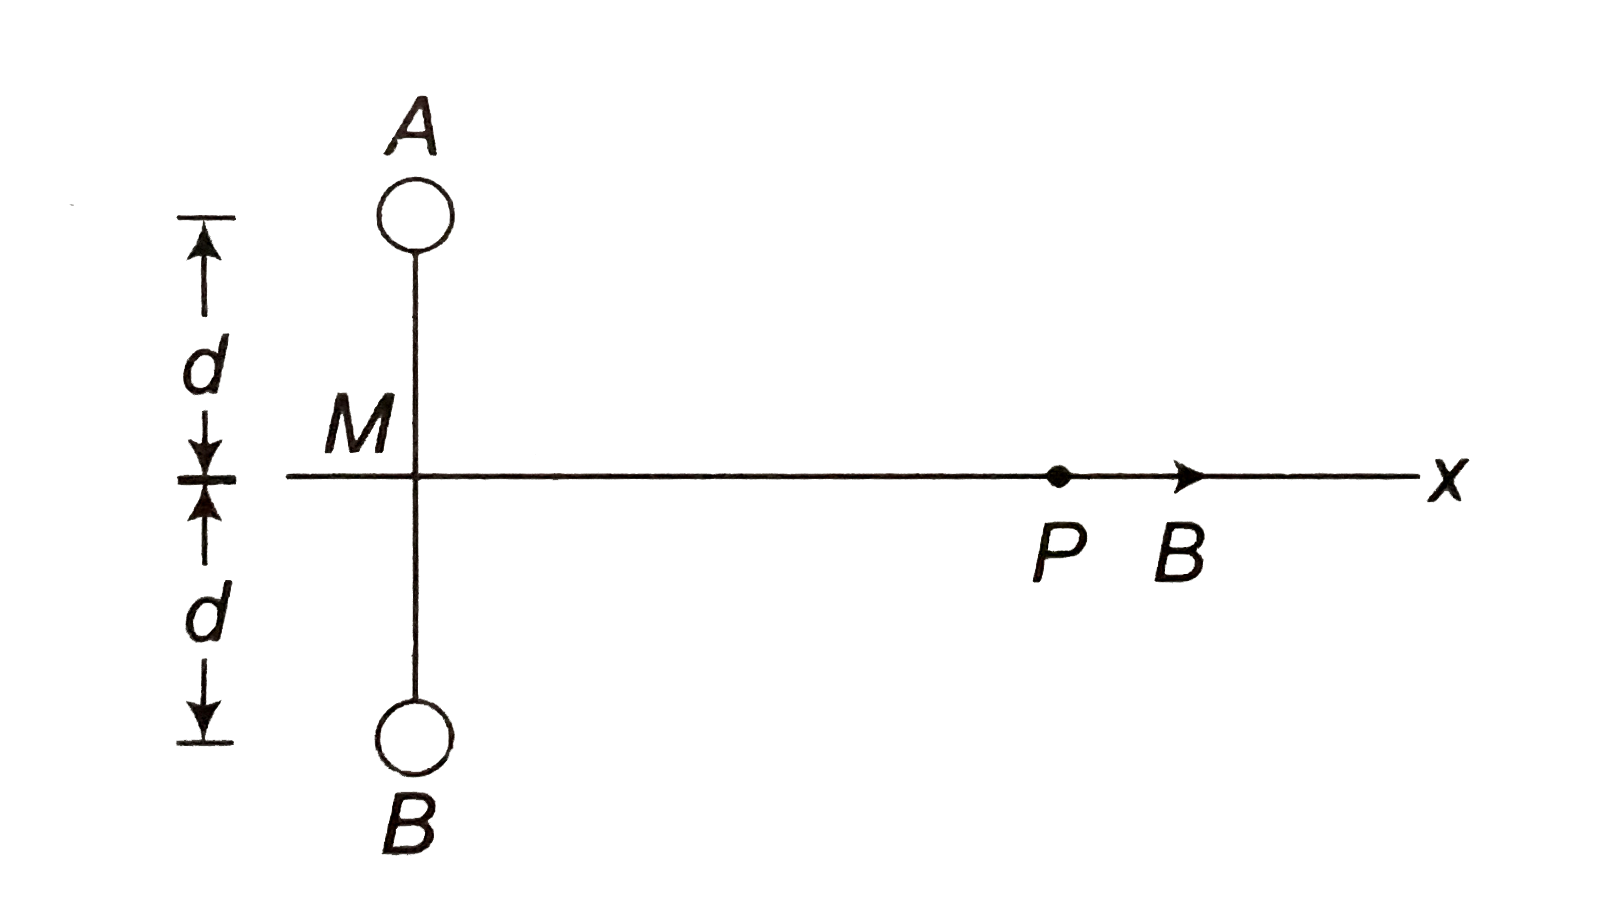
View SolutionDue to currents in infinite long wire at A and B, magnetic field is maximum at M and at P, magnetic field as shown. Then

View SolutionThe intensity of magnetic field is H and moment of magnet is M. The maximum potential energy is
View SolutionMagnetic moment of bar magnet is M. The work done to turn the magnet by 90∘ of magnet in direction of magnetic field B will be
View Solution

