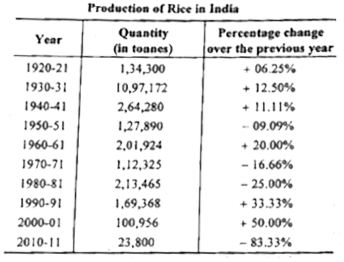
Solve the following questions on the basis of given data in the following table :

Out of the given years which year has shown least increase (in amount) over the previous year :
1940-41
1960-61
1920-21
2000-01
The correct Answer is:C
Step by step video & text solution for Solve the following questions on the basis of given data in the following table : Out of the given years which year has shown least increase (in amount) over the previous year : by Maths experts to help you in doubts & scoring excellent marks in Class 14 exams.
Updated on:21/07/2023Topper's Solved these Questions
Similar Questions
Multiply 387 by 5 i.e, 387×5.
View SolutionFind the value of 9P3
View SolutionFollowing information is available for the year 2016-17, calculate gross profit ratio:
View SolutionFrom the following data, using weighted average method, calculate the cost of living index for the year 2006, taking 2002 as the base year.
ltimg src="https://d10lpgp6xz60nq.cloudfront.net/physics_images/PS_MATH_IX_C18_E03_005_Q01.png" width="80%"gt
View SolutionWhich of the following are correct chain isomers of butane ? (i)
View SolutionDetermine the point of symmetry of a regular hexagon.
View SolutionDtermine the images of the following figure about the given line :
View SolutionMatch the following Column A to Column B

View SolutionMatch the following Column A to Column B

View SolutionMatch the following Column A to Column B

View SolutionFind the perimeter of the figure given below.

View SolutionFind the area of the figure given below.

View SolutionCalculate the volume of the given solid.
ltimg src="https://d10lpgp6xz60nq.cloudfront.net/physics_images/PS_MATH_VII_C06_E03_002_Q01.png" width="80%"gt
View SolutionThe area of the shaded part in the figure given below is ______.

View SolutionThe inequation represented by the graph given below is :
View SolutionThe inequation that best describes the graph given below is _________
View Solution