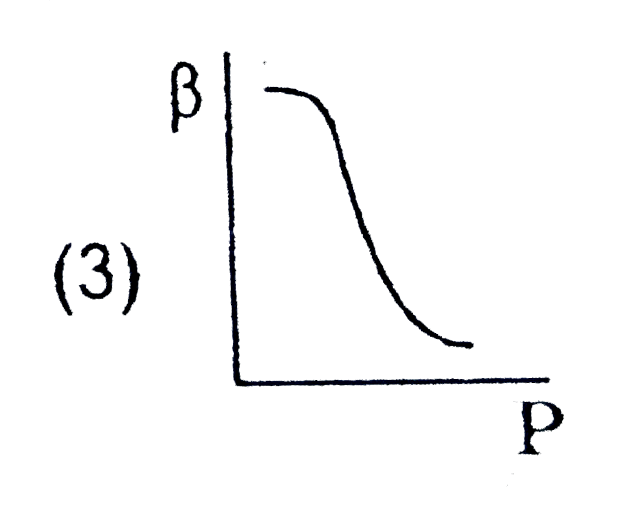
Which of the following graphs correctly represents the variation of β=−(dVdP)/V with P for an ideal gas at constant temperature
A

B

C
D
None of these
Video Solution
Text Solution
The correct Answer is:A
From PV=Rt,dV.P+V.dP=0
or (dVdP)=−VP
or β=(−dVdP)T/V=12
Thus plot of β vs P given (A)
|
Topper's Solved these Questions
- TEST PAPERSBook:RESONANCE ENGLISHChapter:TEST PAPERSExercise:PART - III CHEMISTRY SEC - 1
Explore 12 Videos
- TEST PAPERSBook:RESONANCE ENGLISHChapter:TEST PAPERSExercise:PART - III CHEMISTRY SEC - 2
Explore 18 Videos
- SURFACE CHEMISTRYBook:RESONANCE ENGLISHChapter:SURFACE CHEMISTRYExercise:Section - 5
Explore 1 Video
- TEST SERIESBook:RESONANCE ENGLISHChapter:TEST SERIESExercise:CHEMISTRY
Explore 50 Videos
Similar Questions
Knowledge Check
Which of the following graphs represent the behaviour of an ideal gas ?
A1.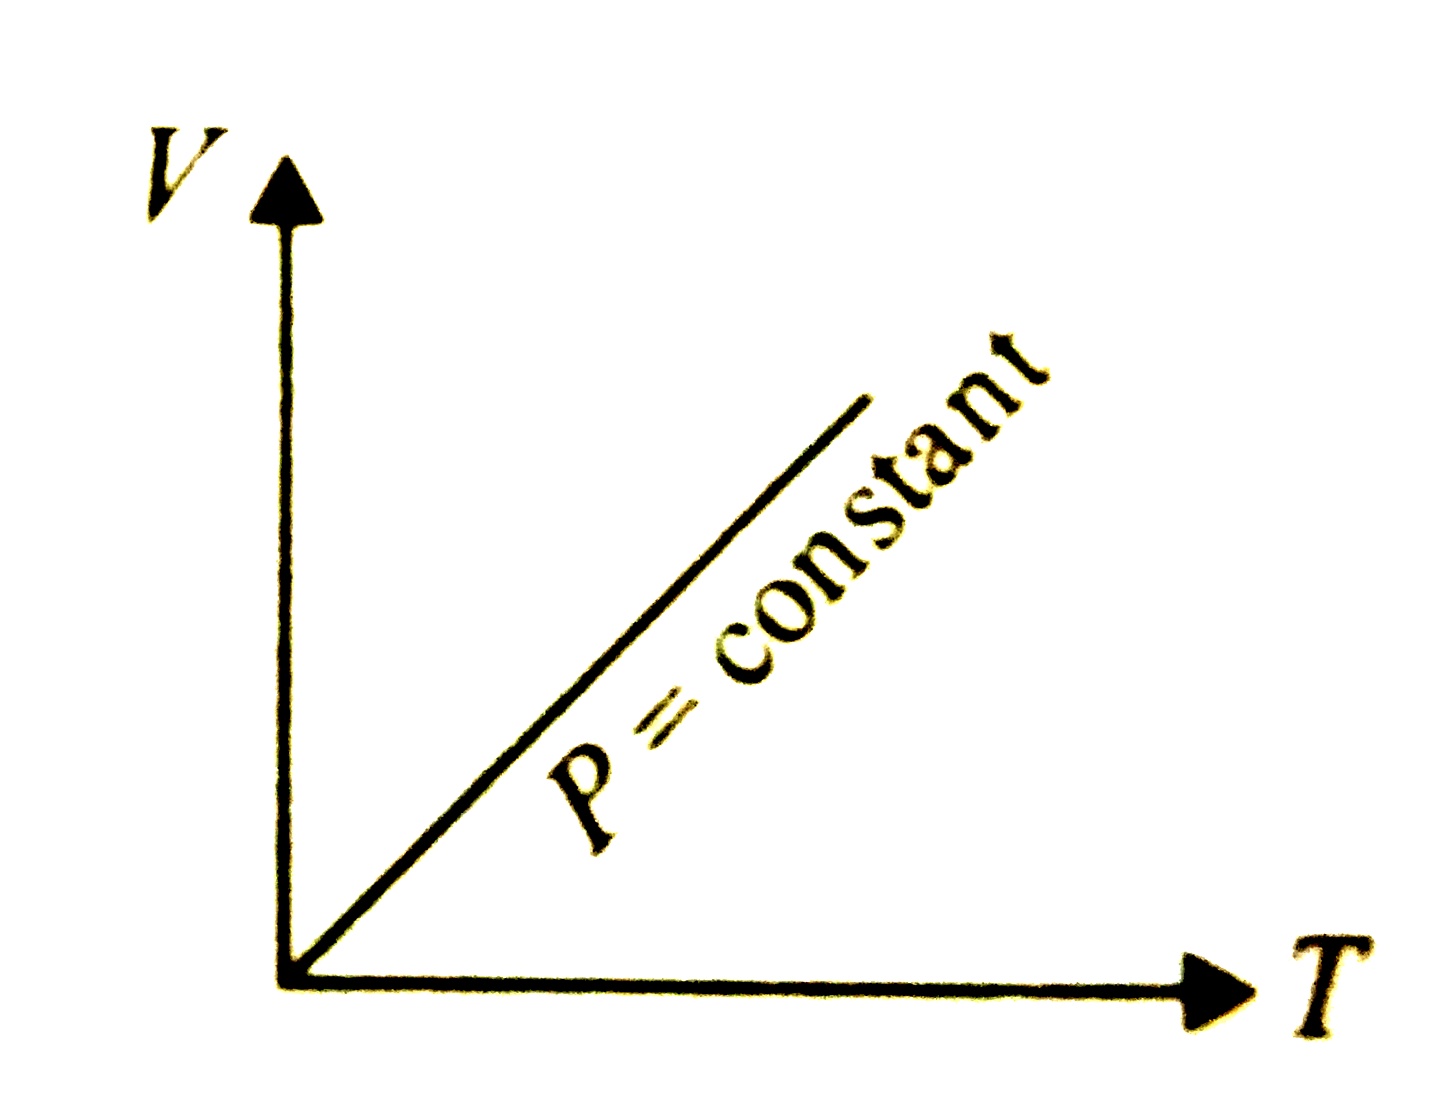 B2.
B2.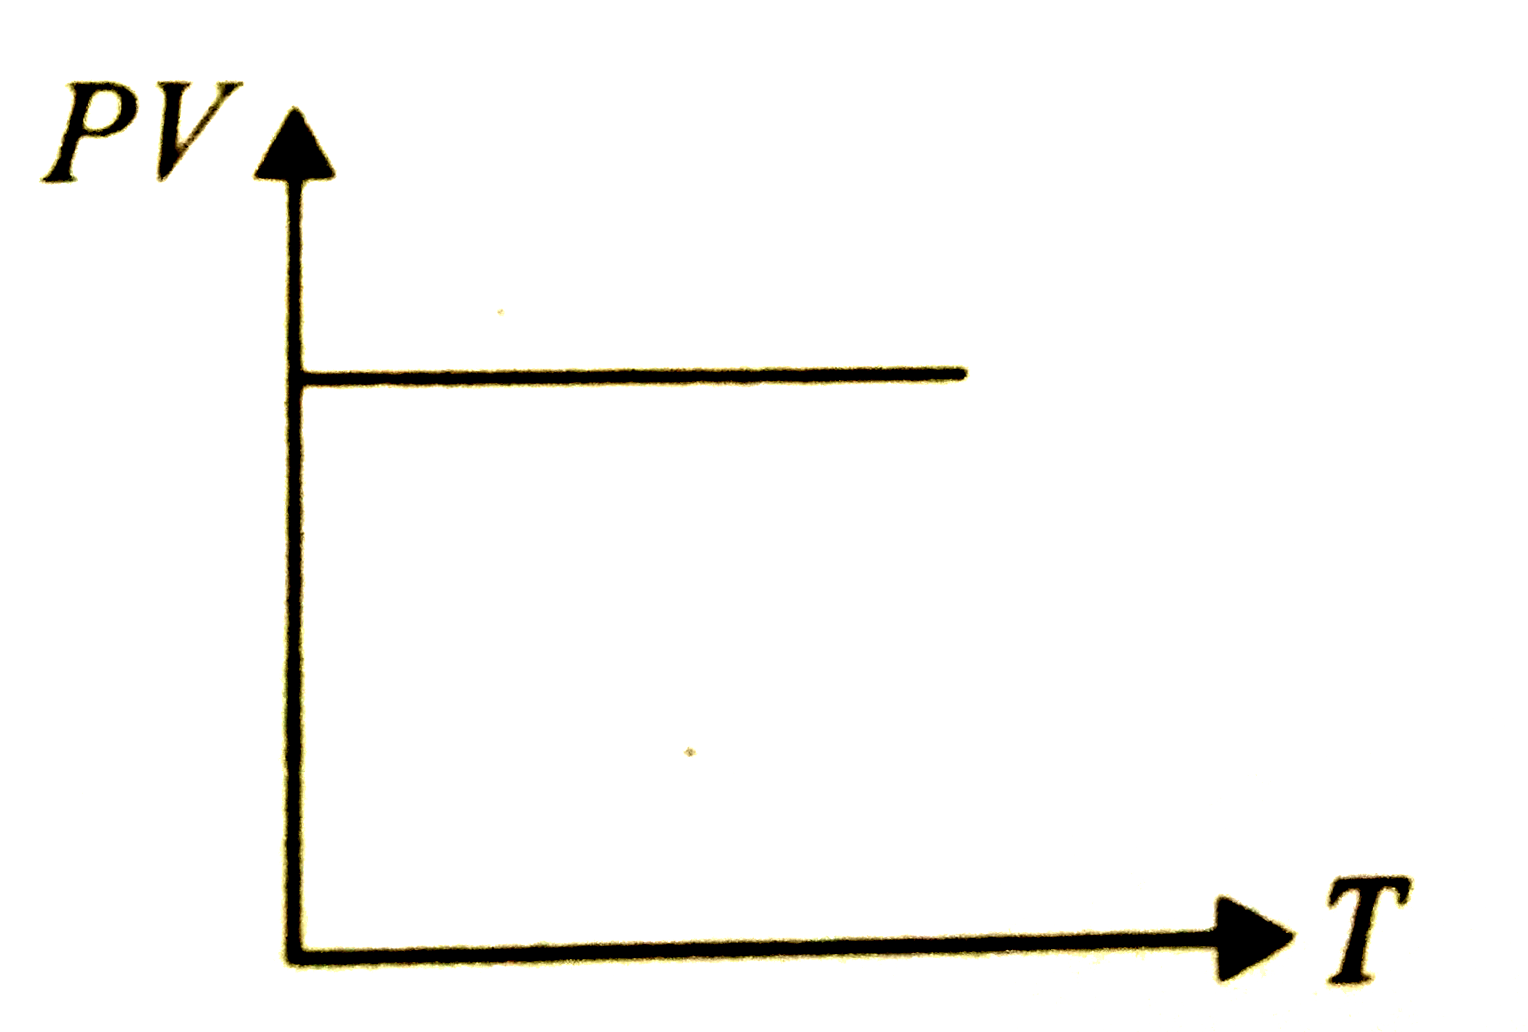 C3.
C3.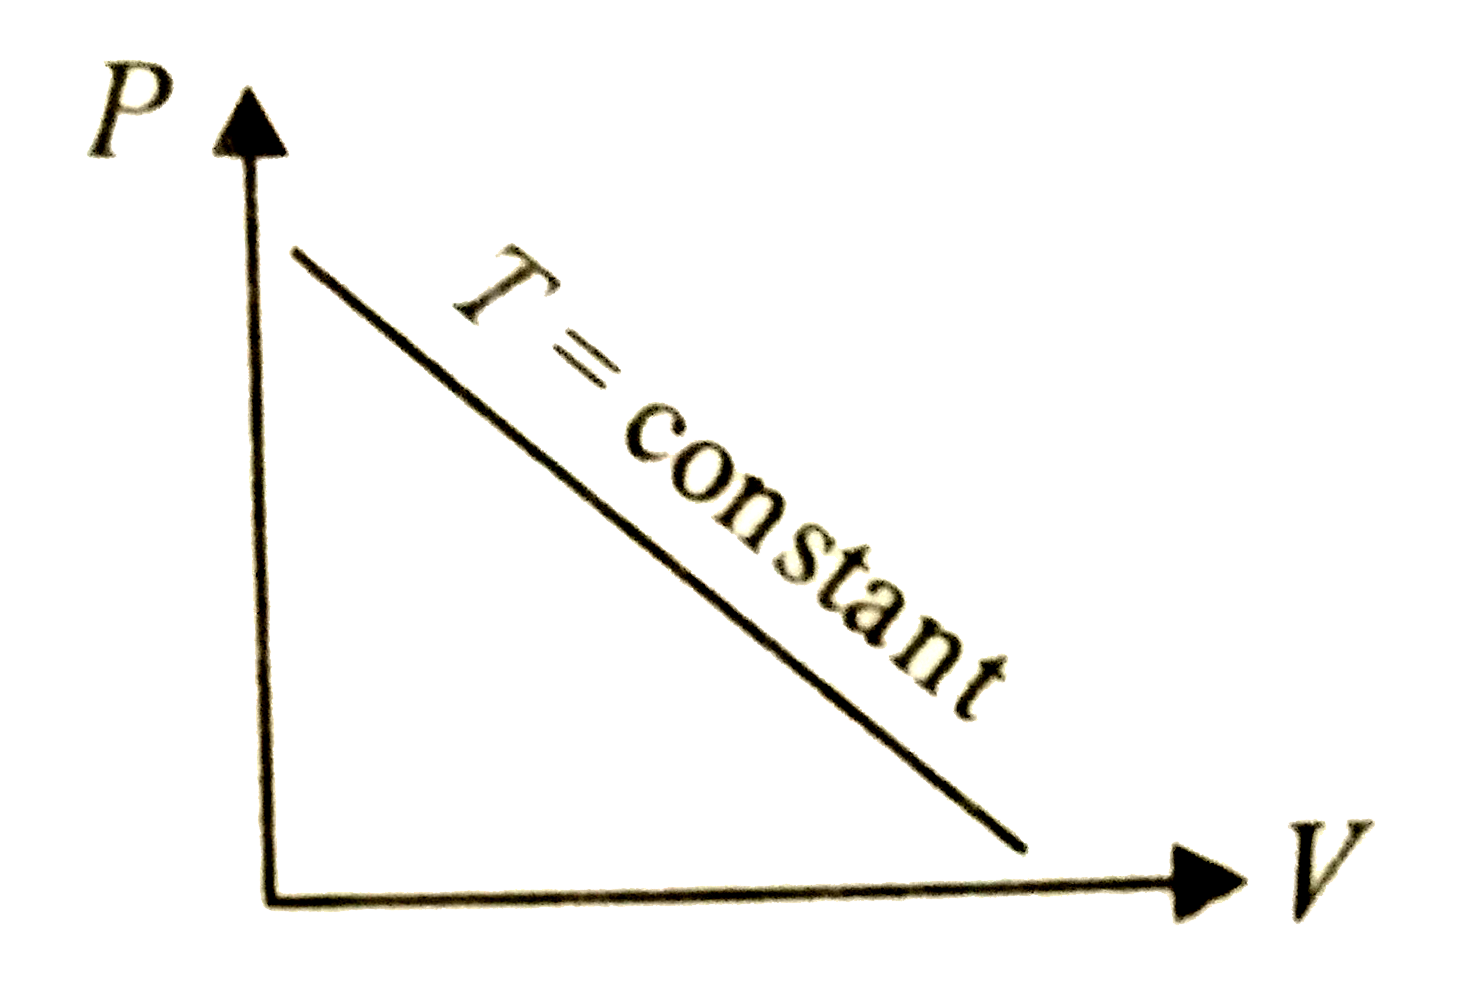 D4.
D4.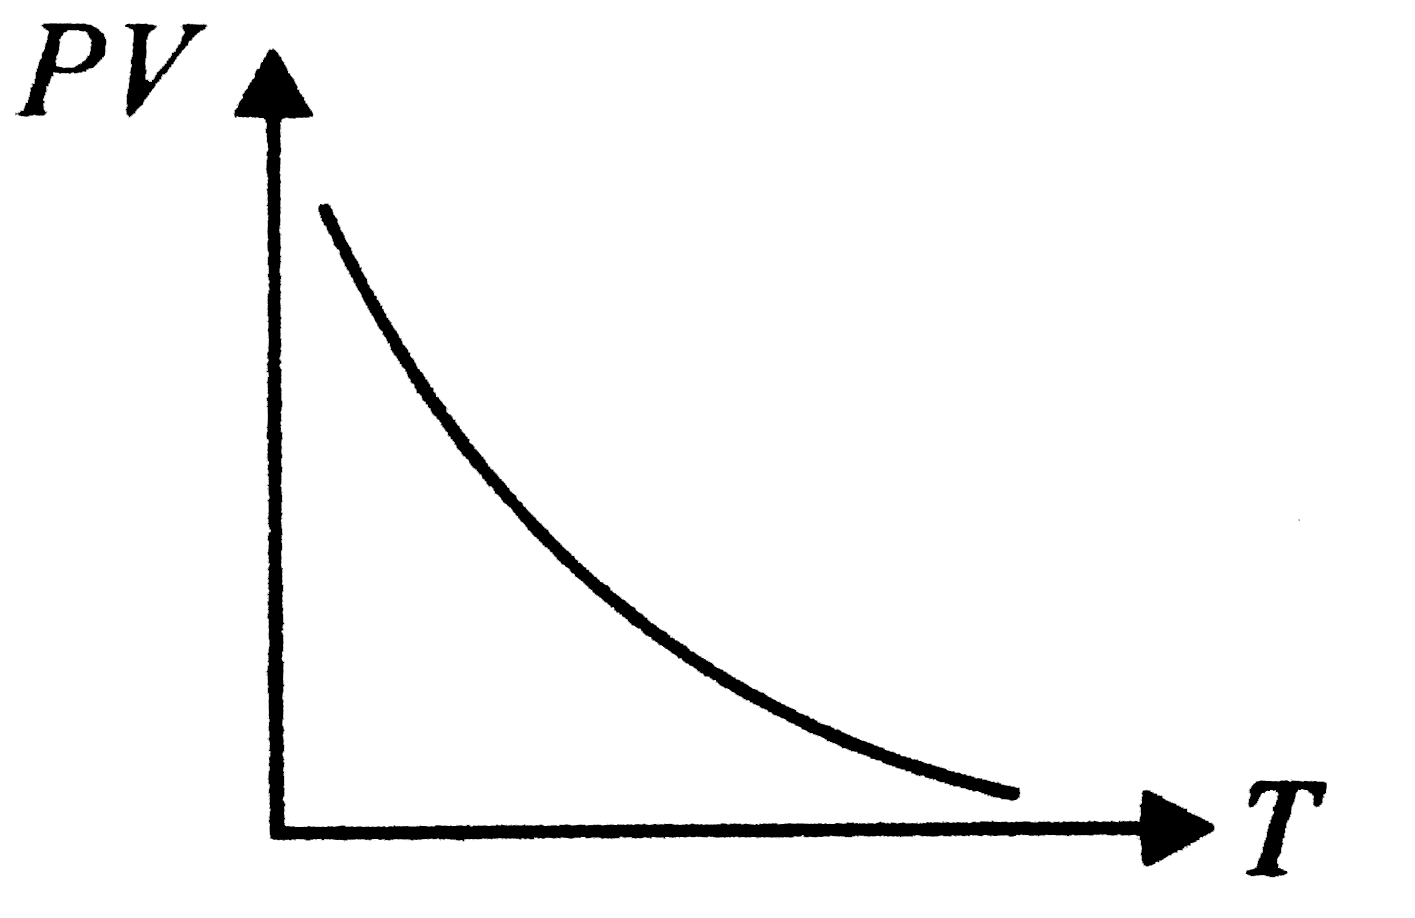
Within elastic limit, which of the following graphs correctly represents the variation of extension in the length of wire with the external load?
A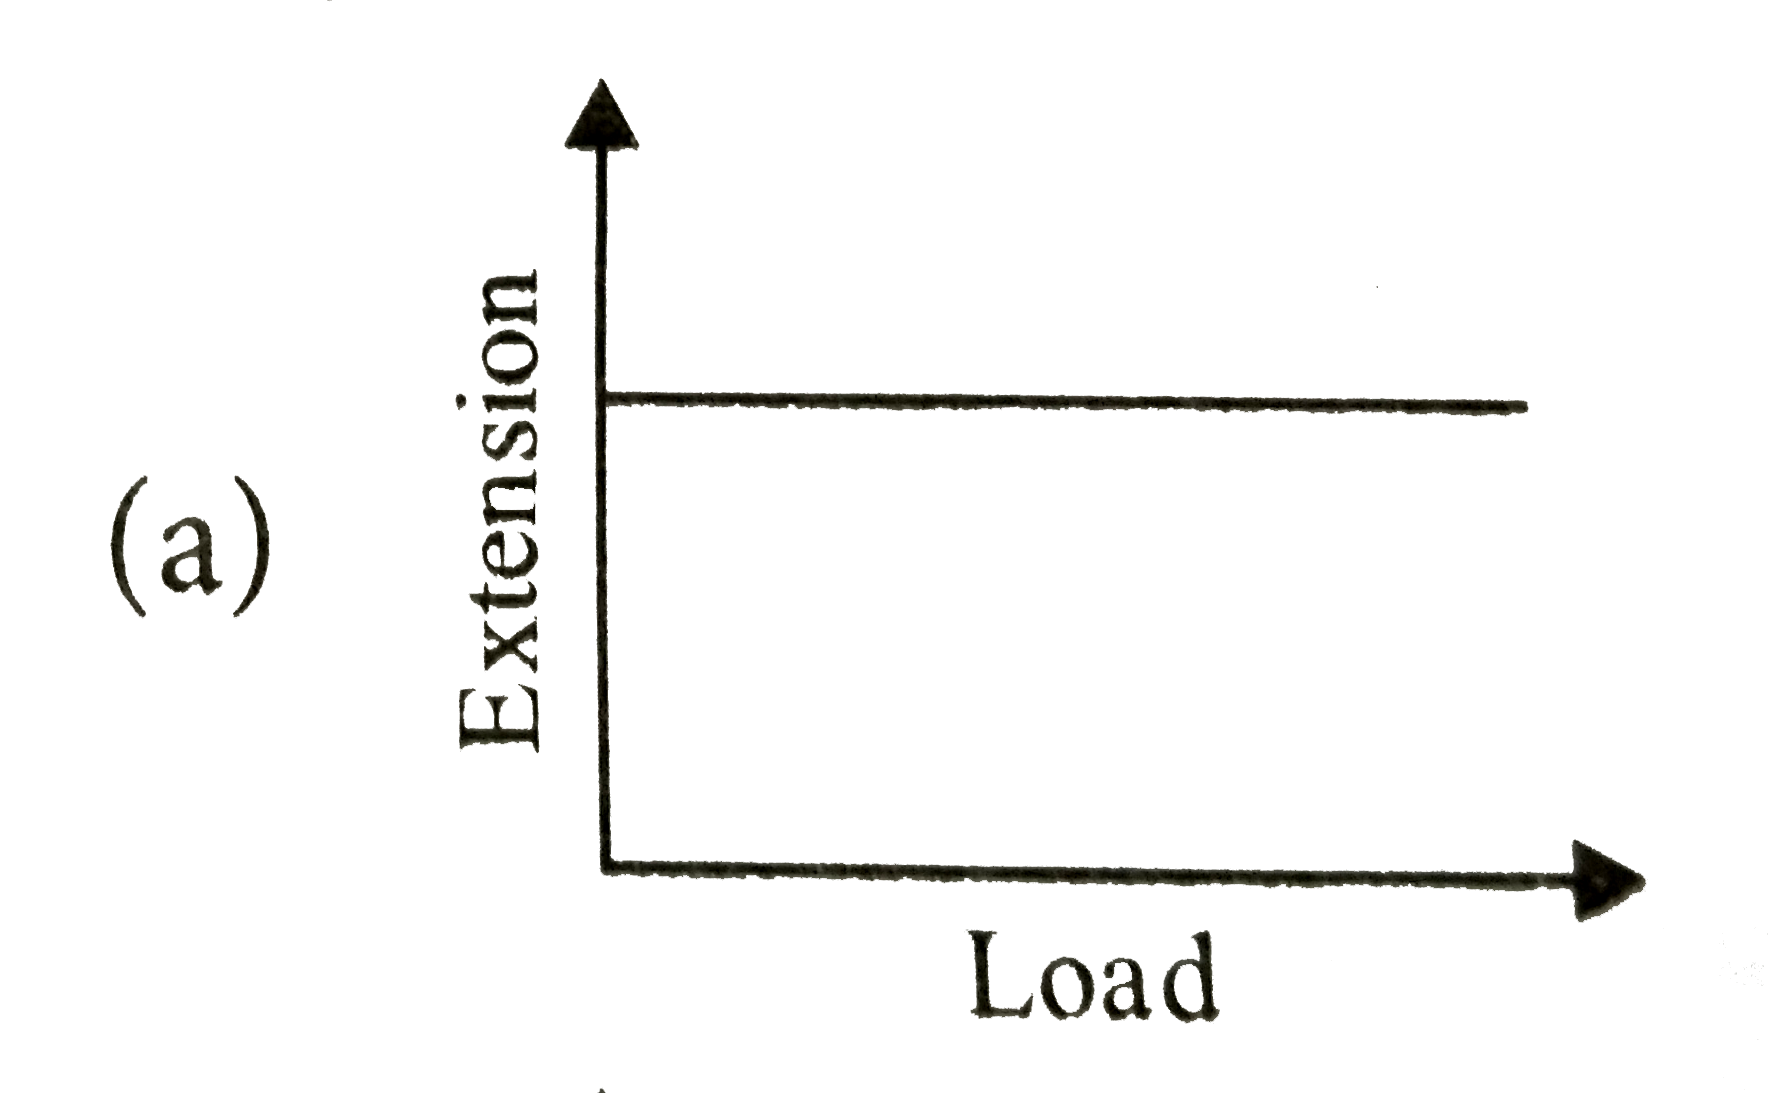 B
B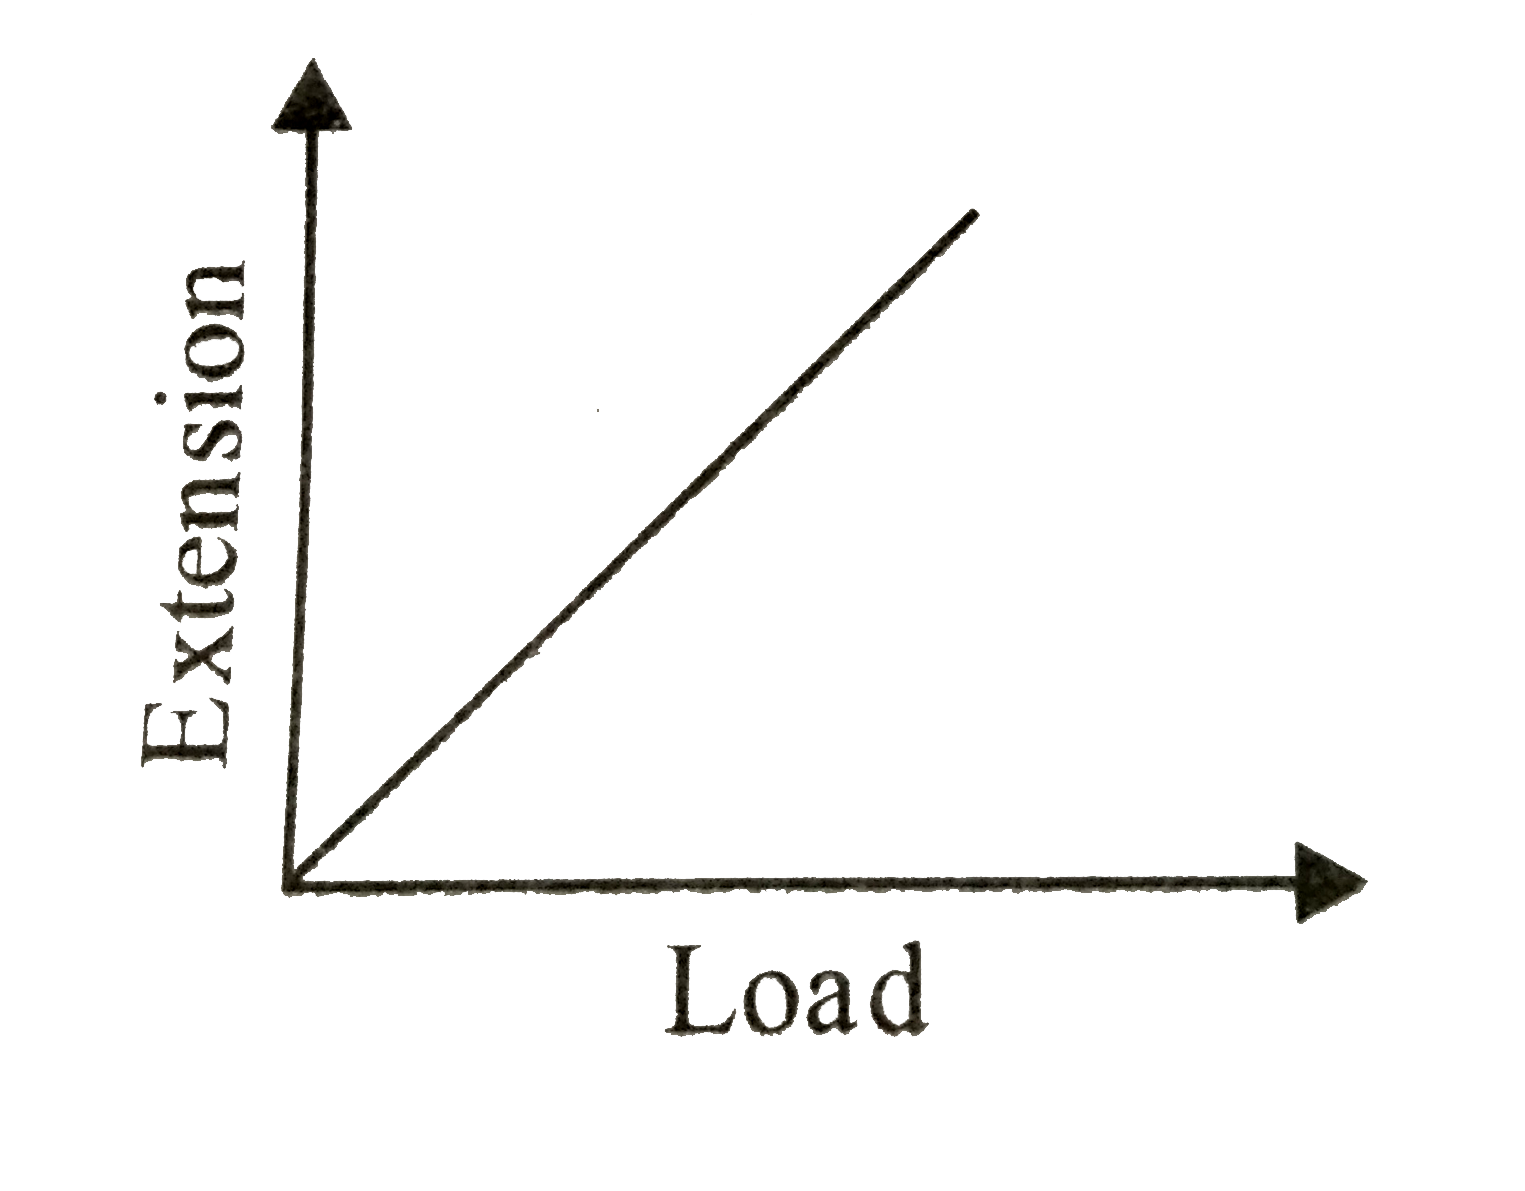 C
C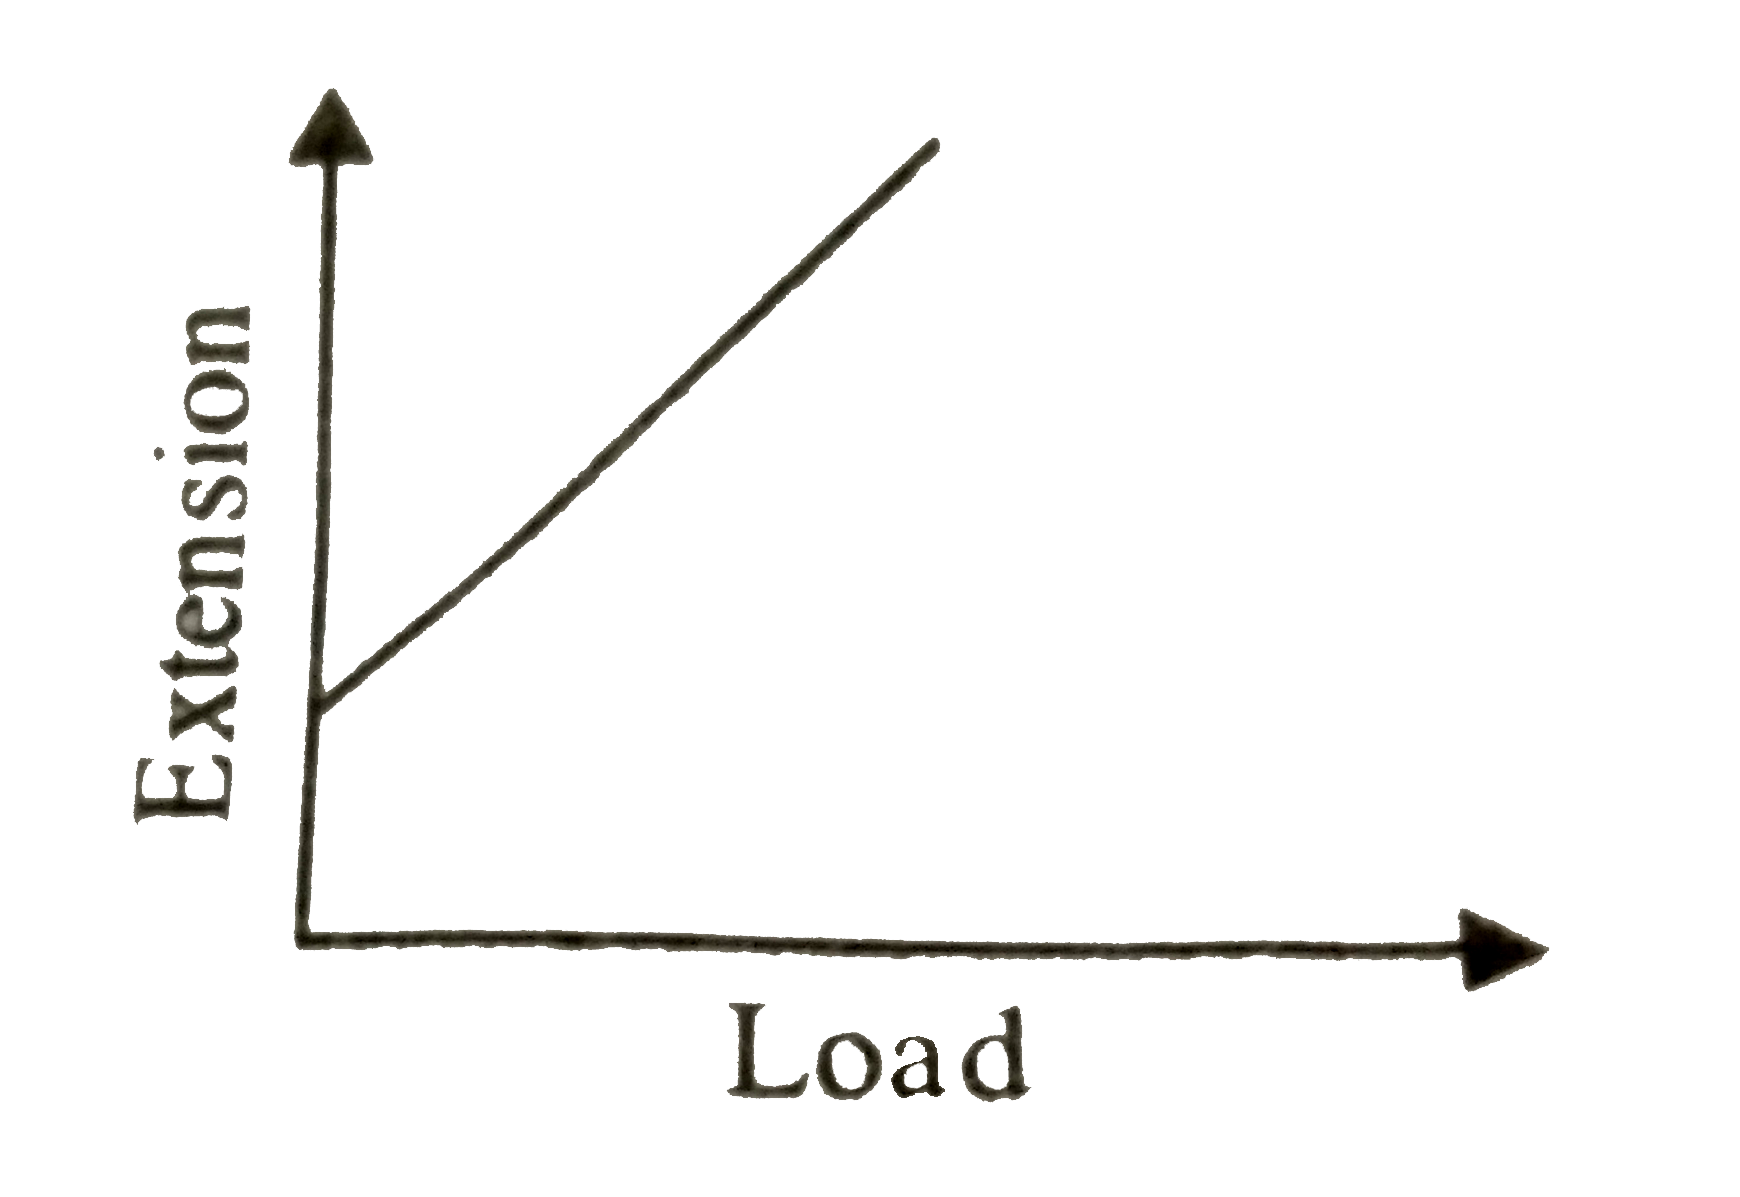 D
D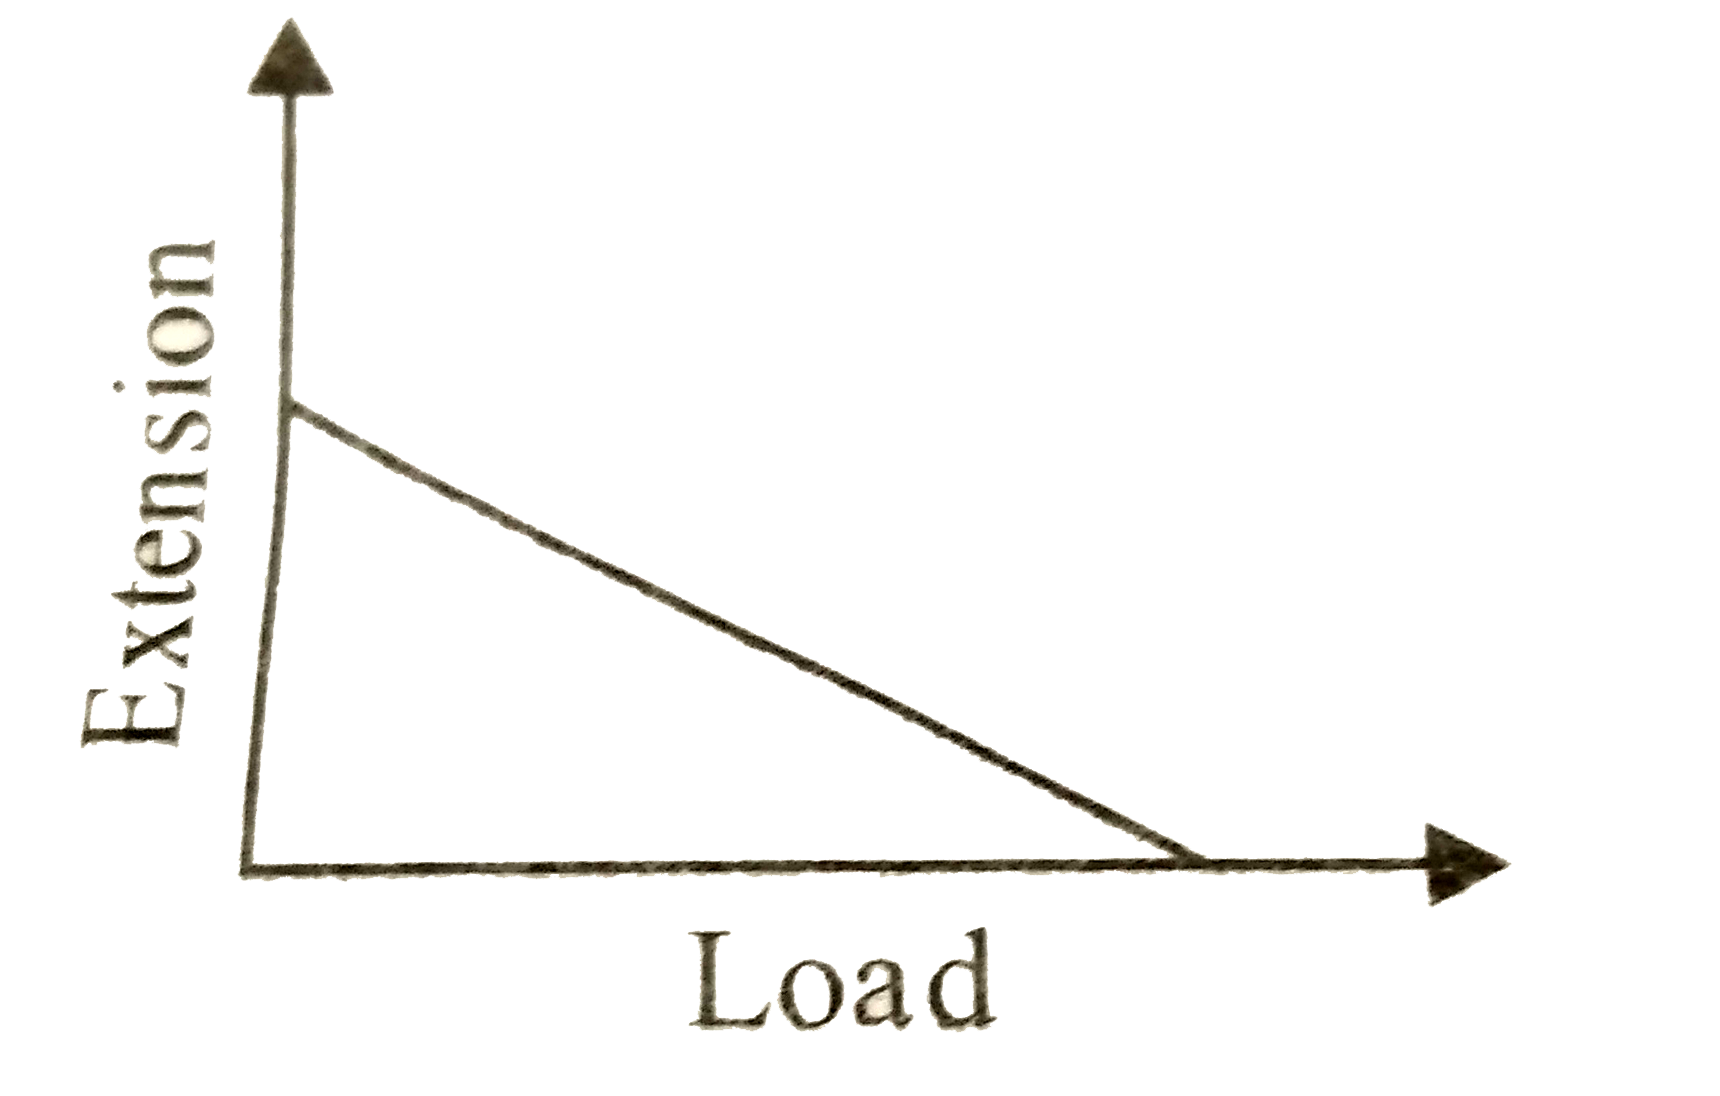
Which of the following P-V diagram represent the graph of isometric process?
A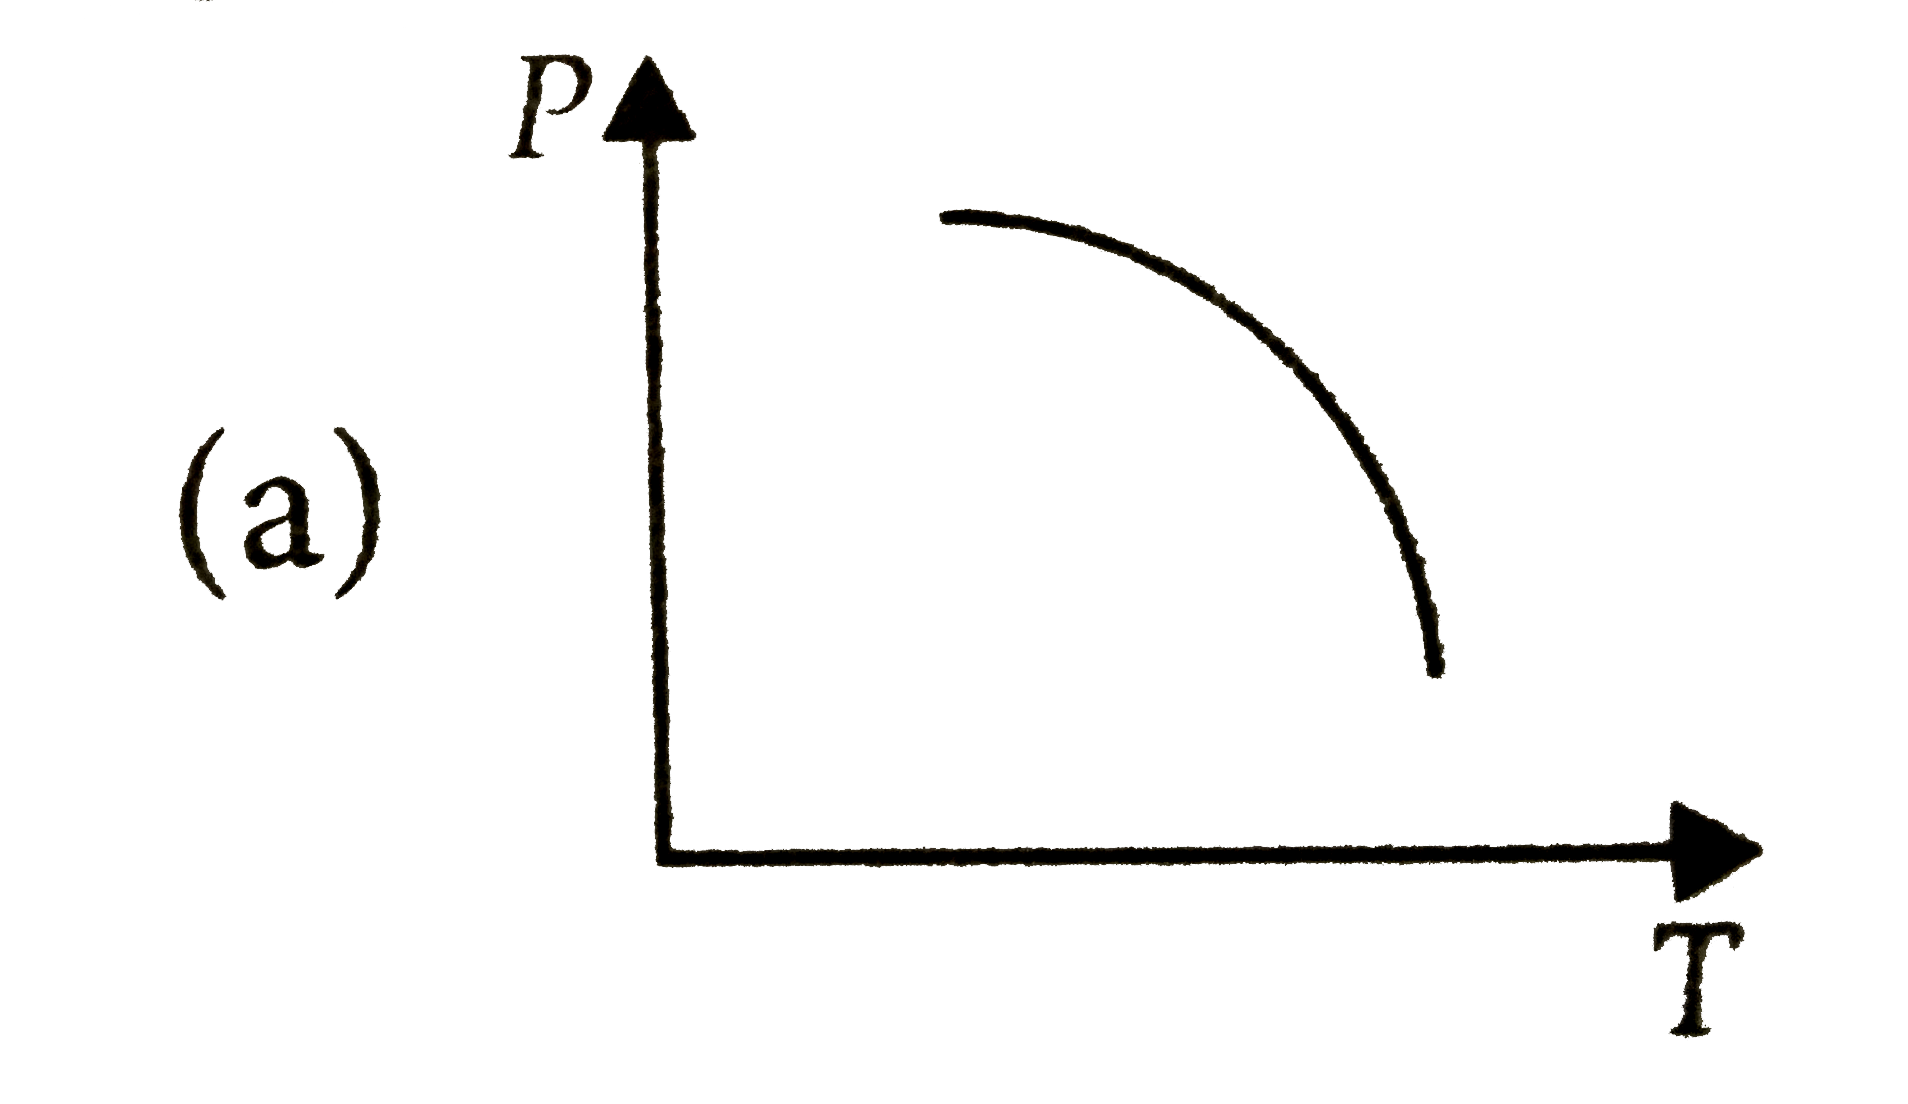 B
B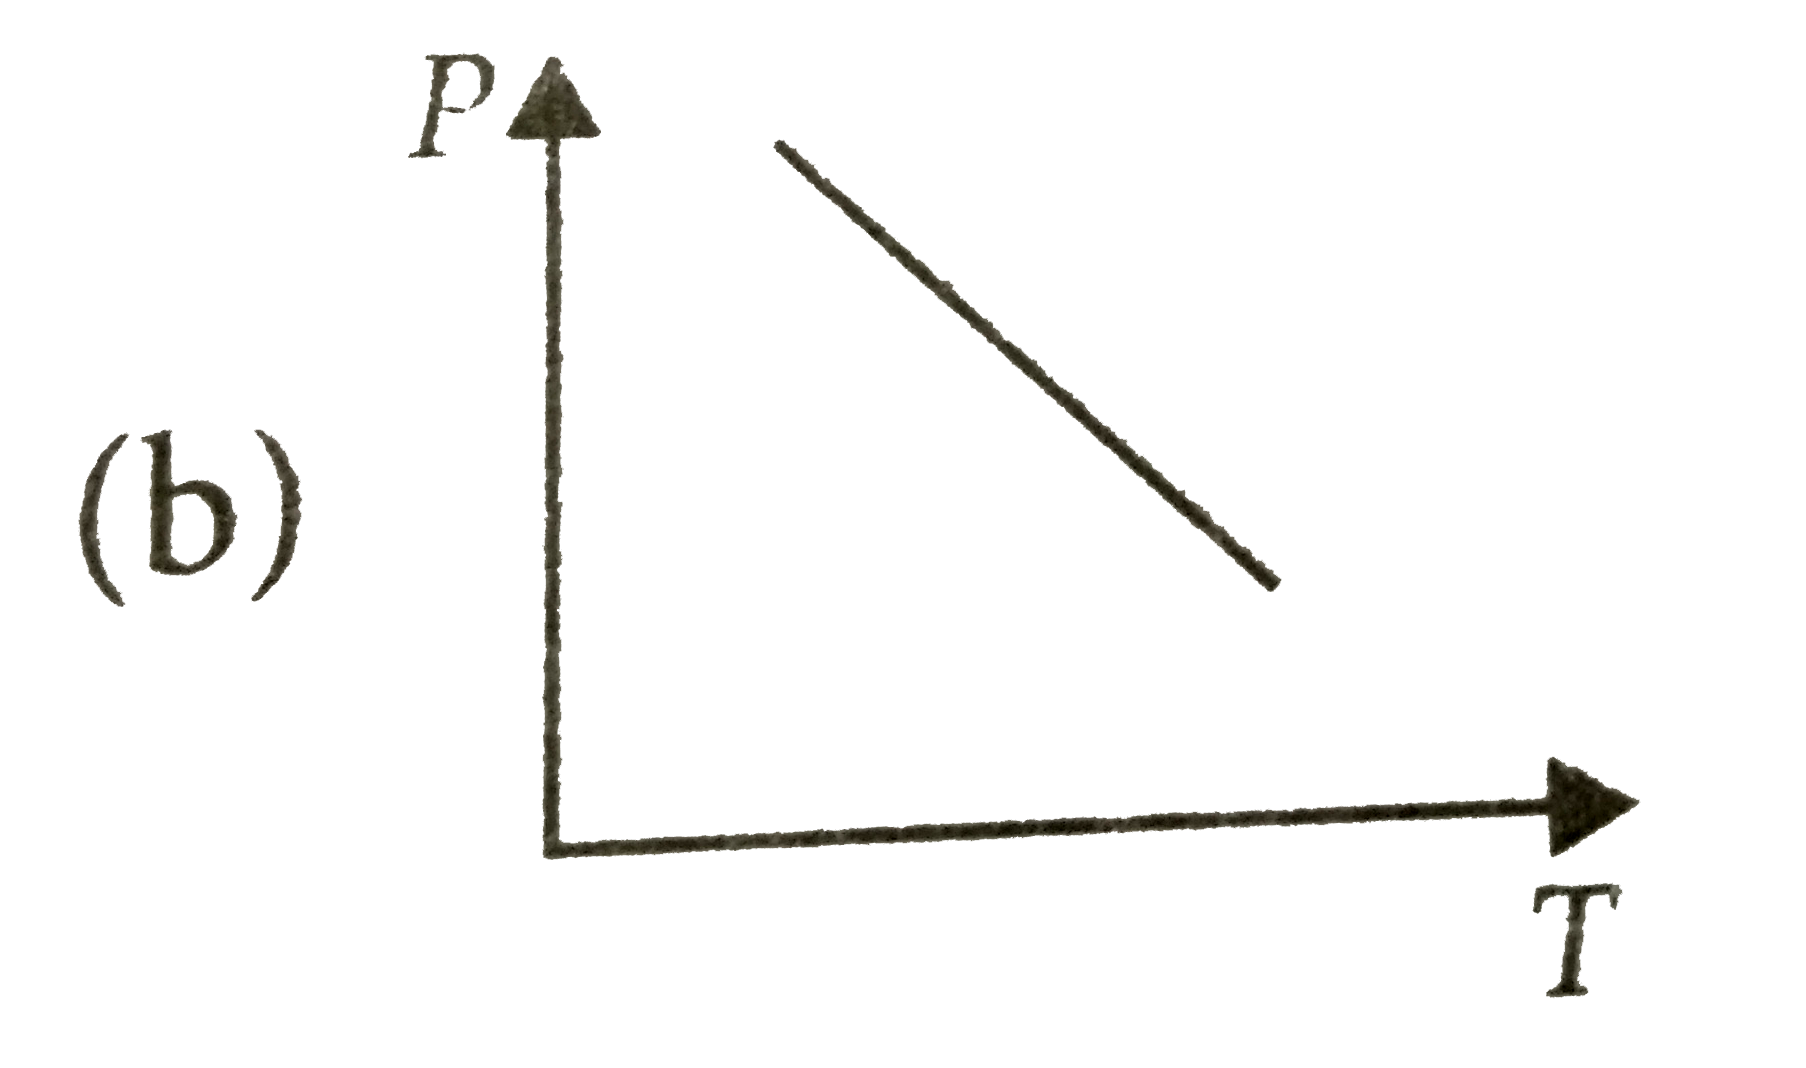 C
C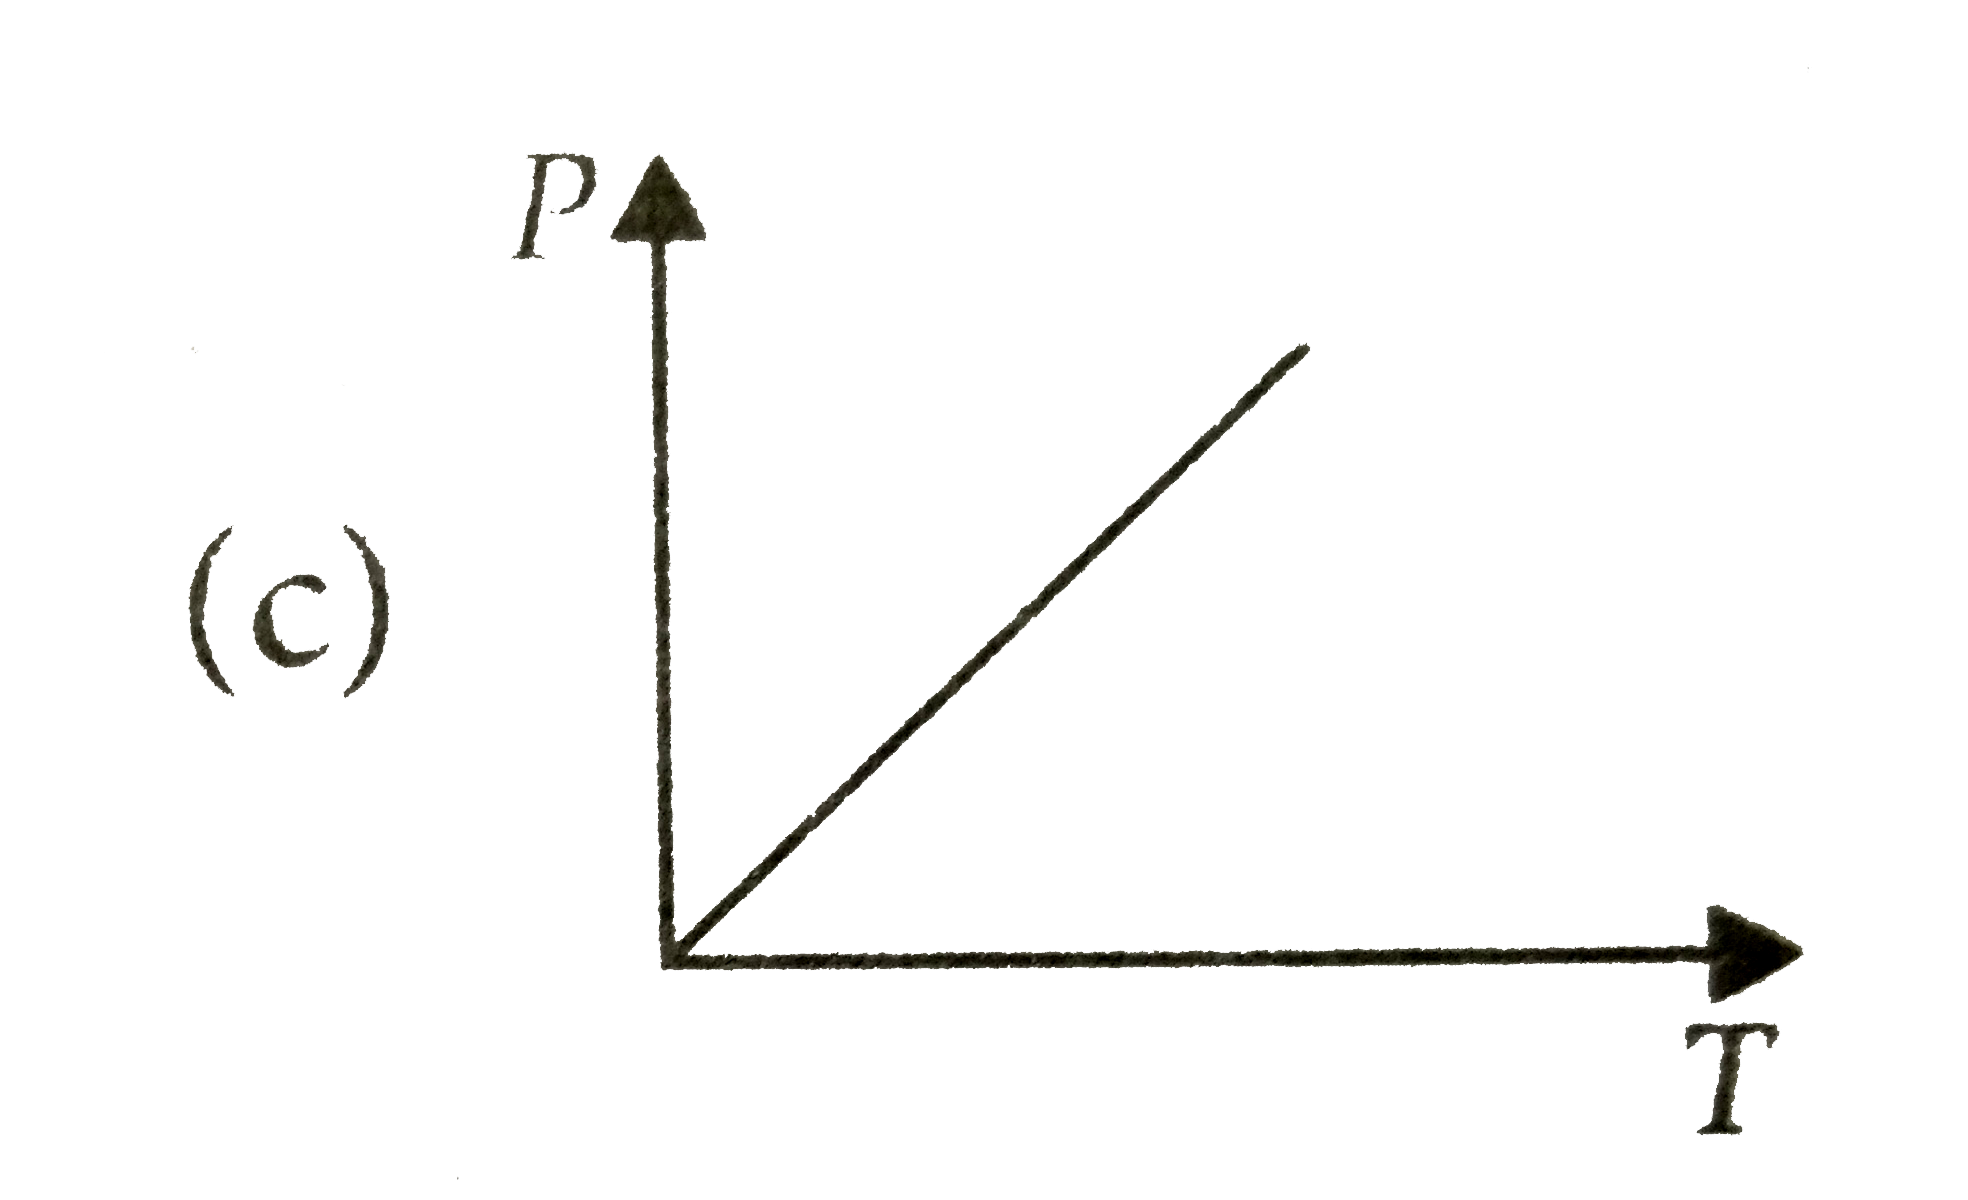 D
D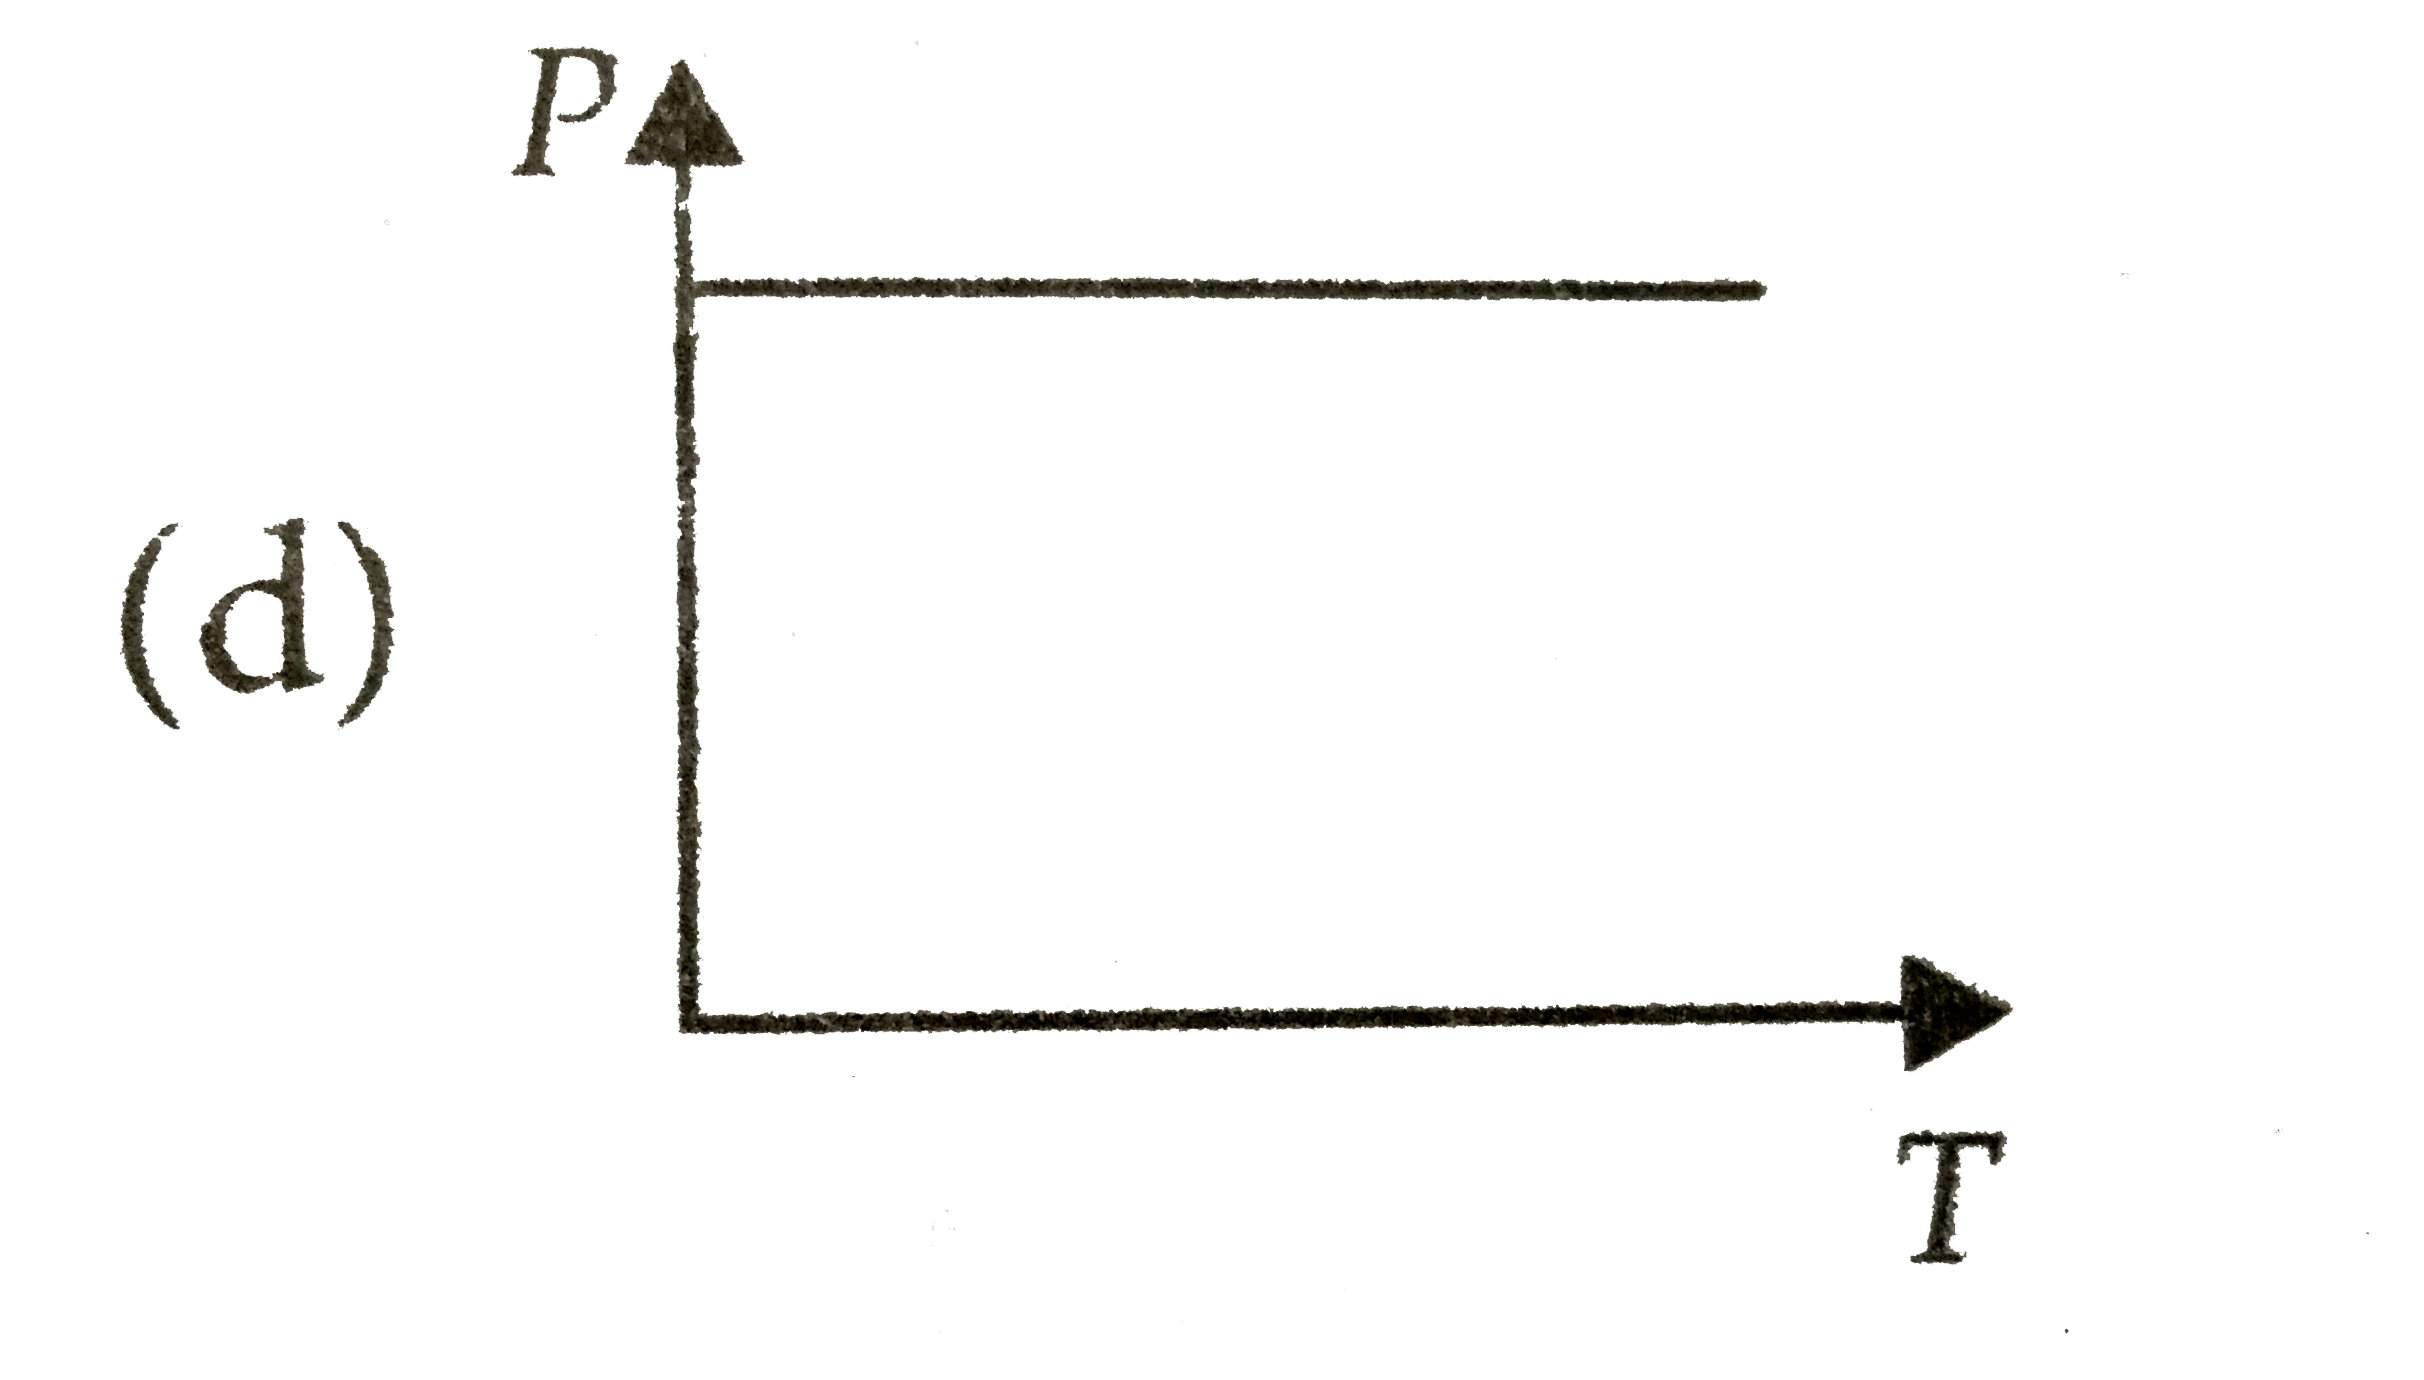
Which of the following diagram correctly represents the variation of internal energy (U) of gas under expansion at constant temperature.
View SolutionWhich of following graphs correctly represents the variation of particle momentum with de-Broglie wavelength?
View SolutionWhich of the following graph correctly represents the variation of molar conductance (Δm) with dilution for a strong electrolyte ?
View SolutionWhich of the following graph represents the variation of resistivity (ρ) with temperature (T) for copper?
View SolutionWhich of the following graphs is consistent with ideal gas behaviour?
View Solution

