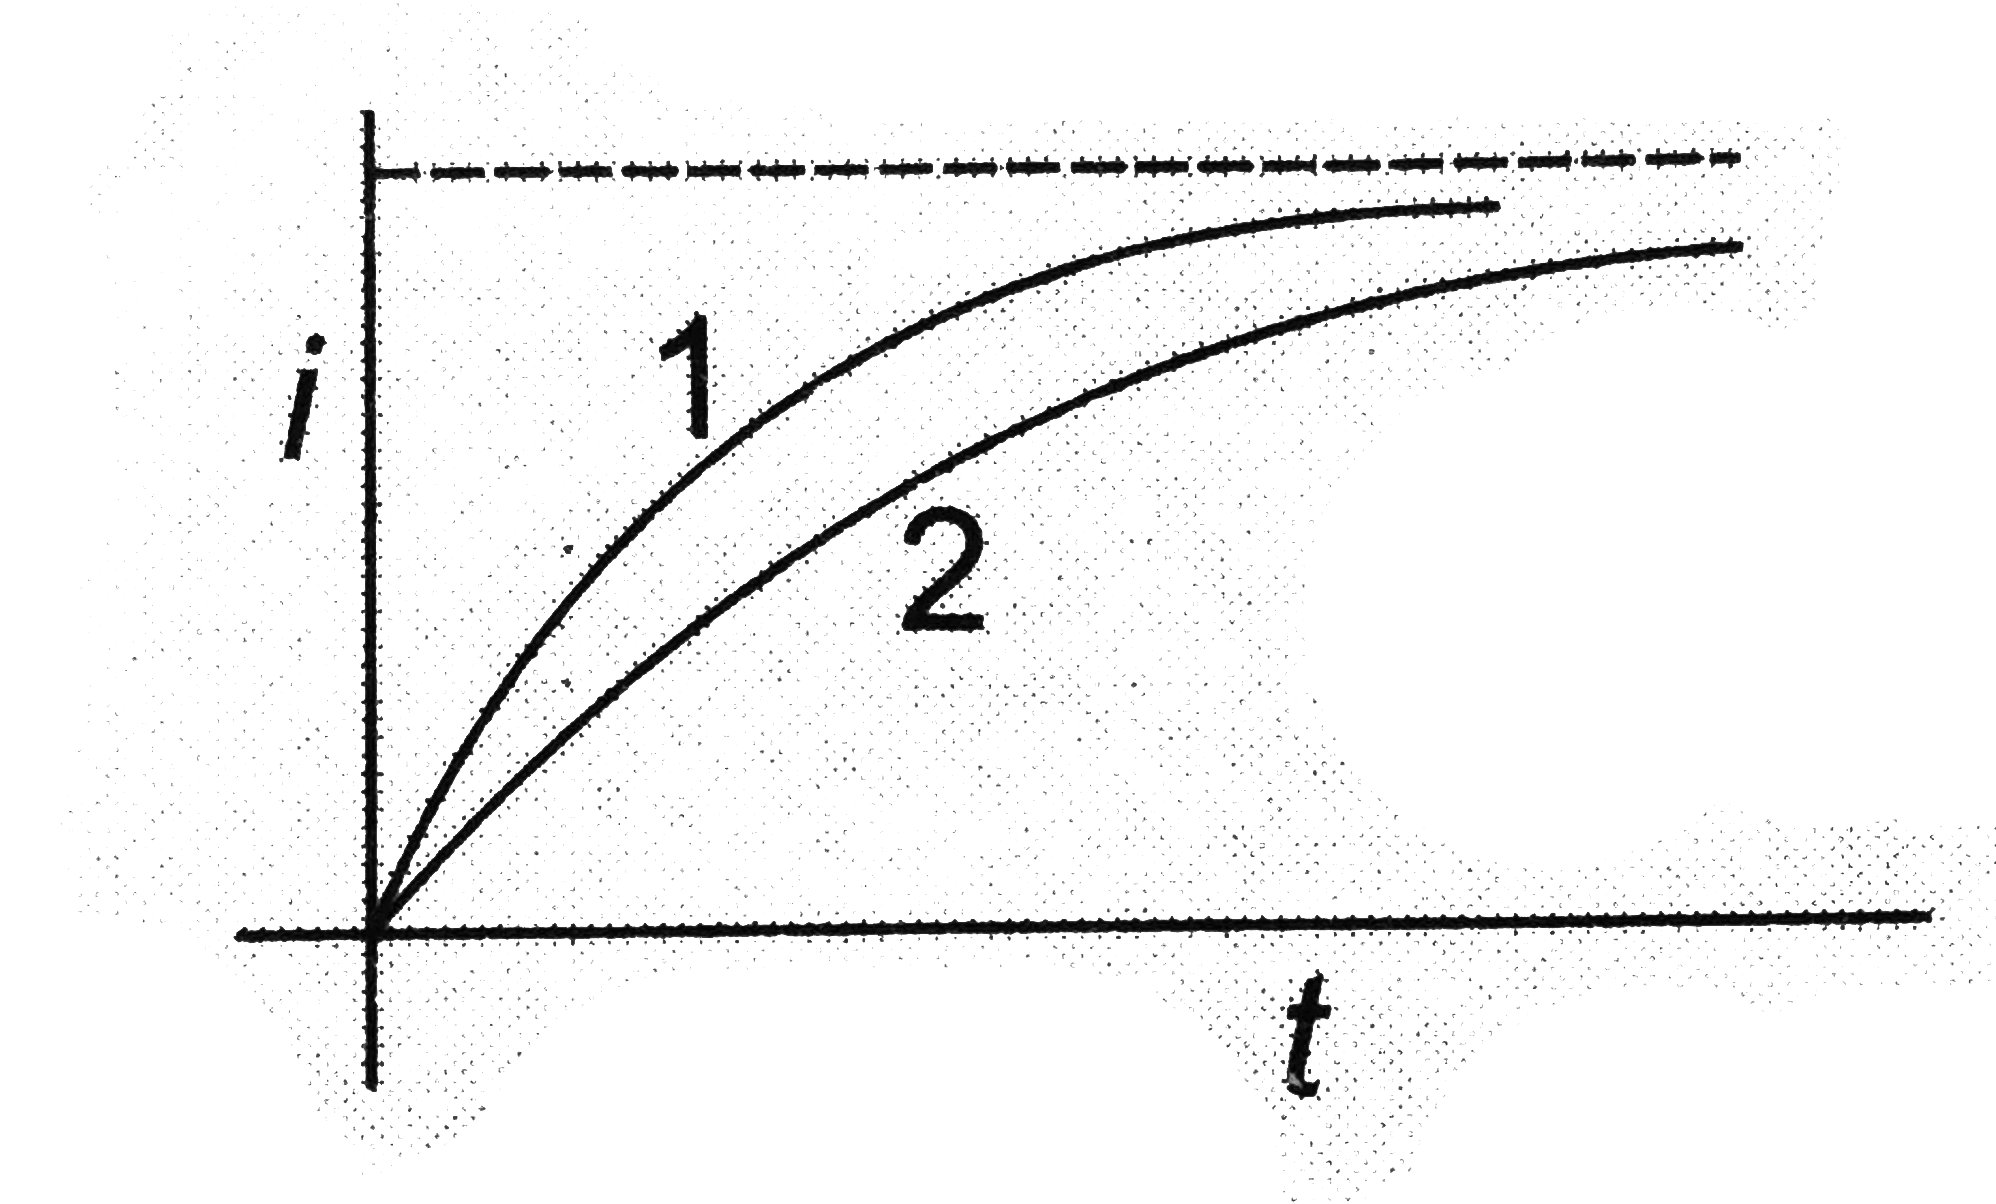
Which of the two curves shown below has lesser time constant.
Video Solution
Text Solution
curve 1
|
Topper's Solved these Questions
- ELECTROMAGNETIC INDUCTIONBook:RESONANCE ENGLISHChapter:ELECTROMAGNETIC INDUCTIONExercise:Exercis-1
Explore 63 Videos
- ELECTROMAGNETIC INDUCTIONBook:RESONANCE ENGLISHChapter:ELECTROMAGNETIC INDUCTIONExercise:Exercis-1 PART 2
Explore 51 Videos
- ELECTROMAGNETIC INDUCTIONBook:RESONANCE ENGLISHChapter:ELECTROMAGNETIC INDUCTIONExercise:A.l.P
Explore 19 Videos
- ELECTRODYNAMICSBook:RESONANCE ENGLISHChapter:ELECTRODYNAMICSExercise:Advanced level problems
Explore 29 Videos
- ELECTROSTATICSBook:RESONANCE ENGLISHChapter:ELECTROSTATICSExercise:HLP
Explore 38 Videos
Similar Questions
Knowledge Check
Which of the compounds shown below are isomers?
A B
B C
C D
D
Among the structures shown below, which has the lowest potential energy ?
A B
B C
C D
D
Among the structure shown below, which has lowest potential energy?
A B
B C
C D
D
For the given circuit shown in figure below, time constant is

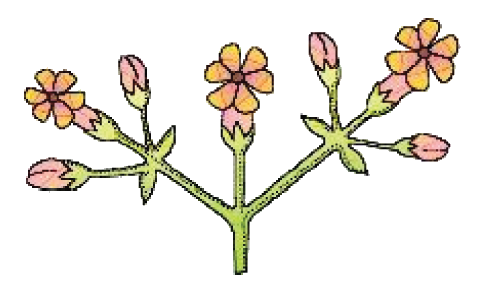
View SolutionWhich type of inflorescence is shown below?
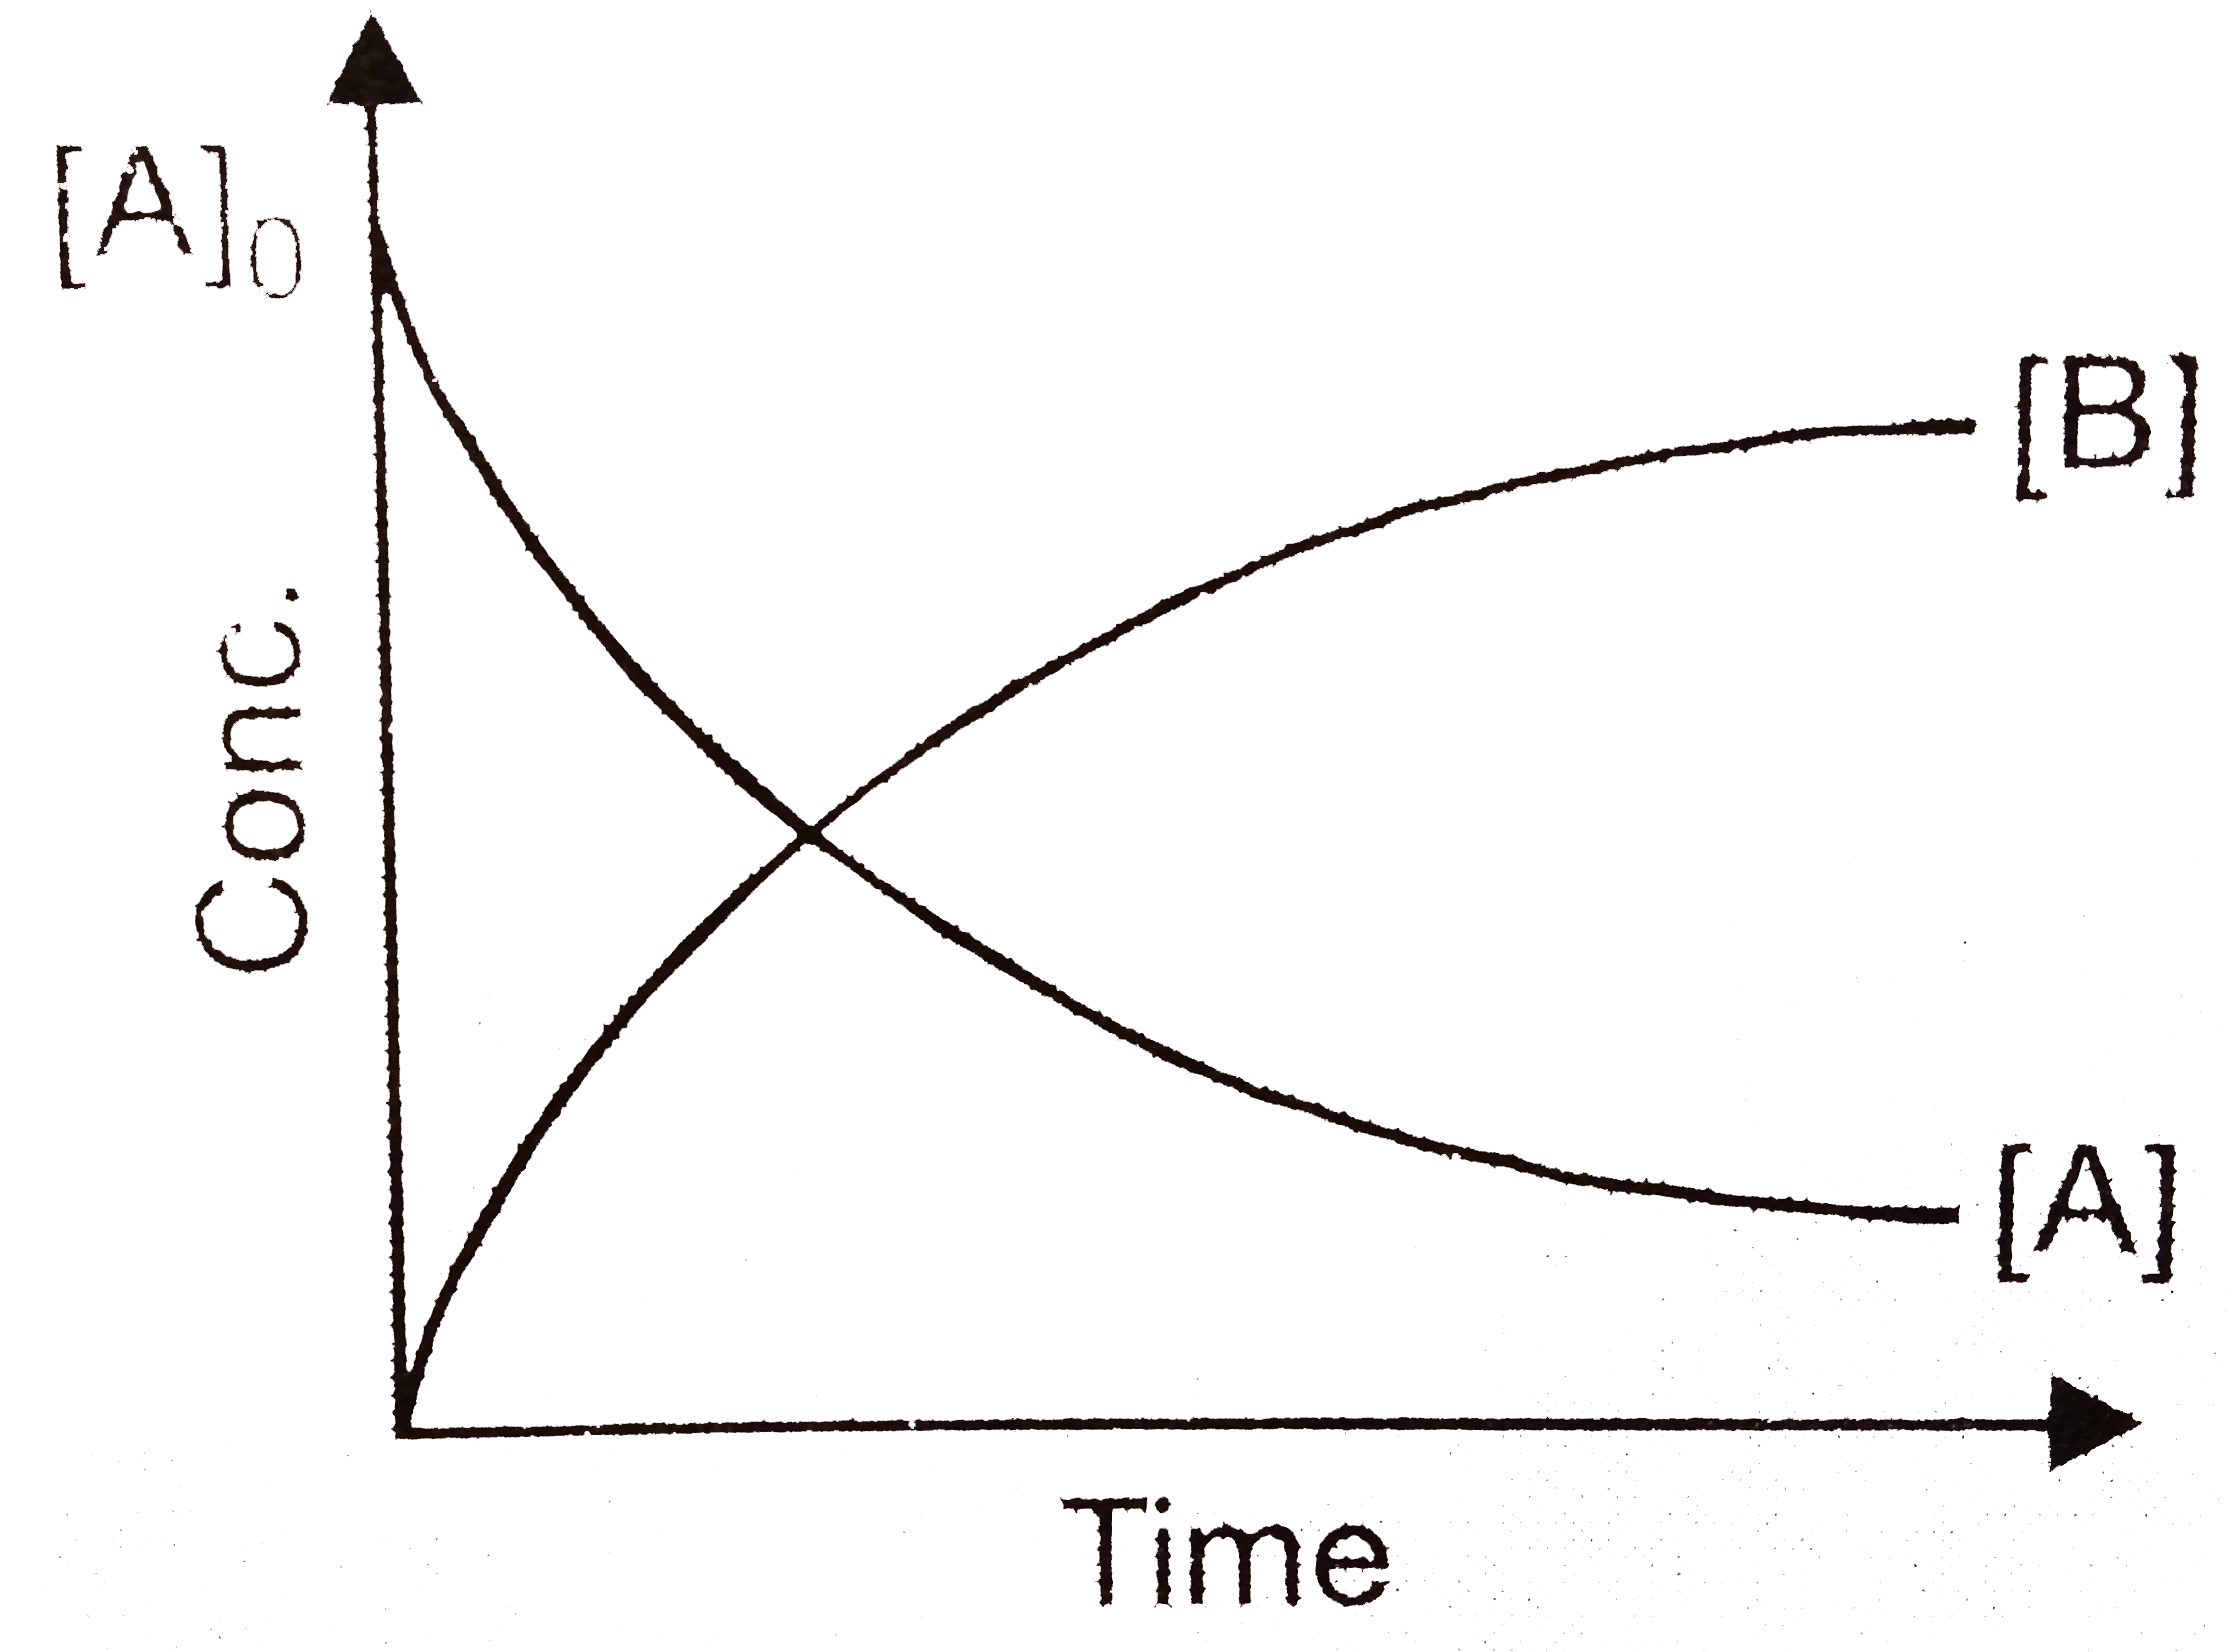
View SolutionAt the point of intersection of the two curves shown, the conc. of B is given by ……… for, A→nB:
View SolutionTwo plots are shown below between concentration and time t. Which of the given orders are shown by the graphs respectively?

View SolutionFor a system at equilibrium some changes are made which is reported by a graph (shown below). Changes has been made at constant temperature.
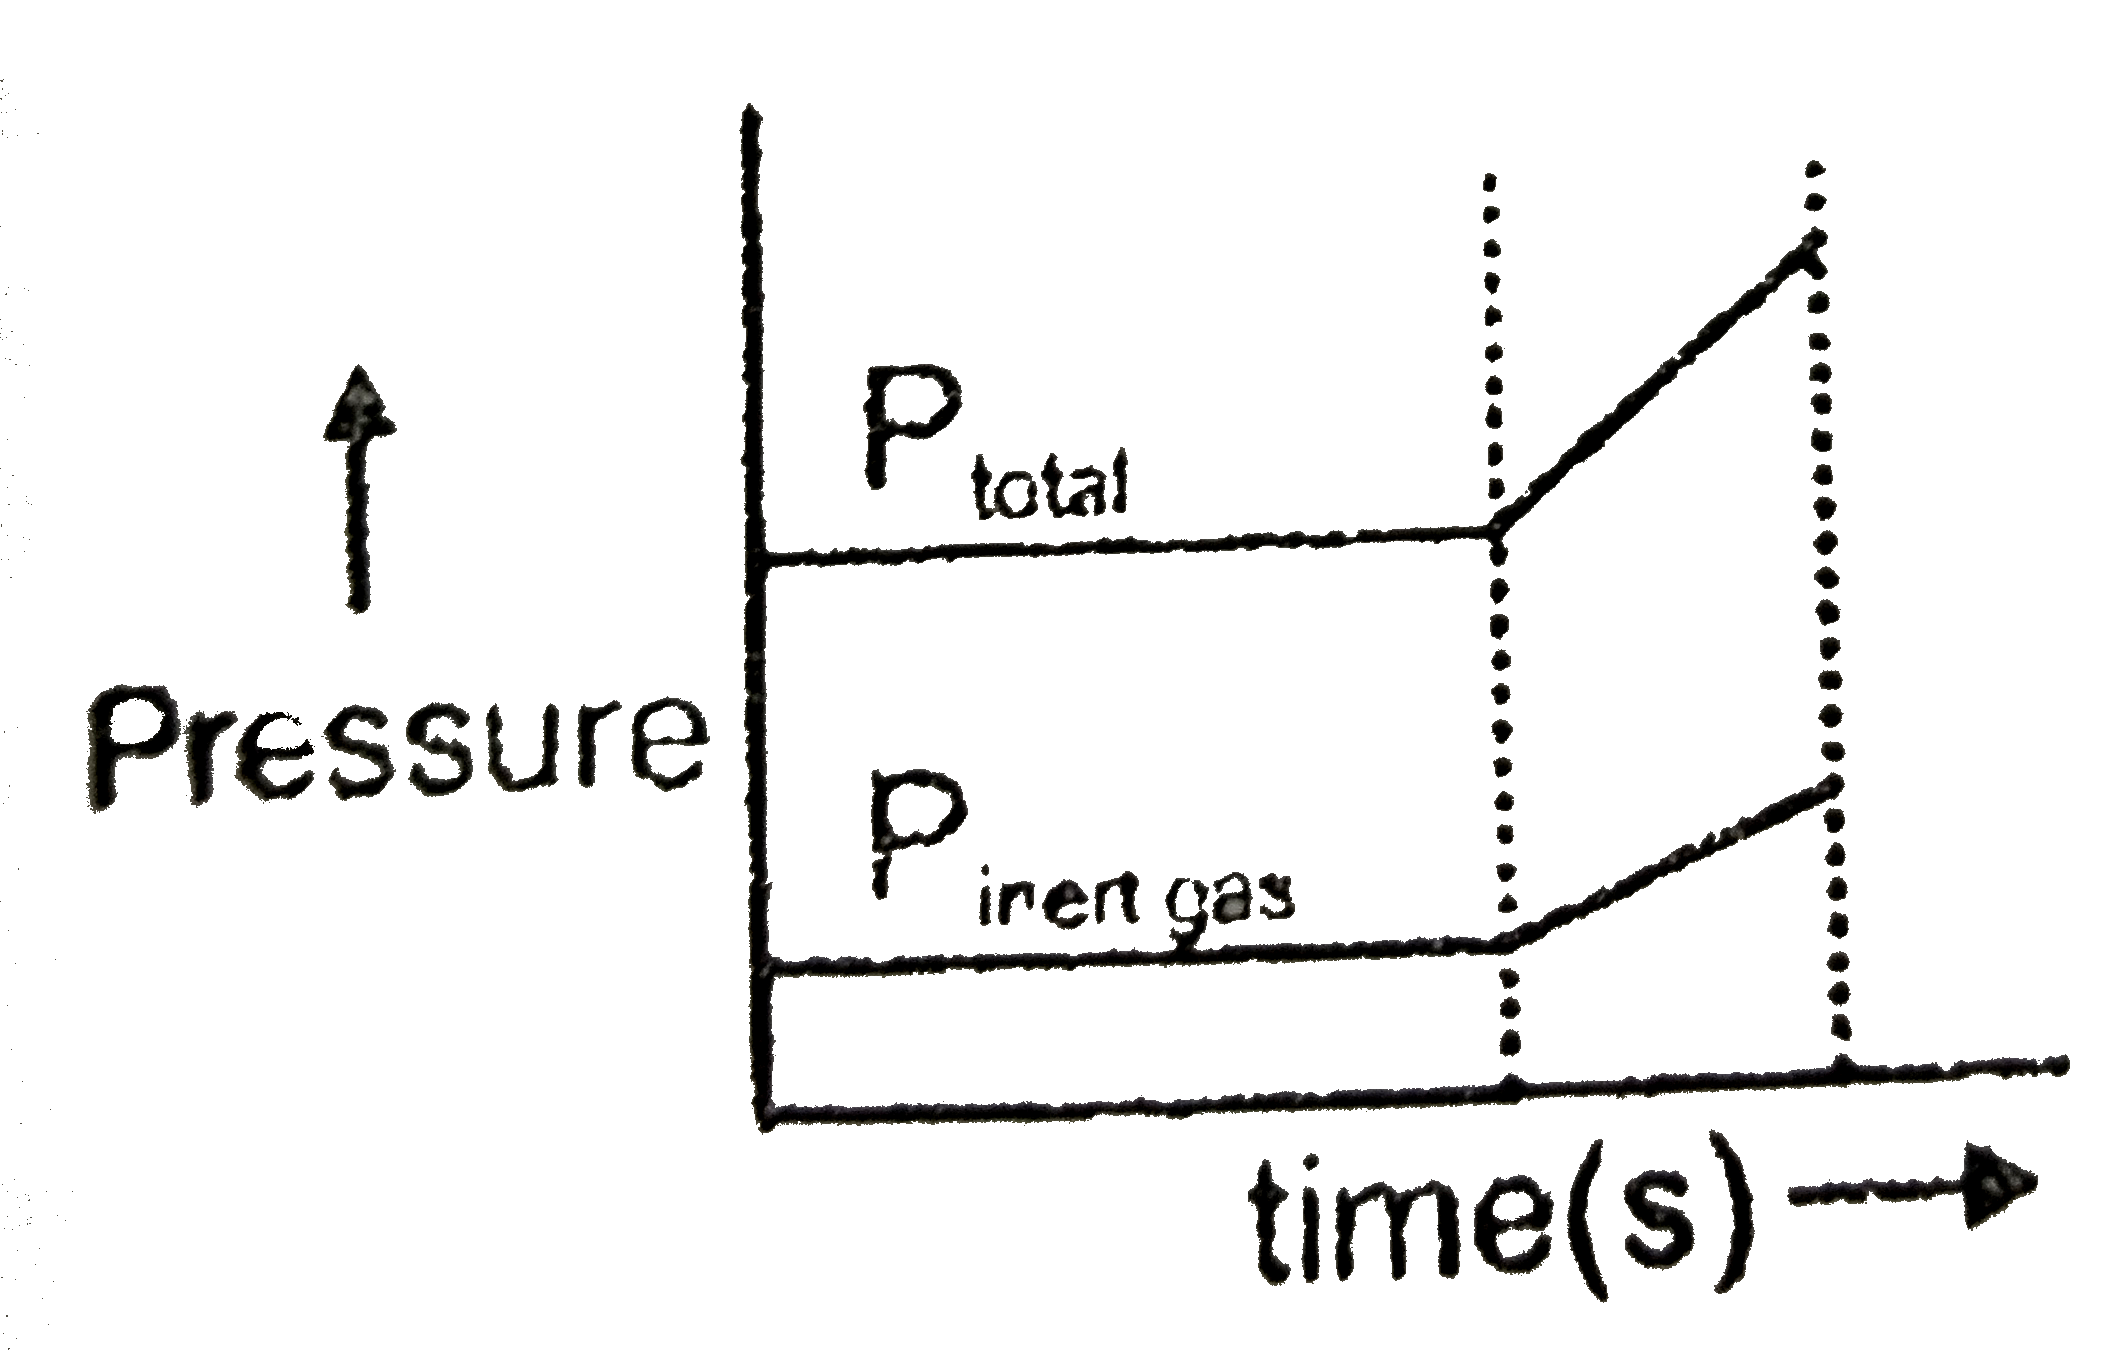
Choose the correct options:
View Solution

