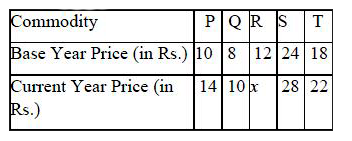
Find x if the Price Index Number by Simple Aggregate Method is 125.

The correct Answer is:x = 16
Step by step video & text solution for Find x if the Price Index Number by Simple Aggregate Method is 125. by Maths experts to help you in doubts & scoring excellent marks in Class 12 exams.
Updated on:21/07/2023टॉपर्स ने हल किए ये सवाल
- QUESTION BANK 2021BOOK - NAVNEET PUBLICATION - MAHARASHTRA BOARDCHAPTER - QUESTION BANK 2021EXERCISE - Part II 5. INDEX NUMBERS (V Activity)
1 Video
- QUESTION BANK 2021BOOK - NAVNEET PUBLICATION - MAHARASHTRA BOARDCHAPTER - QUESTION BANK 2021EXERCISE - Part II LINEAR PROGRAMMING PROBLEMS (1. Select the most appropriate option for each of the following. )
12 Videos
- QUESTION BANK 2021BOOK - NAVNEET PUBLICATION - MAHARASHTRA BOARDCHAPTER - QUESTION BANK 2021EXERCISE - Part II 5. INDEX NUMBERS (III) State whether each of the following is True or False.)
9 Videos
- PROBABILITY DISTRIBUTIONBOOK - NAVNEET PUBLICATION - MAHARASHTRA BOARDCHAPTER - PROBABILITY DISTRIBUTIONEXERCISE - MULTIPLE CHOICE QUESTIONS
9 Videos
- THREE DIMENSIONAL GEOMETRY BOOK - NAVNEET PUBLICATION - MAHARASHTRA BOARDCHAPTER - THREE DIMENSIONAL GEOMETRY EXERCISE - MULTIPLE CHOICE QUESTIONS
8 Videos
समान प्रश्न
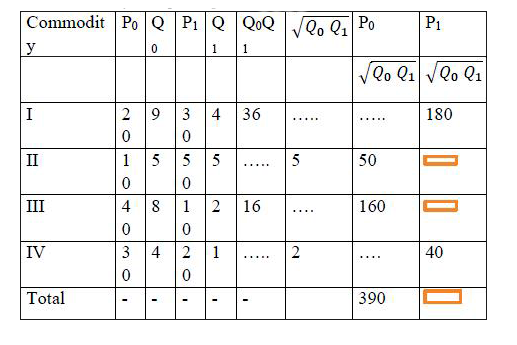
Given the following table, find Walsh’s Price Index Number by completing the activity.

Walsh’s price Index Number is
P01(w)=.....∑p0√q0q1×100
=510.....×100
=□
View SolutionIf LPP has optimal solution at two point then,
View SolutionState True or False: Walsh’s Price Index Number is given by
∑p1√q0q1∑p0√q0q1×100
View Solutionc.d.f F(x) of a continous random variable X is defined as .
View SolutionIf a line is inclined at 60∘ and 30∘ with the X-and Y-axes respectively, then the angle which makes with the Z-axes is
View SolutionHow many lines of symmetry does the above figure have ?
View SolutionDetermine the point of symmetry of a regular hexagon.
View SolutionMatch the following Column A to Column B

View SolutionMatch the following Column A to Column B

View SolutionMatch the following Column A to Column B

View SolutionFind the area of figure given below.

View SolutionFind the perimeter of the figure given below.

View SolutionFind the area of the figure given below.

View SolutionThe inequation represented by the graph given below is :
View SolutionThe inequation that best describes the graph given below is _________
View SolutionThe inequation that best describes the following graph is _________
View Solution

