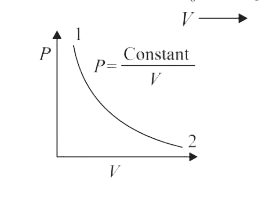
For the diagram given for an ideal gas, out of the following which one correctly represent the diagram?
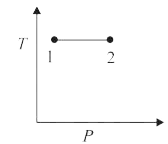
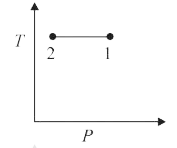
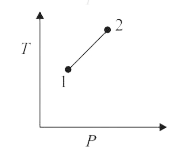
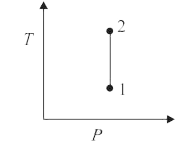
The correct Answer is:B
P∝1V T⇒ constant.
Topper's Solved these Questions
- GASEOUS STATE & THERMODYNAMICSBOOK - VMC MODULES ENGLISHCHAPTER - GASEOUS STATE & THERMODYNAMICSEXERCISE - JEE ADVANCED (ARCHIVE )
109 Videos
- GASEOUS STATE & THERMODYNAMICSBOOK - VMC MODULES ENGLISHCHAPTER - GASEOUS STATE & THERMODYNAMICSEXERCISE - Level - 2
40 Videos
- ENERGY & MOMENTUMBOOK - VMC MODULES ENGLISHCHAPTER - ENERGY & MOMENTUMEXERCISE - JEE ADVANCE (ARCHIVE) - TRUE/FALSE TYPE
1 Video
- GRAVITATIONBOOK - VMC MODULES ENGLISHCHAPTER - GRAVITATIONEXERCISE - JEE Advance (Archive) TRUE/FALSE
1 Video
Similar Questions
Knowledge Check
Consider p-V diagram for an ideal gas shown in figure.
Out of the following diagrams, which figure represents the T−p diagram ?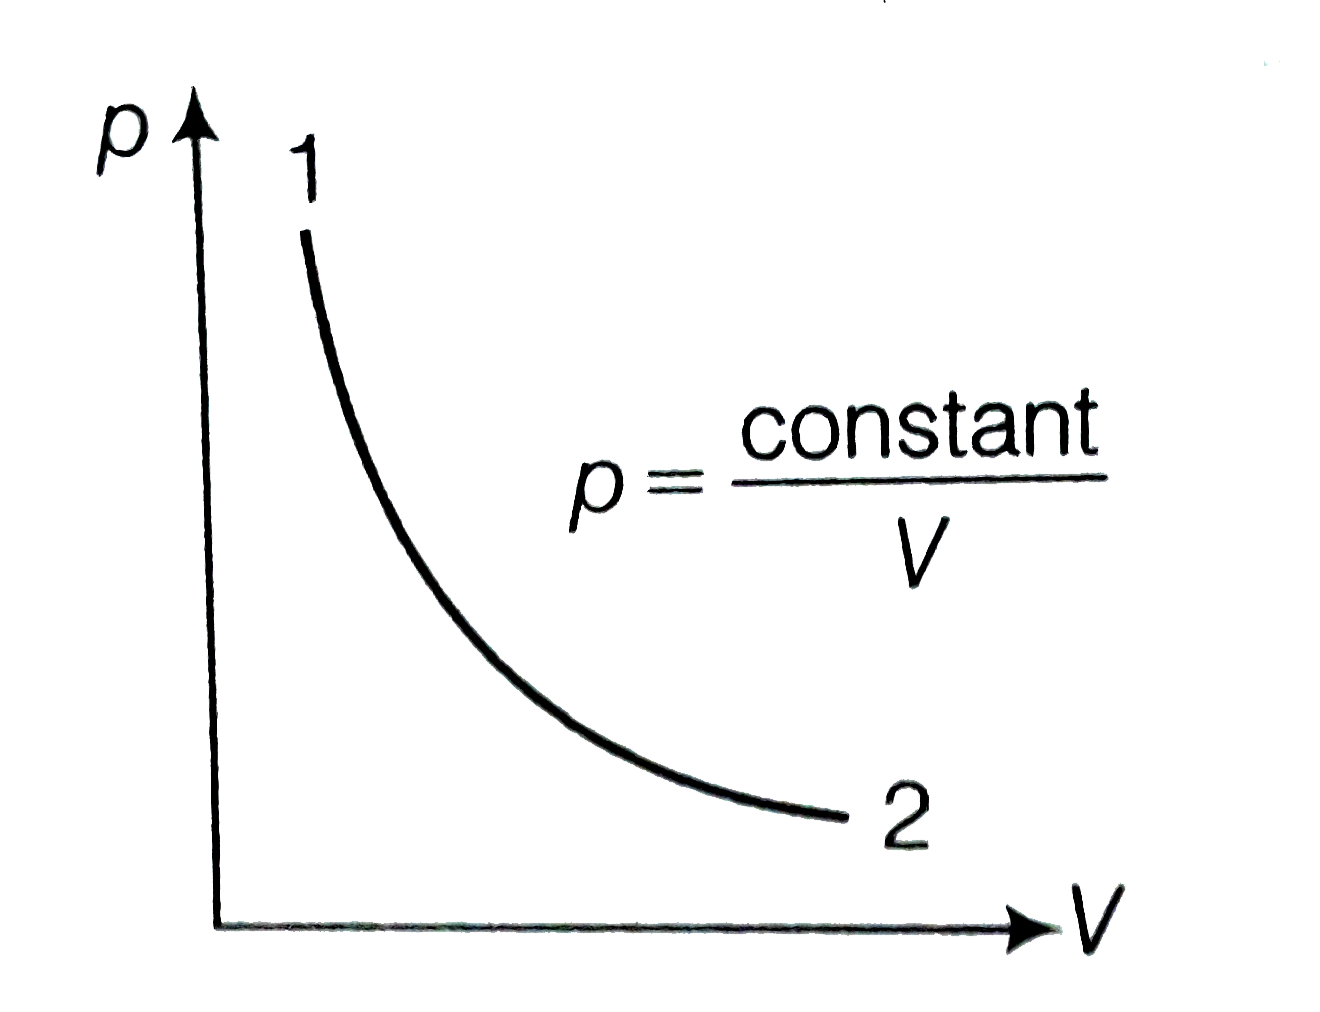
(i)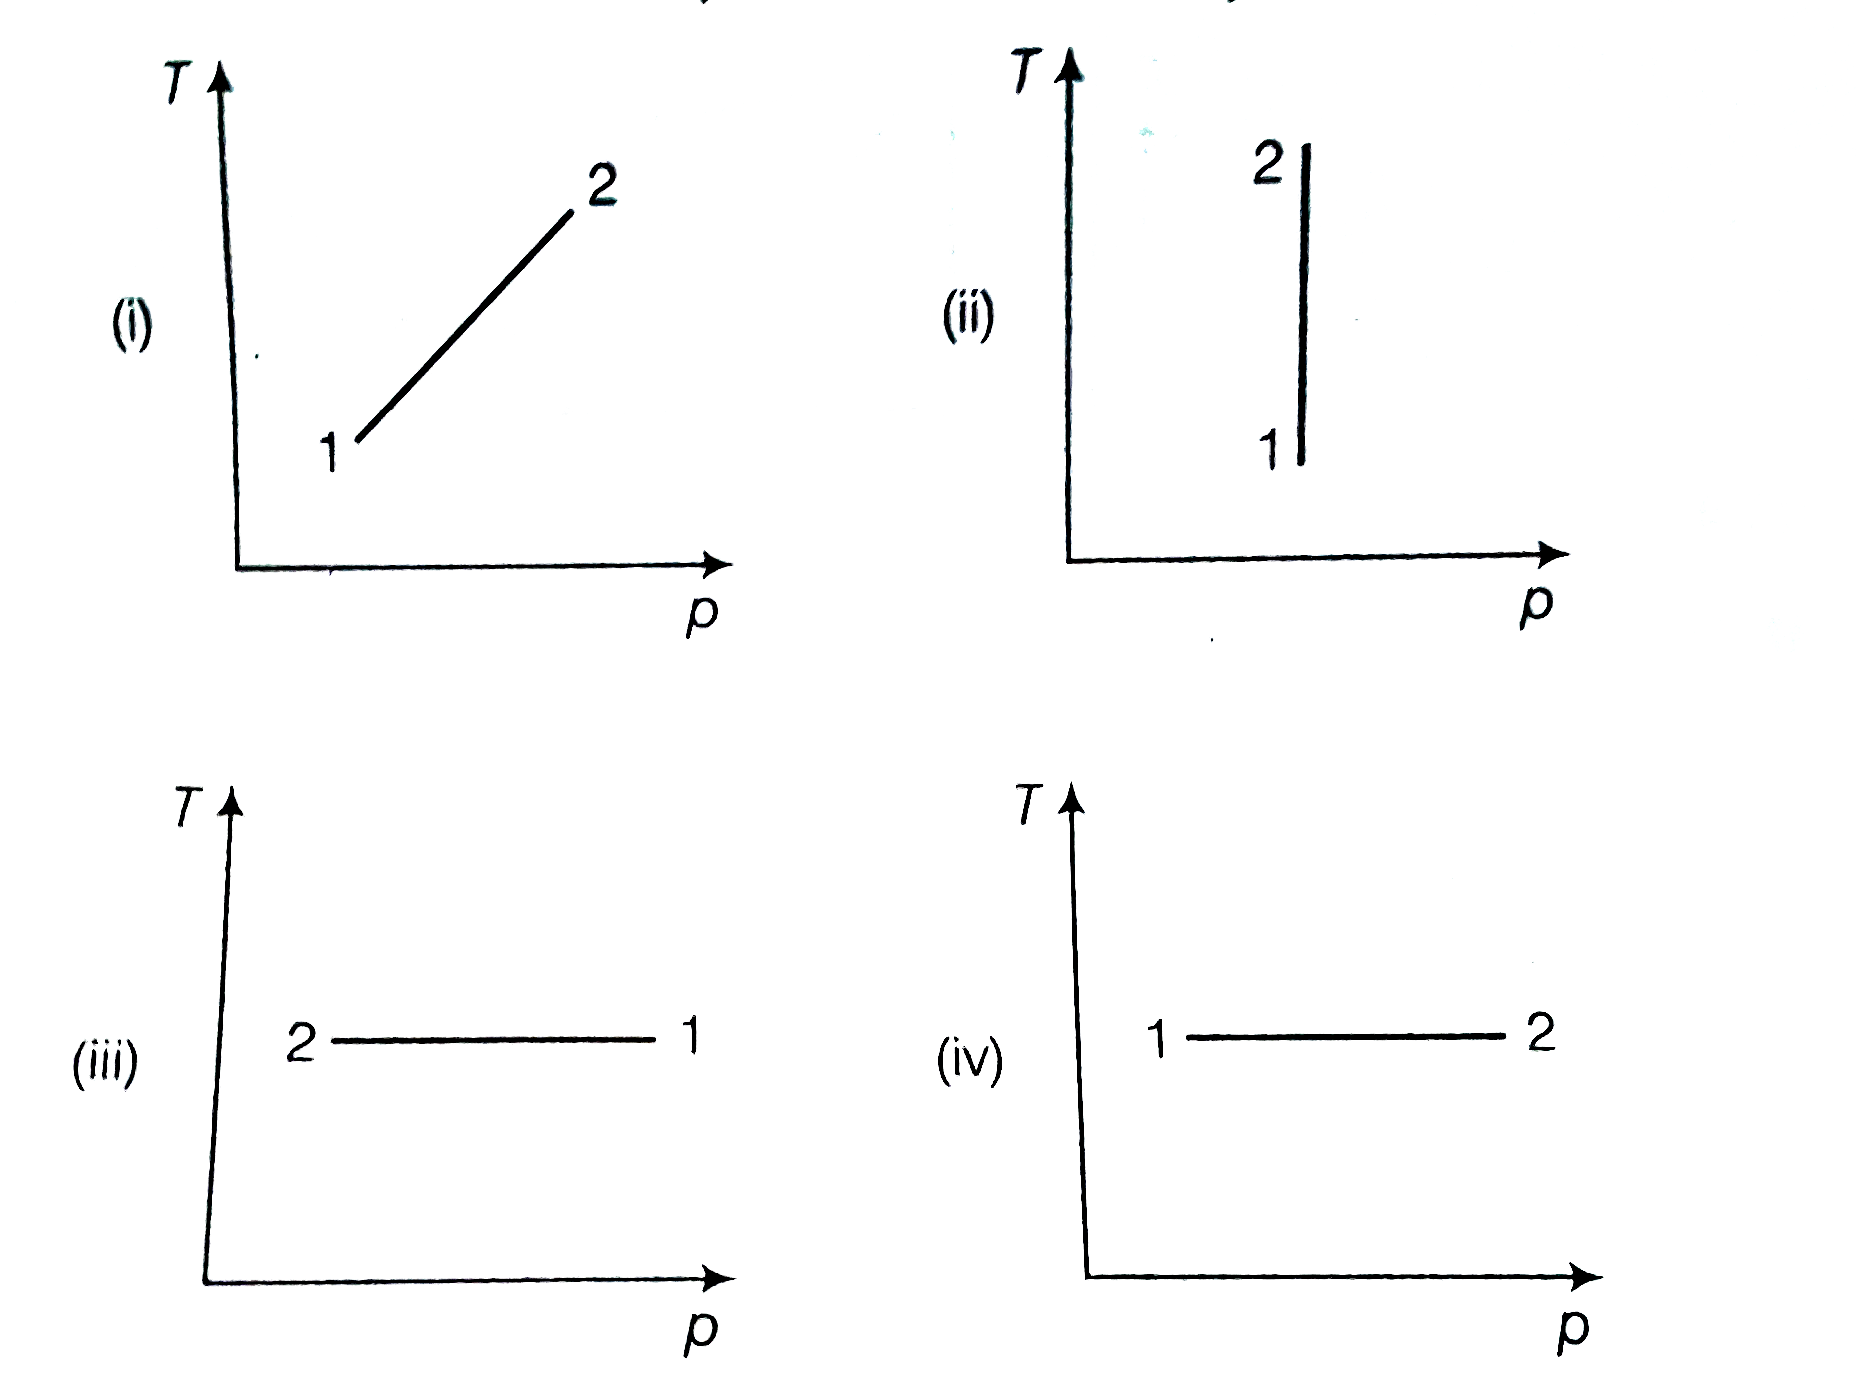 A(iv)B(ii)C(iii)D(i)
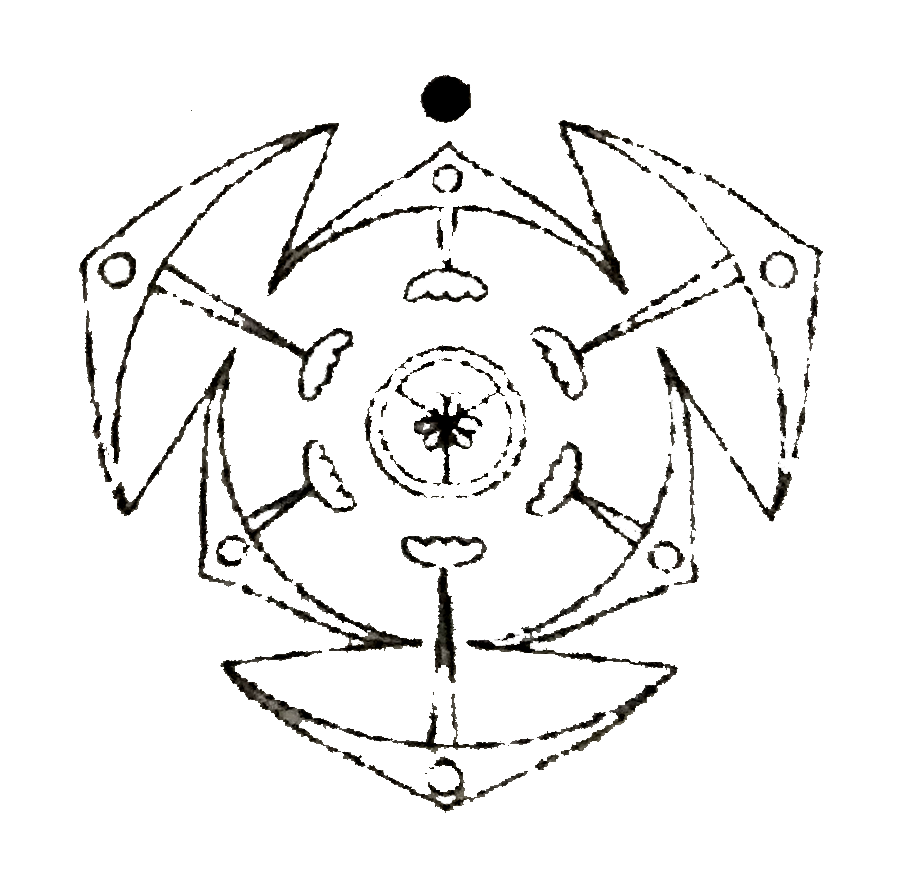
Study carefully the given floral diagram and select the option which correctly represents the reltated floral fomula.
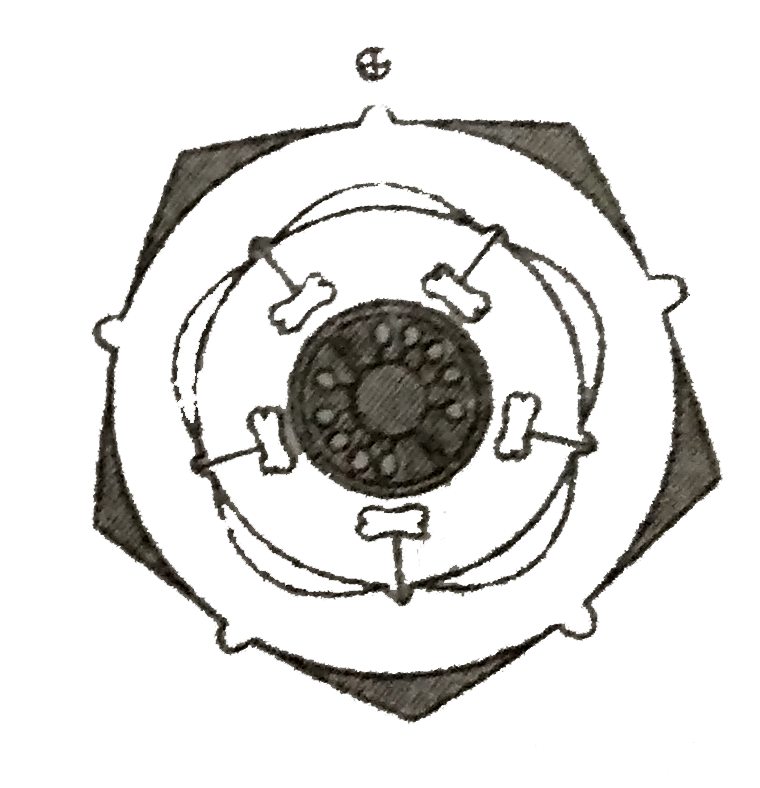 A
A B
B C
C D
D
Which of the following Venn diagram represent (A−B)?
View SolutionWhich of the following does not represent ideal gas equation?
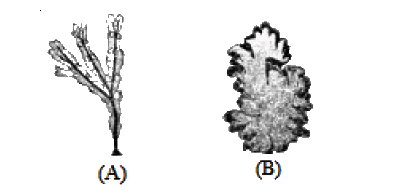
View SolutionWhich one of the following is correctly matched with the given diagram labelled as A and B ?
View SolutionStudy carefully the given floral diagram and select the option which correctly represents the related floral formula.
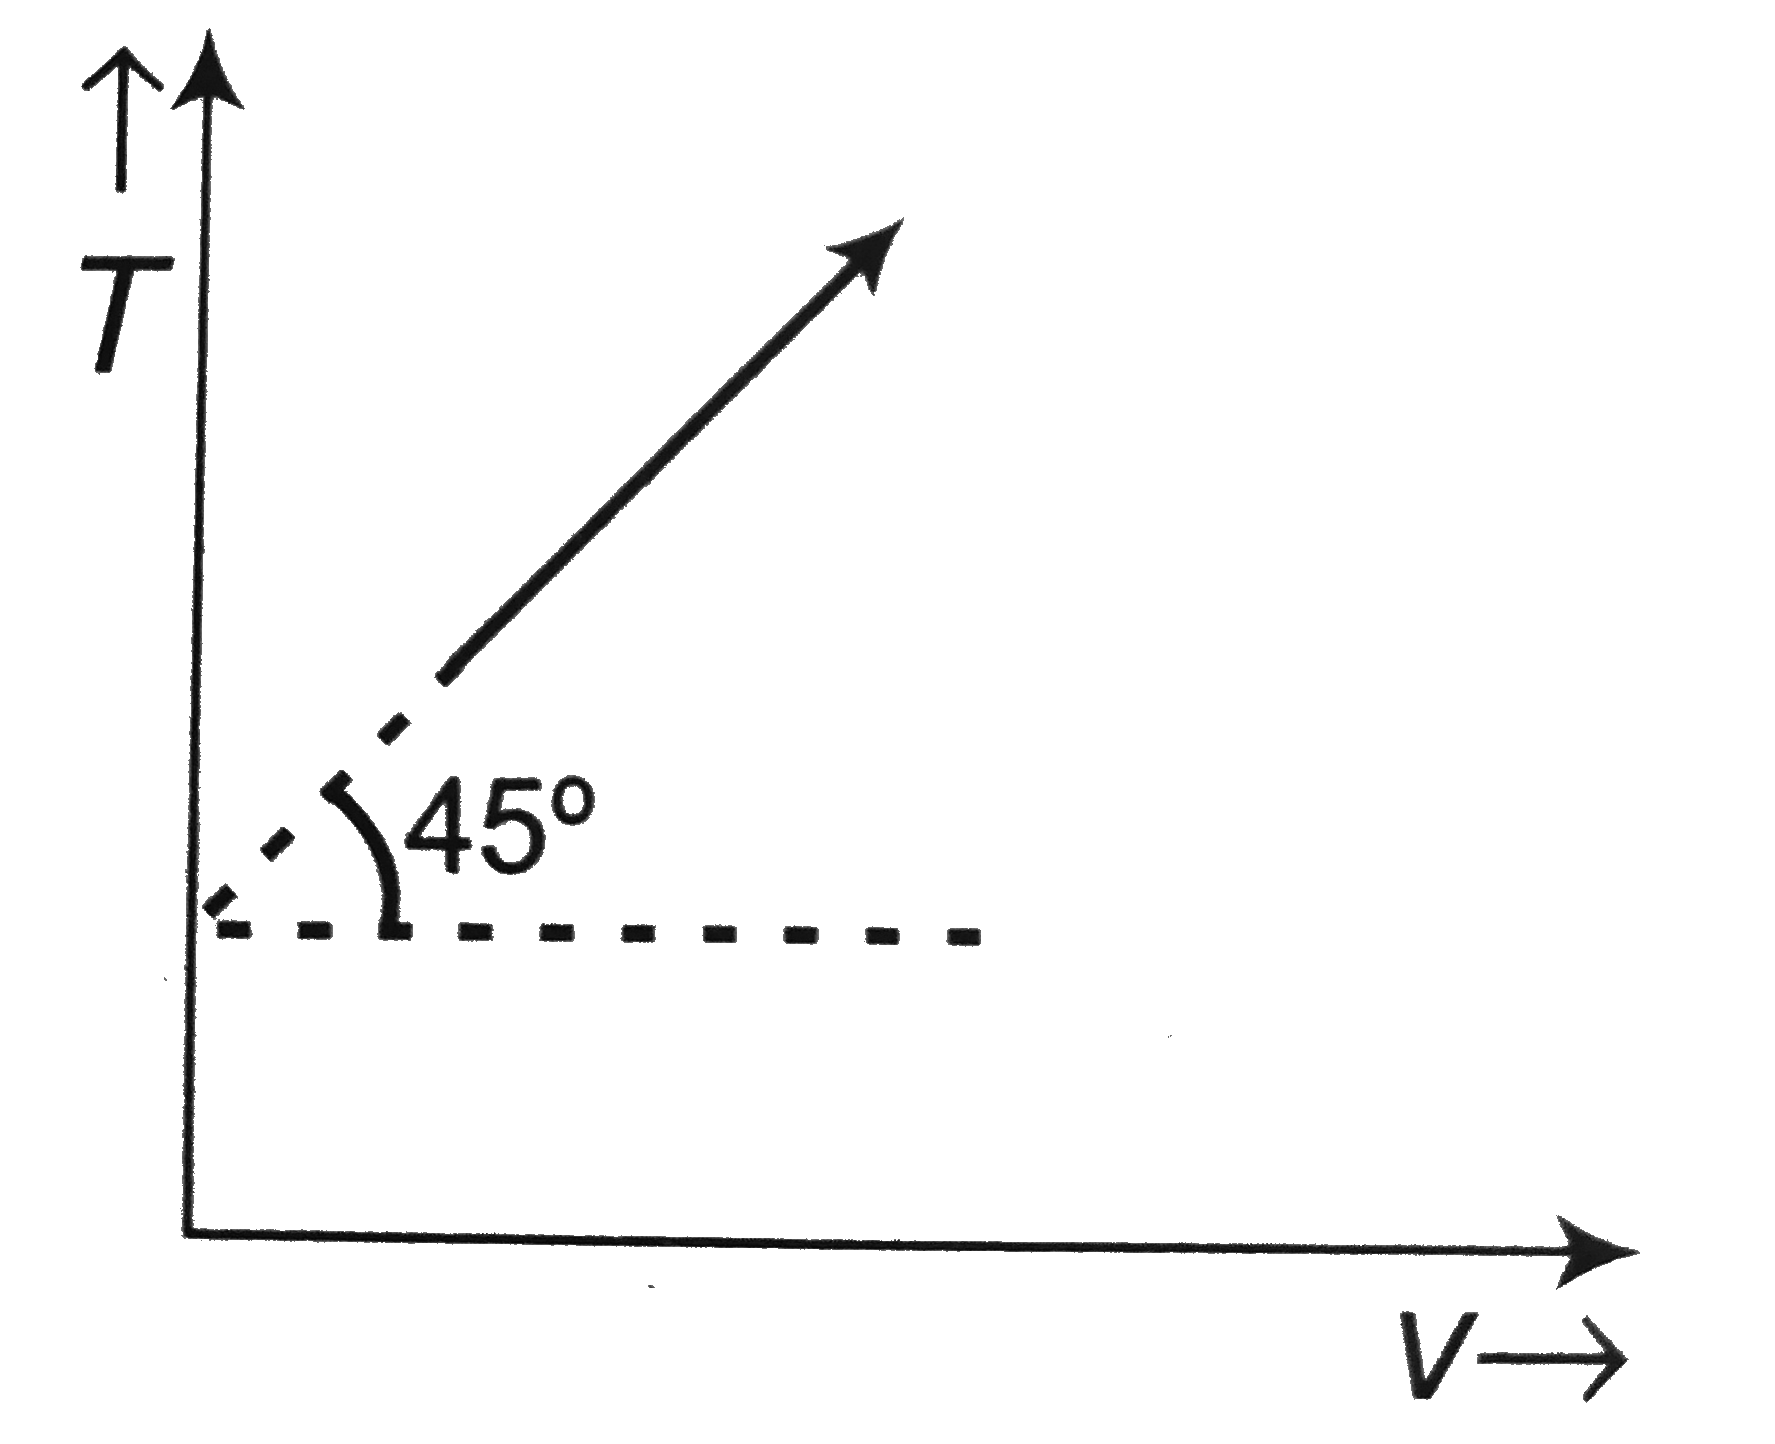
View SolutionThe given curve represents the variation of temperature as a function of volume for one mole of an ideal gas. Which of the following curves best represents the variation of pressure as a function of volume?
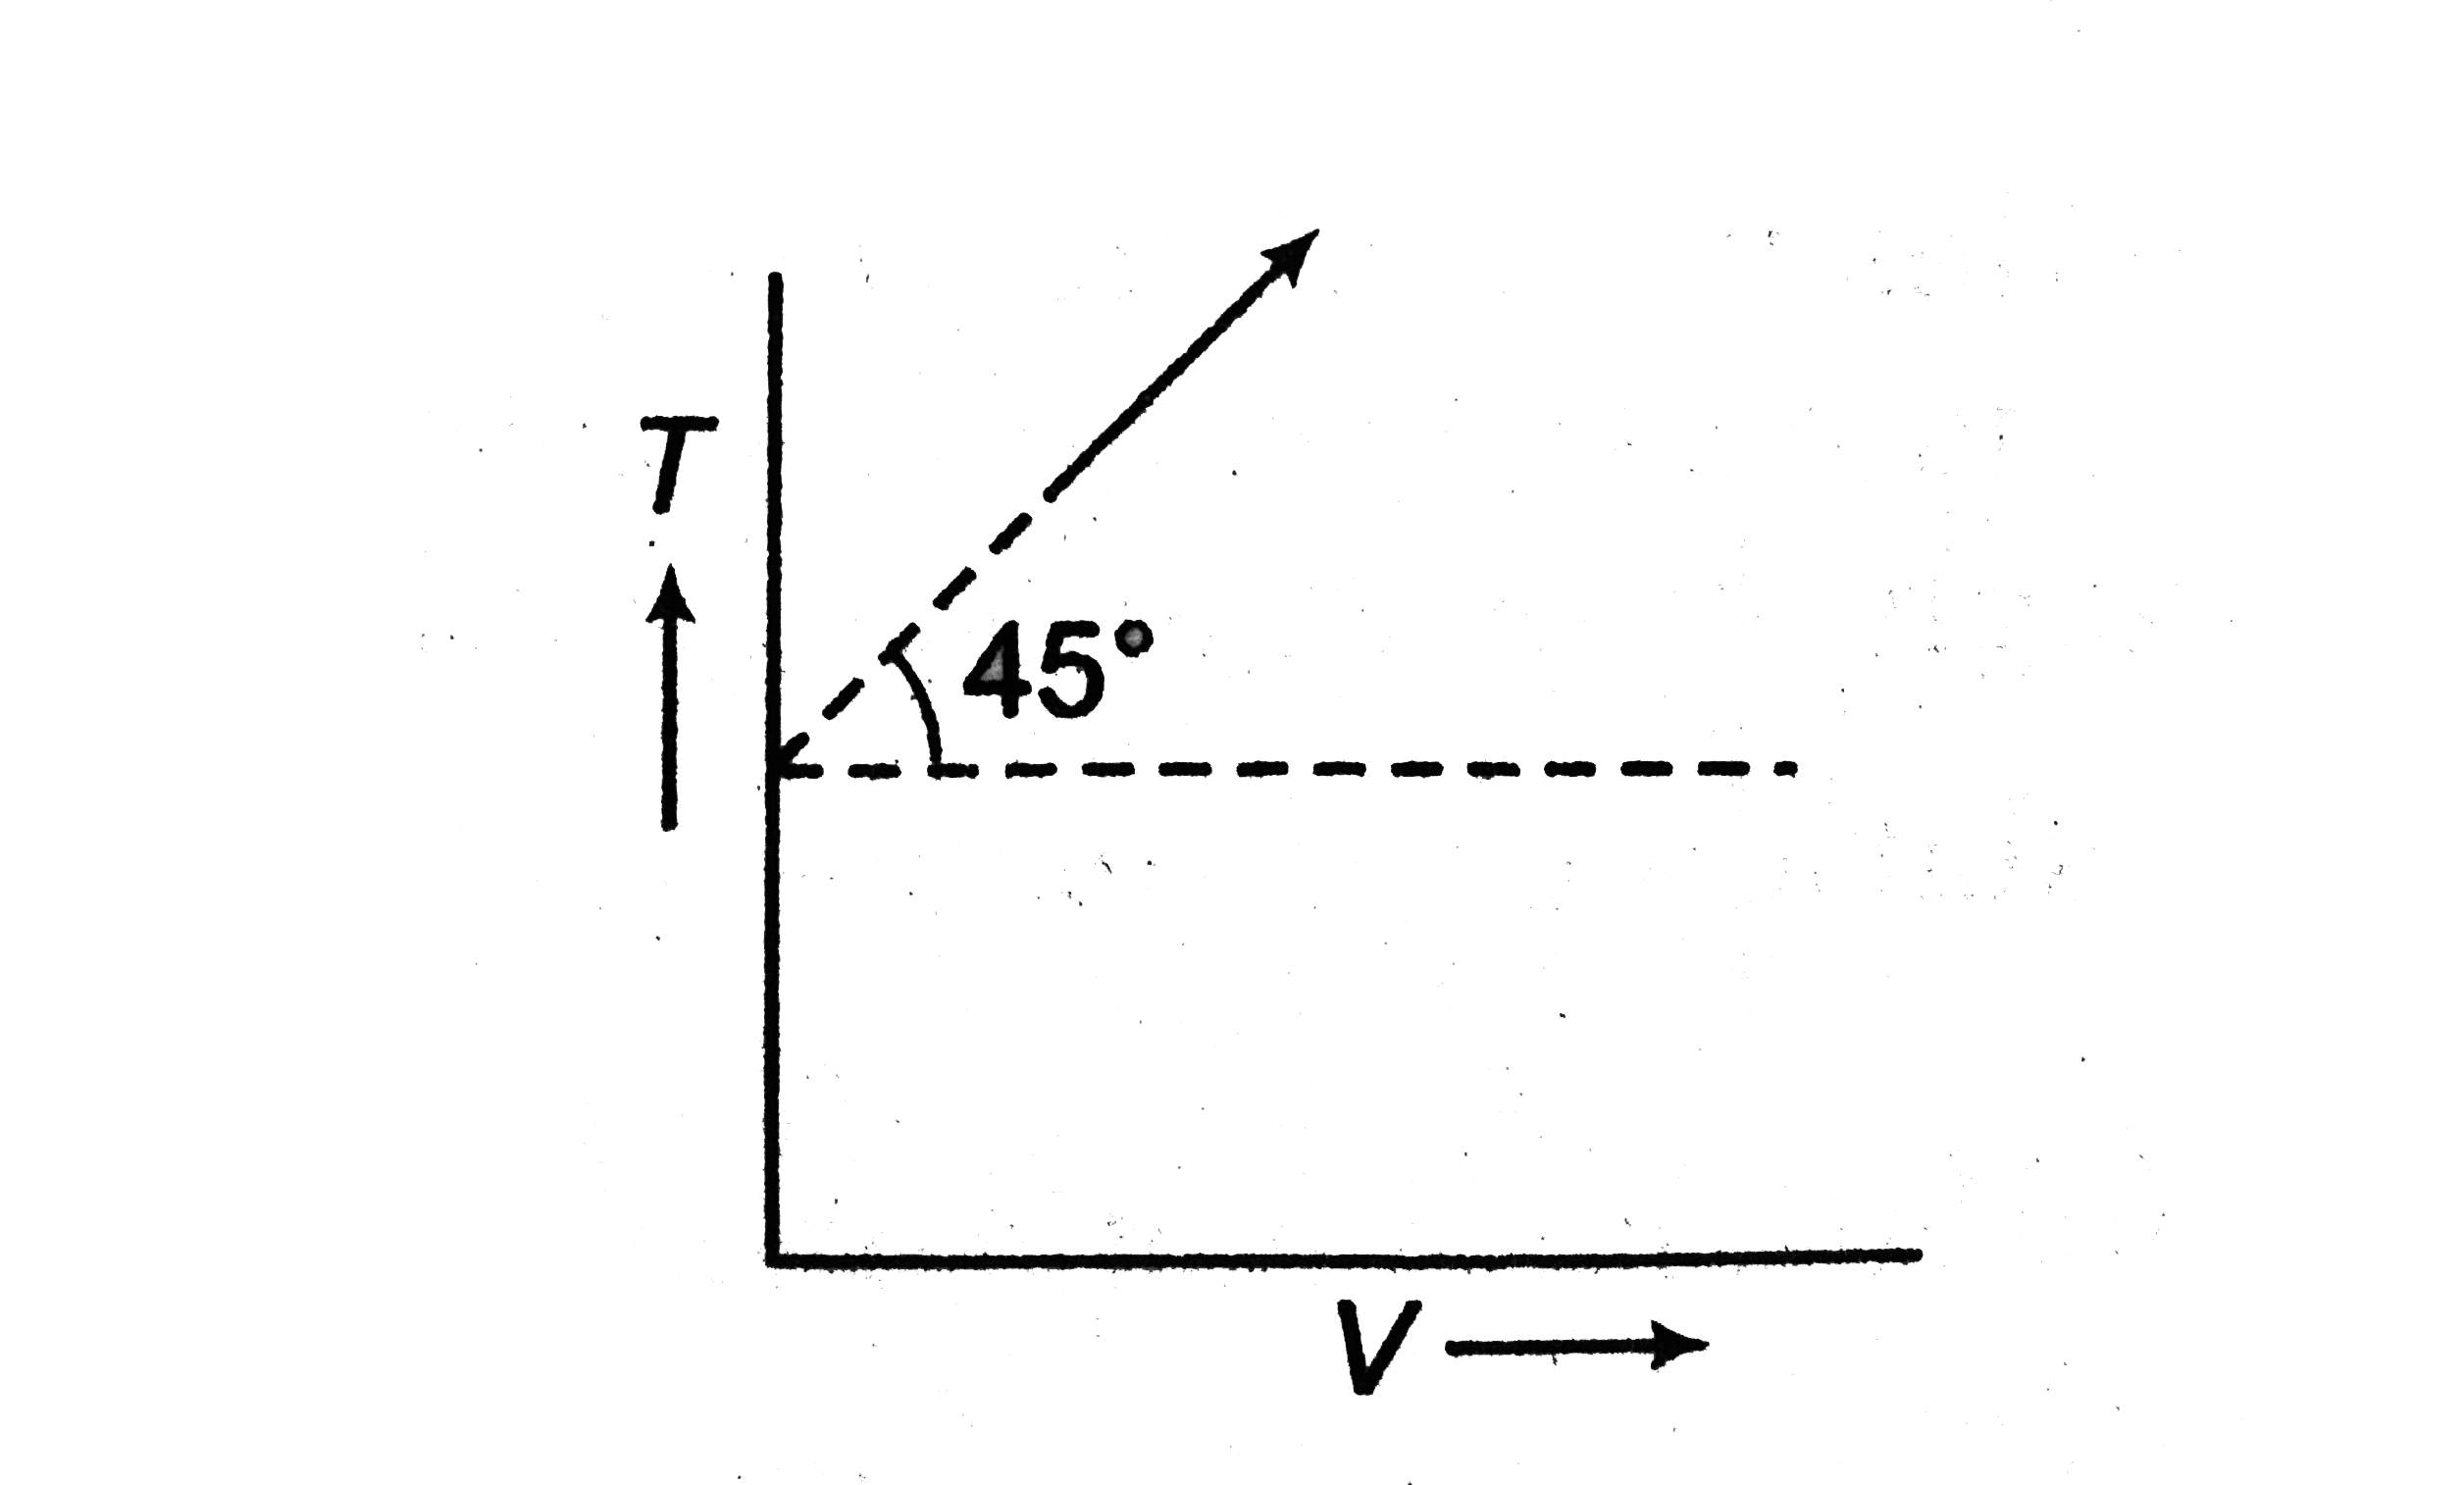
View SolutionThe given curve represents the variation of temperatue as a function of volume for one mole of an ideal gas. Which of the following curves best represents the variation of pressure as a function of volume ?
 .
.
View Solution

