यदि  5 विद्यार्थियों को निरुपित करता है, तो
  द्वारा निरुपित विद्यार्थियों की संख्या है :
2
3
4
5
The correct Answer is:B
टॉपर्स ने हल किए ये सवाल
- आँकड़ों का प्रबंधन BOOK - MBD PUBLICATIONCHAPTER - आँकड़ों का प्रबंधन EXERCISE - इन्हें कीजिए
4 Videos
- आँकड़ों का प्रबंधन BOOK - MBD PUBLICATIONCHAPTER - आँकड़ों का प्रबंधन EXERCISE - प्रश्नावली 9.4
6 Videos
- अपनी संख्याओं की जानकारीBOOK - MBD PUBLICATIONCHAPTER - अपनी संख्याओं की जानकारीEXERCISE - वस्तुनिष्ठ प्रश्न
21 Videos
- आधारभूत ज्यामितीय अवधारणाएँ BOOK - MBD PUBLICATIONCHAPTER - आधारभूत ज्यामितीय अवधारणाएँ EXERCISE - वस्तुनिष्ठ प्रश्न (नीचे प्रत्येक प्रश्न चार - चार उत्तर दिए है। सही उत्तर का चयन करें।)
28 Videos
समान प्रश्न
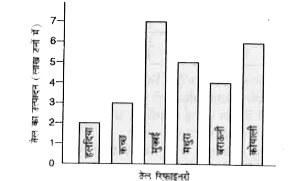
निम्नलिखित दंड आलेख को पढ़िए :

अब निम्नलिखित प्रश्न के उत्तर दीजिए :
यह आलेख क्या सूचना प्रदर्शित करता है ?
View Solutionएक स्कूल के () विद्यार्थियो का इस आशय से सर्वेक्षण किया गया कि वे अपने खाली समय में किस क्रियाकलाप को पसंद करते है । निम्न आँकड़े प्राप्त हुए :

1 इकाई लबाई =5 विद्यार्थी का पैमाना लेकर , एक दंड आलेख बनाइए। खेलने के अतिरिक्त कौन - सा क्रियाकलाप अधिकांश विद्यर्थियों द्वारा पसंद किया जाता है ?
View Solution101, 112,99, 100 में से सबसे छोटी संख्या है:
View Solutionएक रेखा के :
View SolutionIdentify the cell organelle 'A' :-
ltimg src="https://d10lpgp6xz60nq.cloudfront.net/physics_images/ALN_BIO_C10_E08_018_Q01.png" width="80%"gt
View SolutionHow many lines of symmetry does the above figure have ?
View SolutionWhich of the following are correct chain isomers of butane ? (i)
View SolutionDetermine the point of symmetry of a regular hexagon.
View SolutionDtermine the images of the following figure about the given line :
View SolutionMatch the following Column A to Column B

View SolutionMatch the following Column A to Column B

View SolutionMatch the following Column A to Column B

View SolutionFind the area of the figure given below.

View SolutionThe area of the shaded part in the figure given below is ______.

View SolutionThe inequation represented by the graph given below is :
View SolutionThe inequation that best describes the graph given below is _________
View Solution
