Show the following data by a frequency polygen.
Topper's Solved these Questions
- STATISTICS BOOK - UNIQUE PUBLICATIONCHAPTER - STATISTICS EXERCISE - PROBLEM SET
6 Videos
- STATISTICS BOOK - UNIQUE PUBLICATIONCHAPTER - STATISTICS EXERCISE - PRACTICE SET 6.4
4 Videos
- SIMILARITYBOOK - UNIQUE PUBLICATIONCHAPTER - SIMILARITYEXERCISE - Assignment-I
5 Videos
- TRIGONOMETRYBOOK - UNIQUE PUBLICATIONCHAPTER - TRIGONOMETRYEXERCISE - ASSIGNMENT
12 Videos
Similar Questions
The person of O-blood group are 40% . The classification of person based on blood groups is to be shown by pie diagram . What should be the measures of angle for the persons of O-blood group ?
View SolutionDraw a histogram of the following data

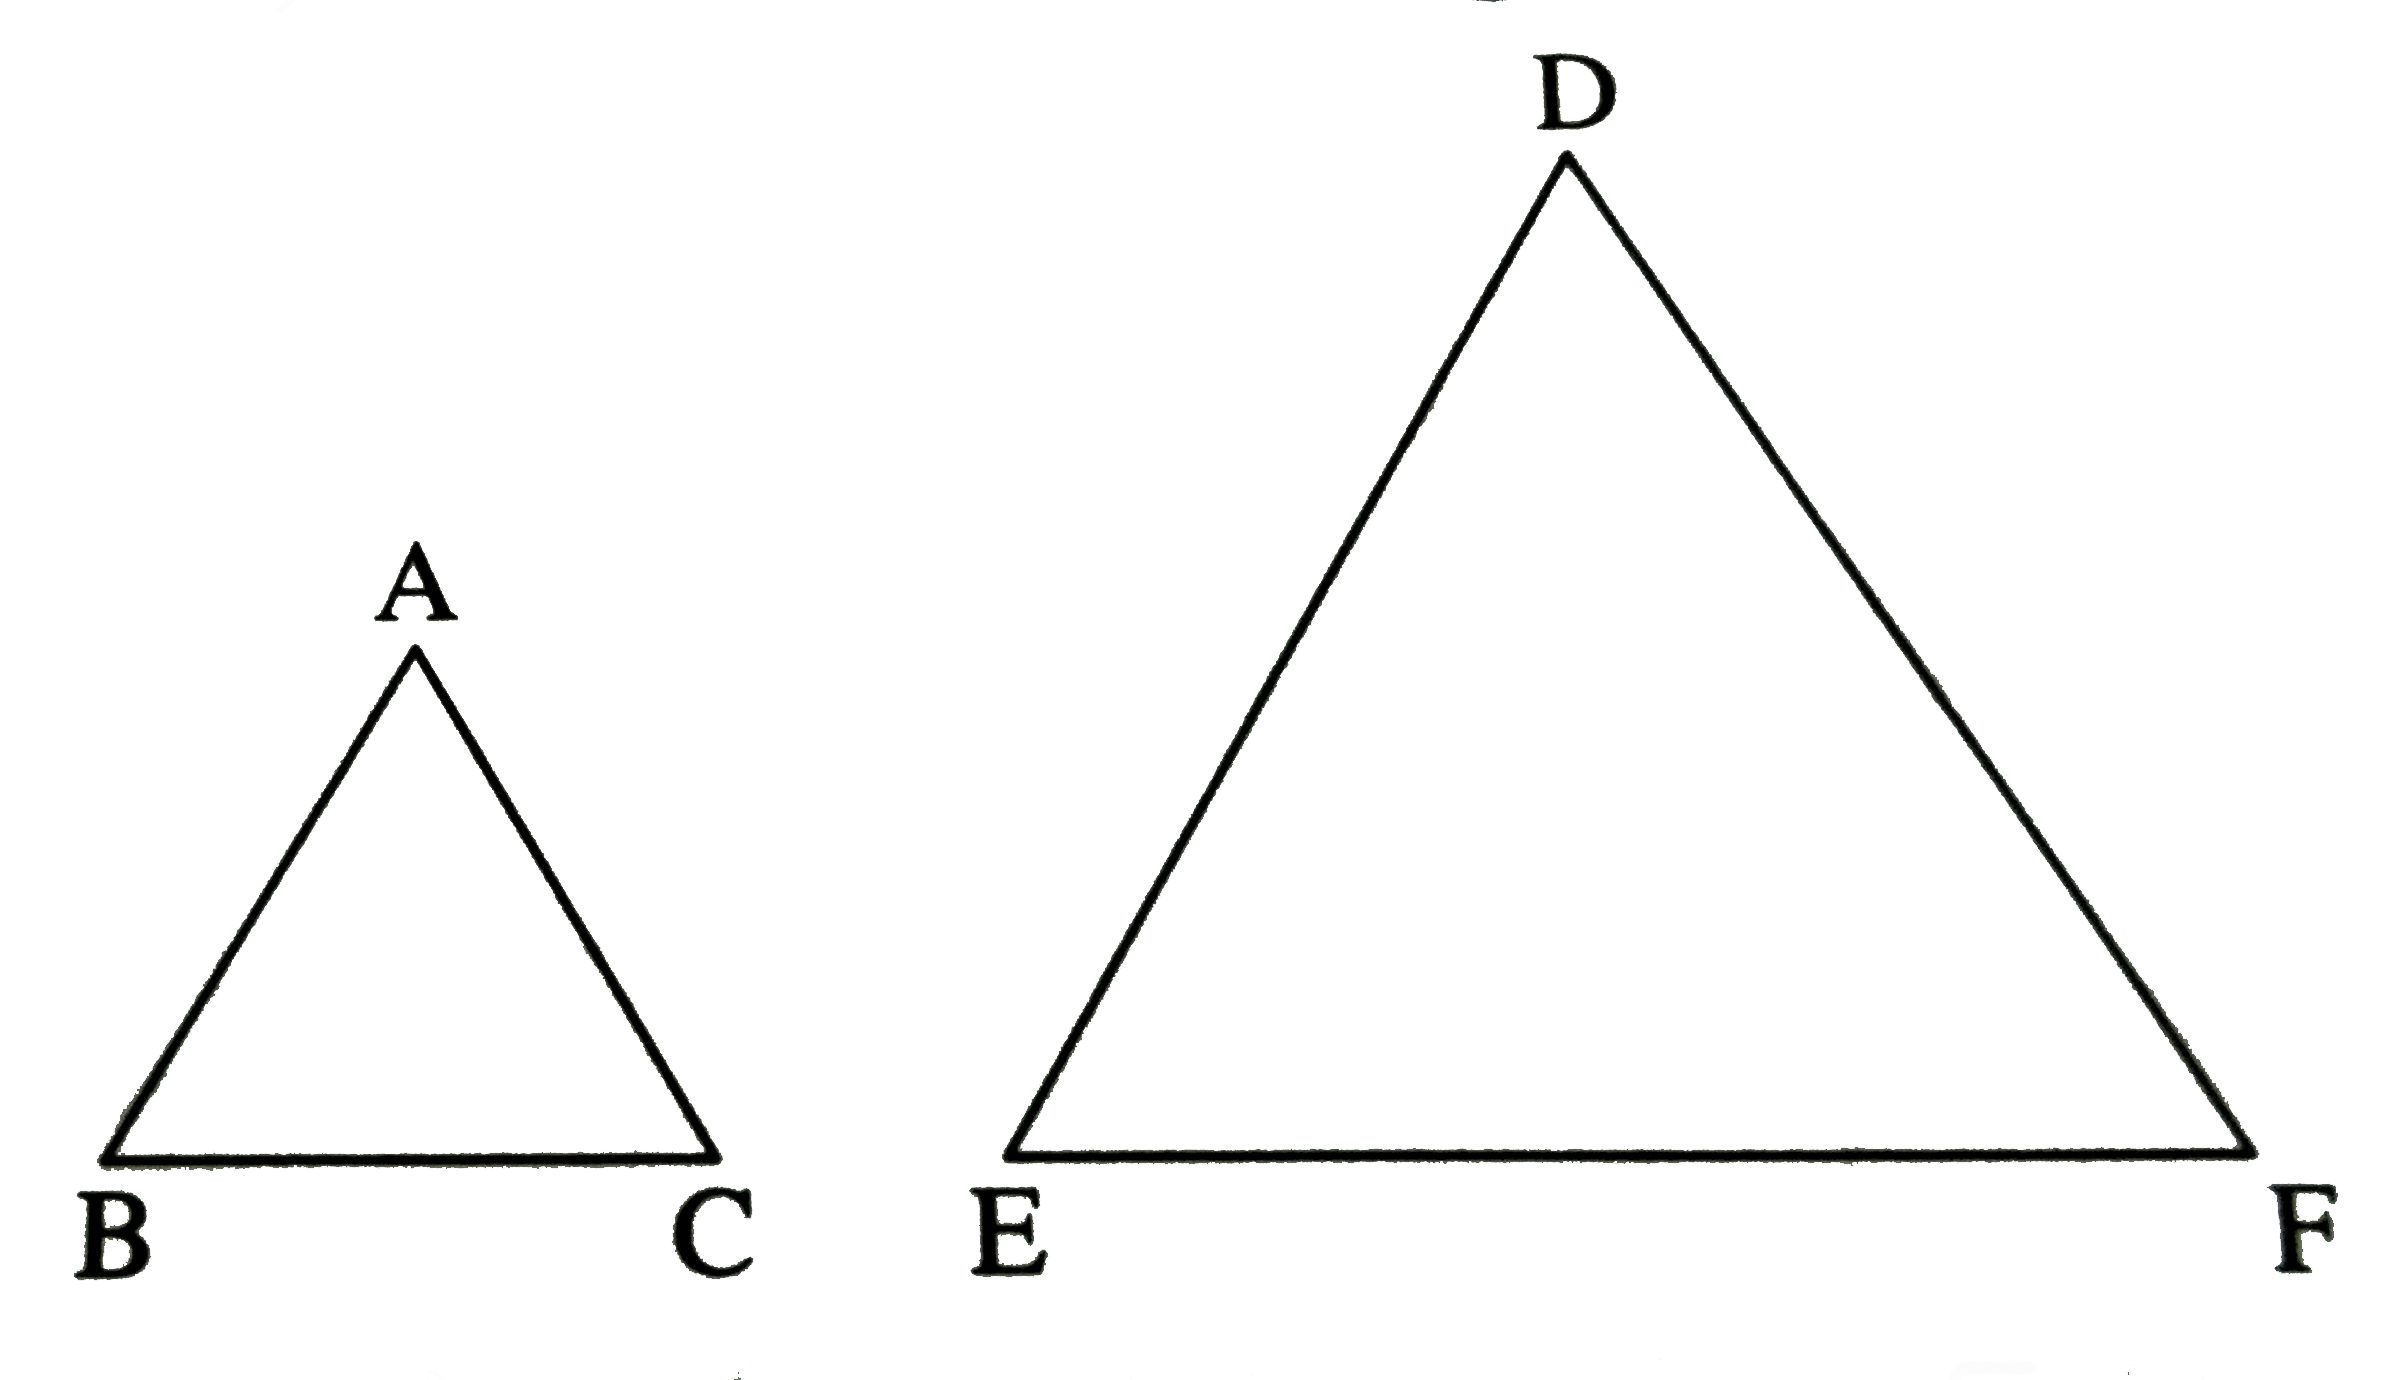
View SolutionΔABC and ΔDEF are equilateral triangles, A(ΔABC):A(ΔDEF)=1:2
If AB=4 then what is length of DE?

View SolutionIf sinx = 34 , then cos x = ?
View SolutionMatch the following lists:

View SolutionHow many lines of symmetry does the above figure have ?
View SolutionWhich of the following are correct chain isomers of butane ? (i)
View SolutionDetermine the point of symmetry of a regular hexagon.
View SolutionDtermine the images of the following figure about the given line :
View SolutionMatch the following Column A to Column B

View SolutionMatch the following Column A to Column B

View SolutionMatch the following Column A to Column B

View SolutionThe inequation represented by the graph given below is :
View SolutionThe inequation that best describes the graph given below is _________
View SolutionThe inequation that best describes the following graph is _________
View SolutionWhich inequations represent the shaded region in the given figure
View Solution
