Given below is a graph drawn on the parameters of growth versus time A,B and C respectively represent.
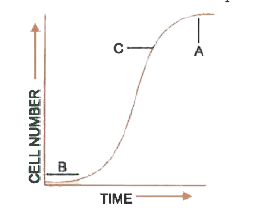
Exponential phase, log phase and steady state phase
Steady state phase, lag phase and log phase
Log phase, steady state phase and logarithmic phase
Log phase, lag phase and steady state phase
The correct Answer is:B
Step by step video & text solution for Given below is a graph drawn on the parameters of growth versus time A,B and C respectively represent. by Biology experts to help you in doubts & scoring excellent marks in Class 12 exams.
Updated on:21/07/2023समान प्रश्न
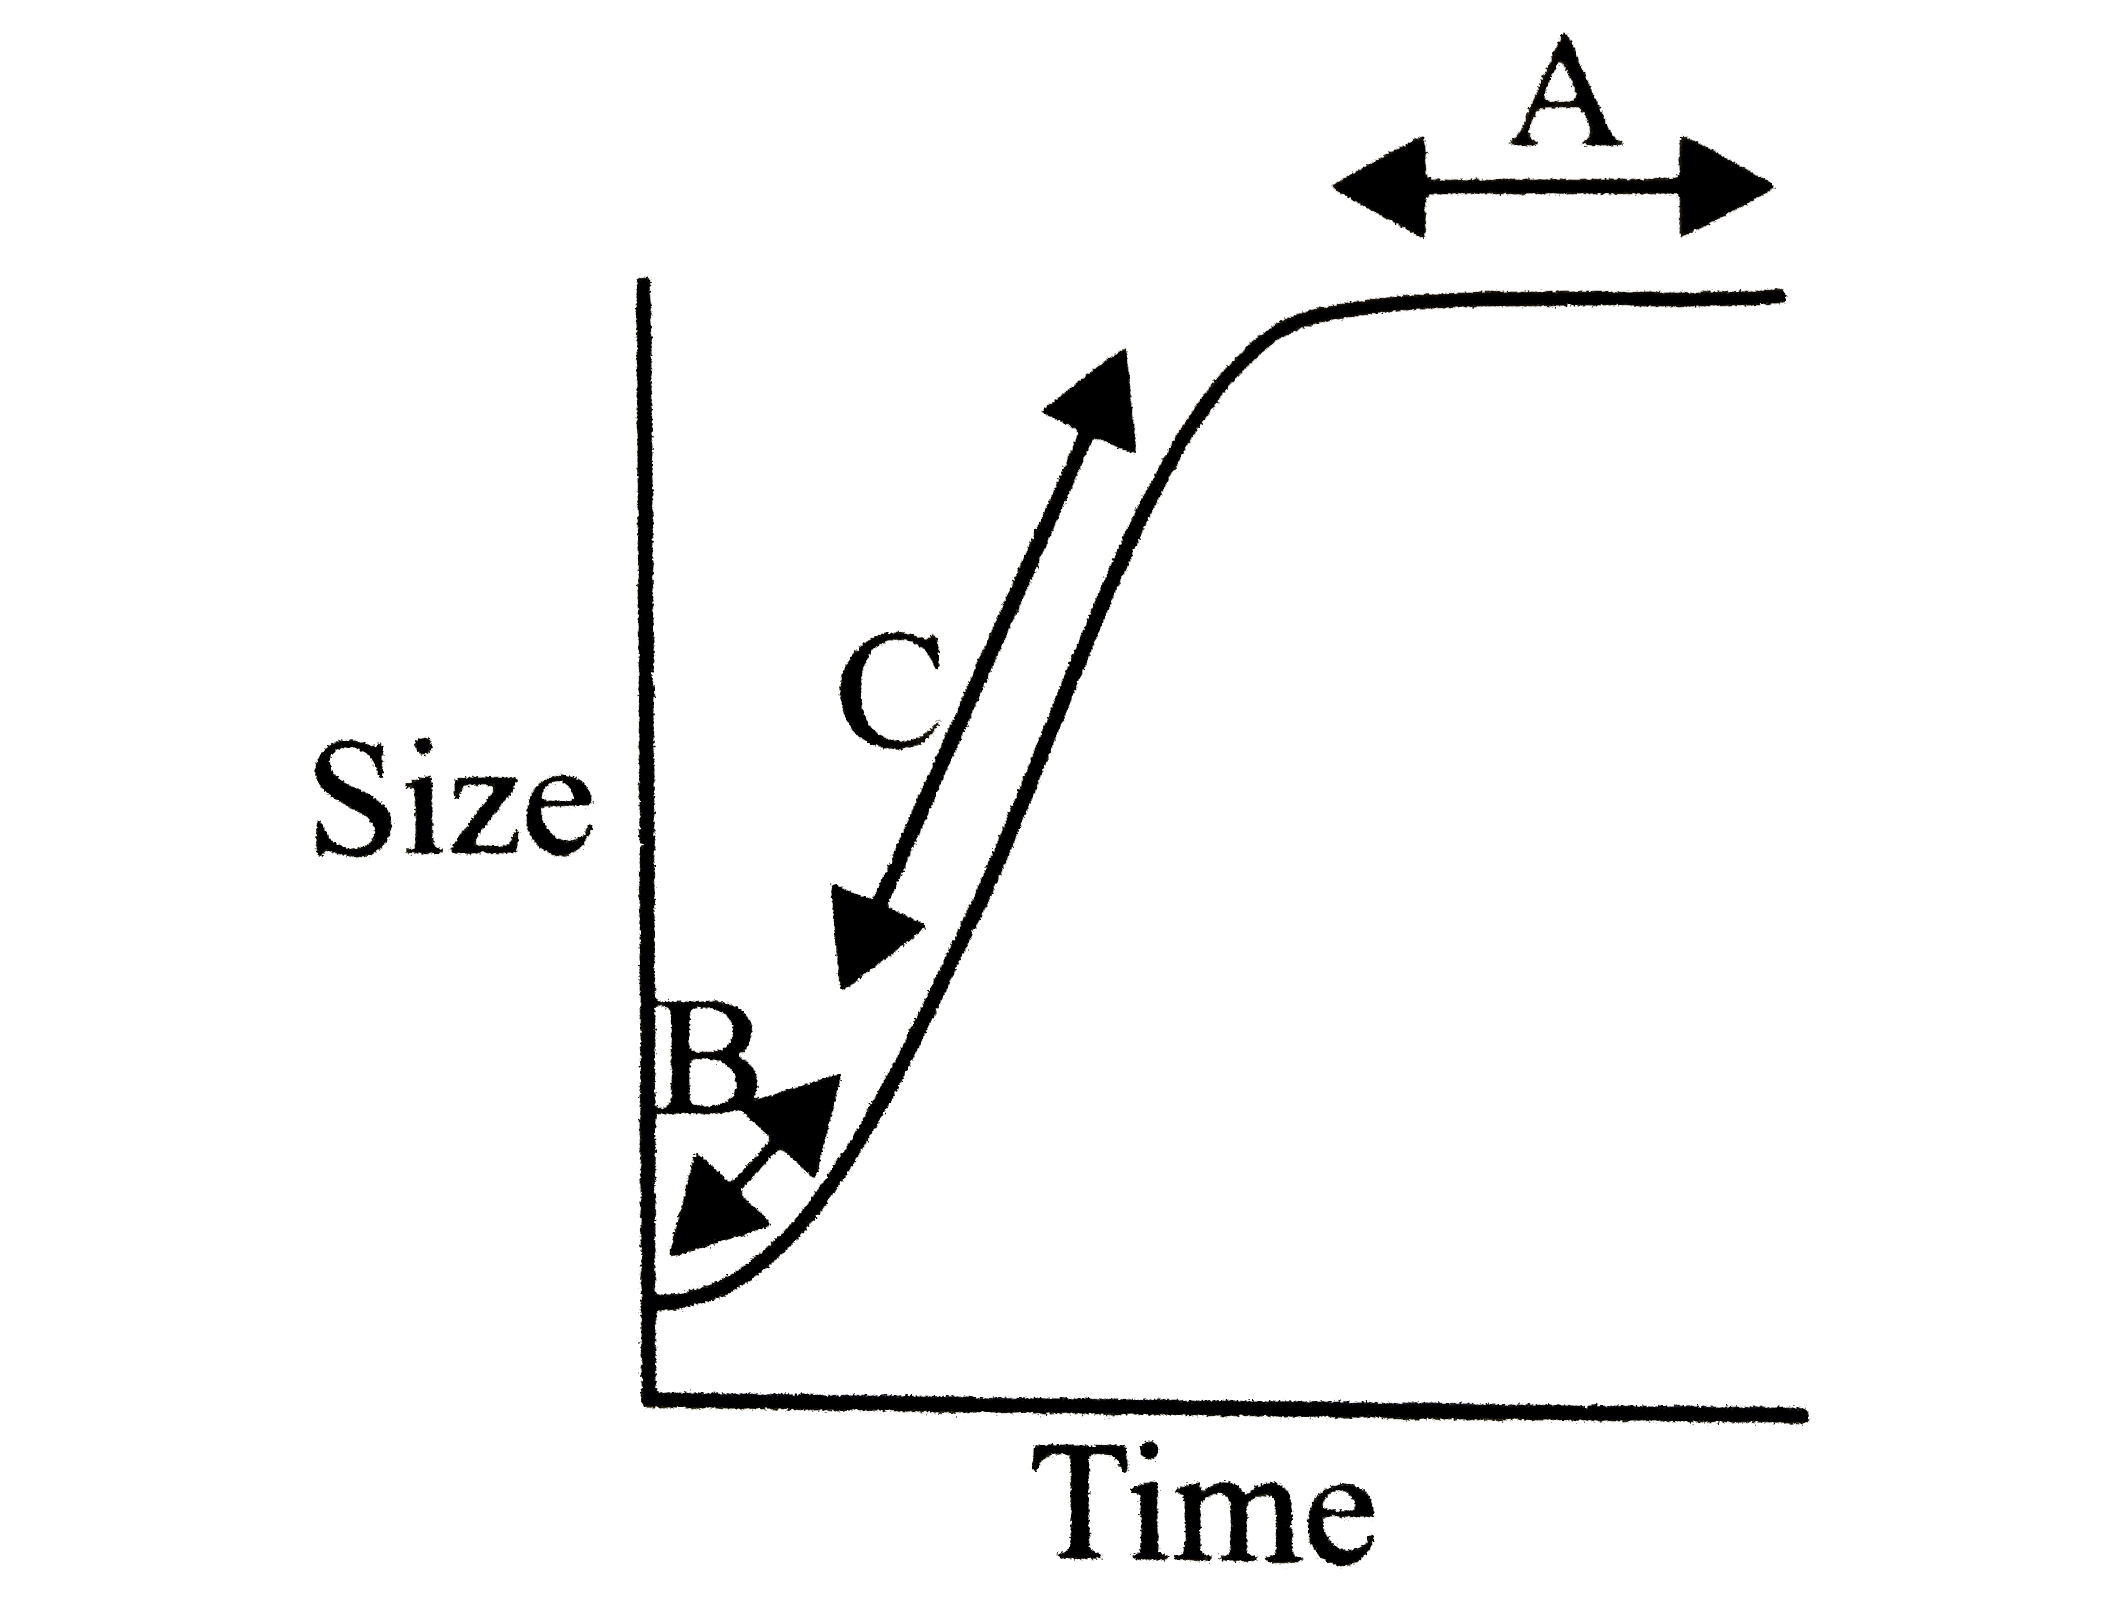
Given below is a graph drawn on the parameters of growth versus time A,B and C respectively represent.

View SolutionThe graph below is plotted between growth scale and time. In this graph A, B, C are respectively
View SolutionGiven graph is drawn on the parameters of growth versus time. Here A,B and C respetively represent
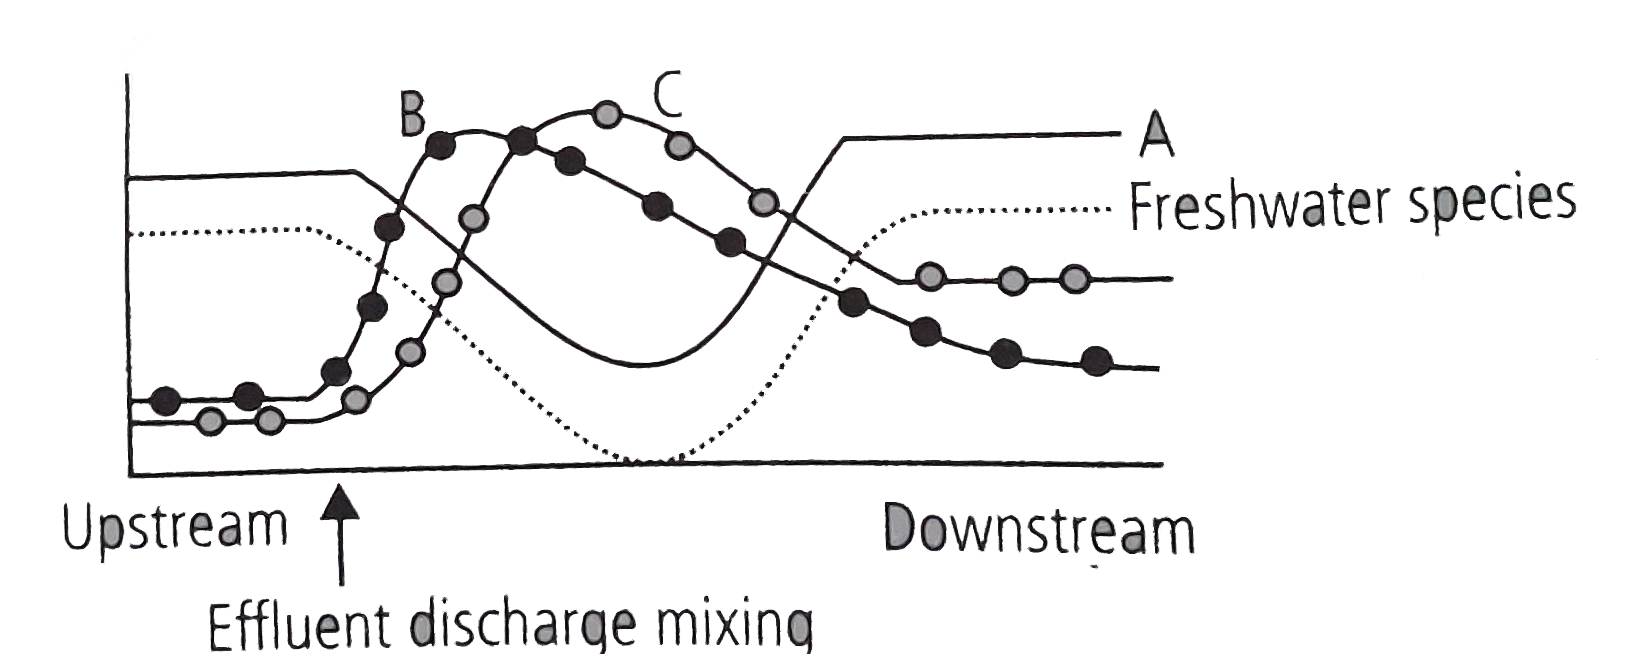
View SolutionThe graph given below represents changes in different ecological parameters due to effluent mixing in a stream. The three lines A, B anc C represent
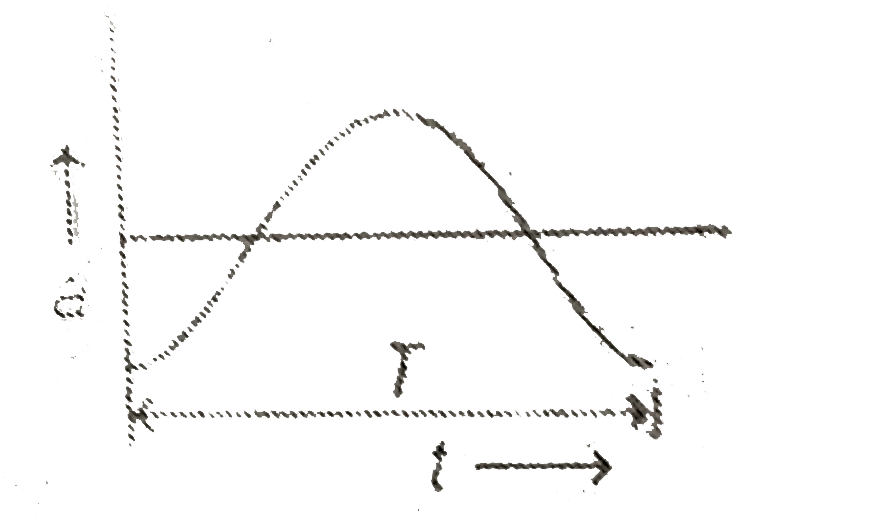
View SolutionAcceleration versus time graph of a body in SHM is given by a curve shown below. T is the time period. Then corresponding graph between kinetic energy KE and time t is correctly represented by
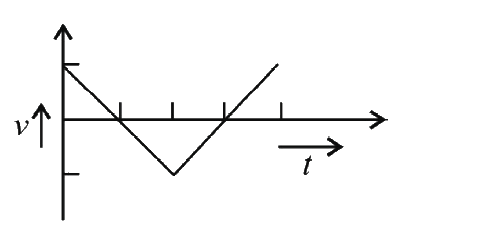
View SolutionThe graph below shws the velocity versus time graph for a body Which of the following graph represents the corresponding acceleration v//s time graph?
View SolutionThe graph in figure shows the velocity v versus time t for a body. Which of the graphs shown in figure represents the correesponding acceleration versus time graphs ?
View Solution
