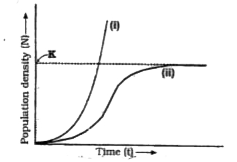
Study the population growth curves shown in the above diagram.
Which options is the best for curve (i) and (ii).
Type of (i) curveType of (ii) curveStatus of food & sapcefor curve (i)Status & space for curve (ii)Equation for curve (ii)Equation for curve (i)Logistic curveExponential curve Unlimited LimiteddNdt=rNdNdt=rN(K−NK)
Type of (i) curveType of (ii) curveStatus of food & sapcefor curve (i)Status & space for curve (ii)Equation for curve (ii)Equation for curve (i)Exponential curveLogistic curve Unlimited LimiteddNdt=rN(K−NK)dNdt=rN
Type of (i) curveType of (ii) curveStatus of food & sapcefor curve (i)Status & space for curve (ii)Equation for curve (ii)Equation for curve (i)Logistic curveExponential curve Limited UnlimiteddNdt=rN(K−NK)dNdt=rN
Type of (i) curveType of (ii) curveStatus of food & sapcefor curve (i)Status & space for curve (ii)Equation for curve (ii)Equation for curve (i)Exponential curveLogistic curve Limited UnlimiteddNdt=rNdNdt=rN(K−NK)
The correct Answer is:B
Similar Questions
Knowledge Check
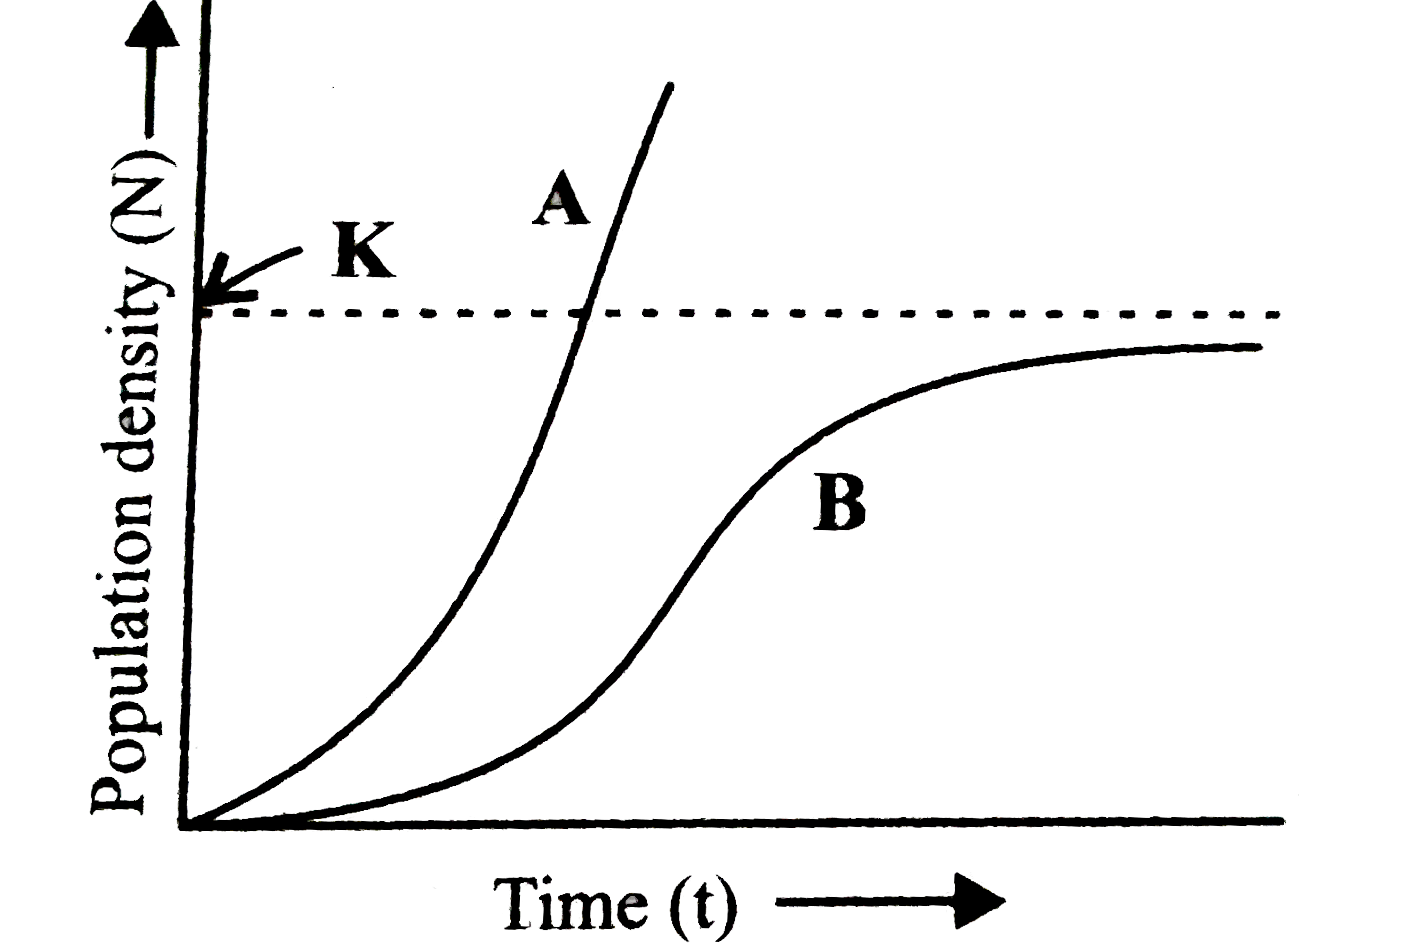
Study the population growth curves (A and B) in the given graph and select the incorrect option.
 ACurve 'A' shows exponential growth, represented by equation dNdt=rN.BCurve 'B' shows logistic growth, represented by equation dNdt=rN(K−NK)CExponential growth curve is considered as more realistic than the logistic growth curve.DCurve 'A' can also be represented by equation Nt=N0ert.
Study the population growth curves (A and B) in the given graph and select the incorrect option.
 ACurve 'A' shows exponential growth, represented by equation dNdt=rN.BCurve 'B' shows logistic growth, represented by equation dNdt=rN(K−NK)CExponential growth curve is considered as more realistic than the logistic growth curve.DCurve 'A' can also be represented by equation Nt=N0ert.
Population growth curve is sigmoid, if the growth pattern is
ALogisticBGeometricCExponentialDAccretionary
Study the population growth curves shown above
(i) Identify curves'a'and'b'.
(ii) Mention the conditions responsible for the curves 'a' and 'b' respectively.
(iii) Give the necessary eqution for the curve 'b'
View SolutionStudy the population growth curves shown above
(i) Identify curves'a'and'b'.
(ii) Mention the conditions responsible for the curves 'a' and 'b' respectively.
(iii) Give the necessary eqution for the curve 'b'
View SolutionPopulation growth curve in most animals , except humans, is
View SolutionPopulation growth-curve is sigmoid, if the growth pattern is
View SolutionIn the logistic population growth curve shown below, the rate of growth is greatest at which point?

View Solution

