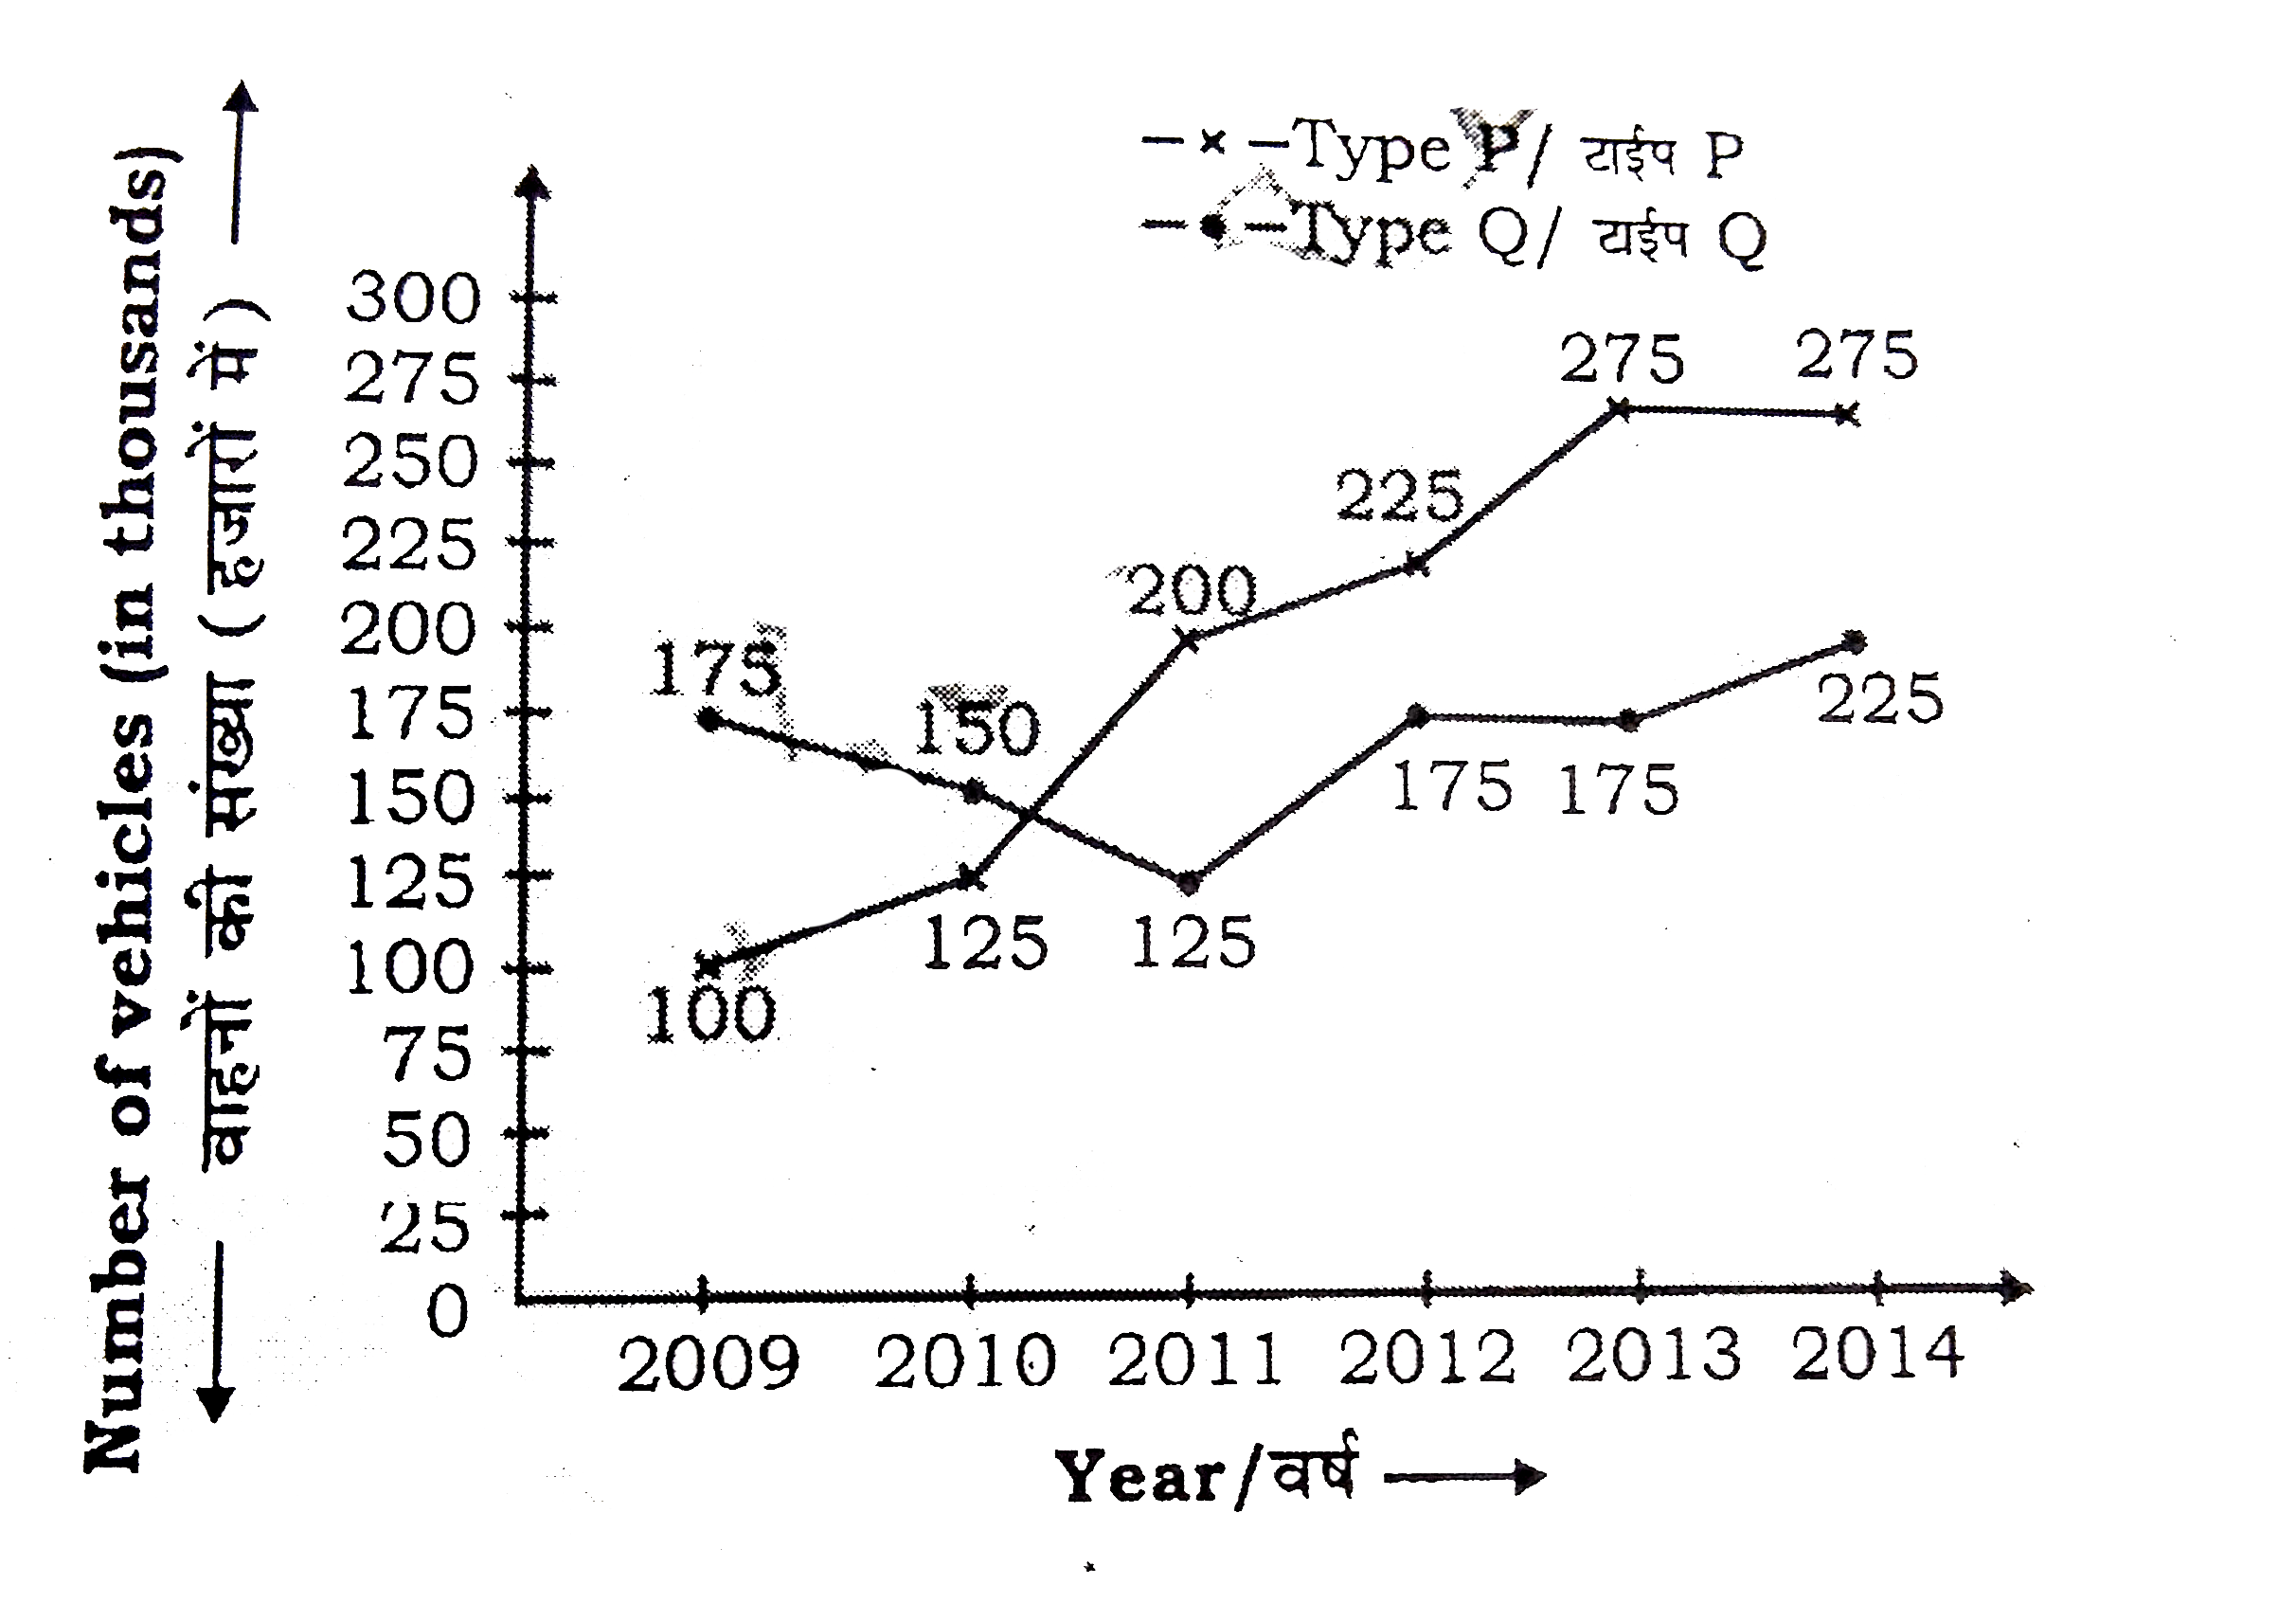
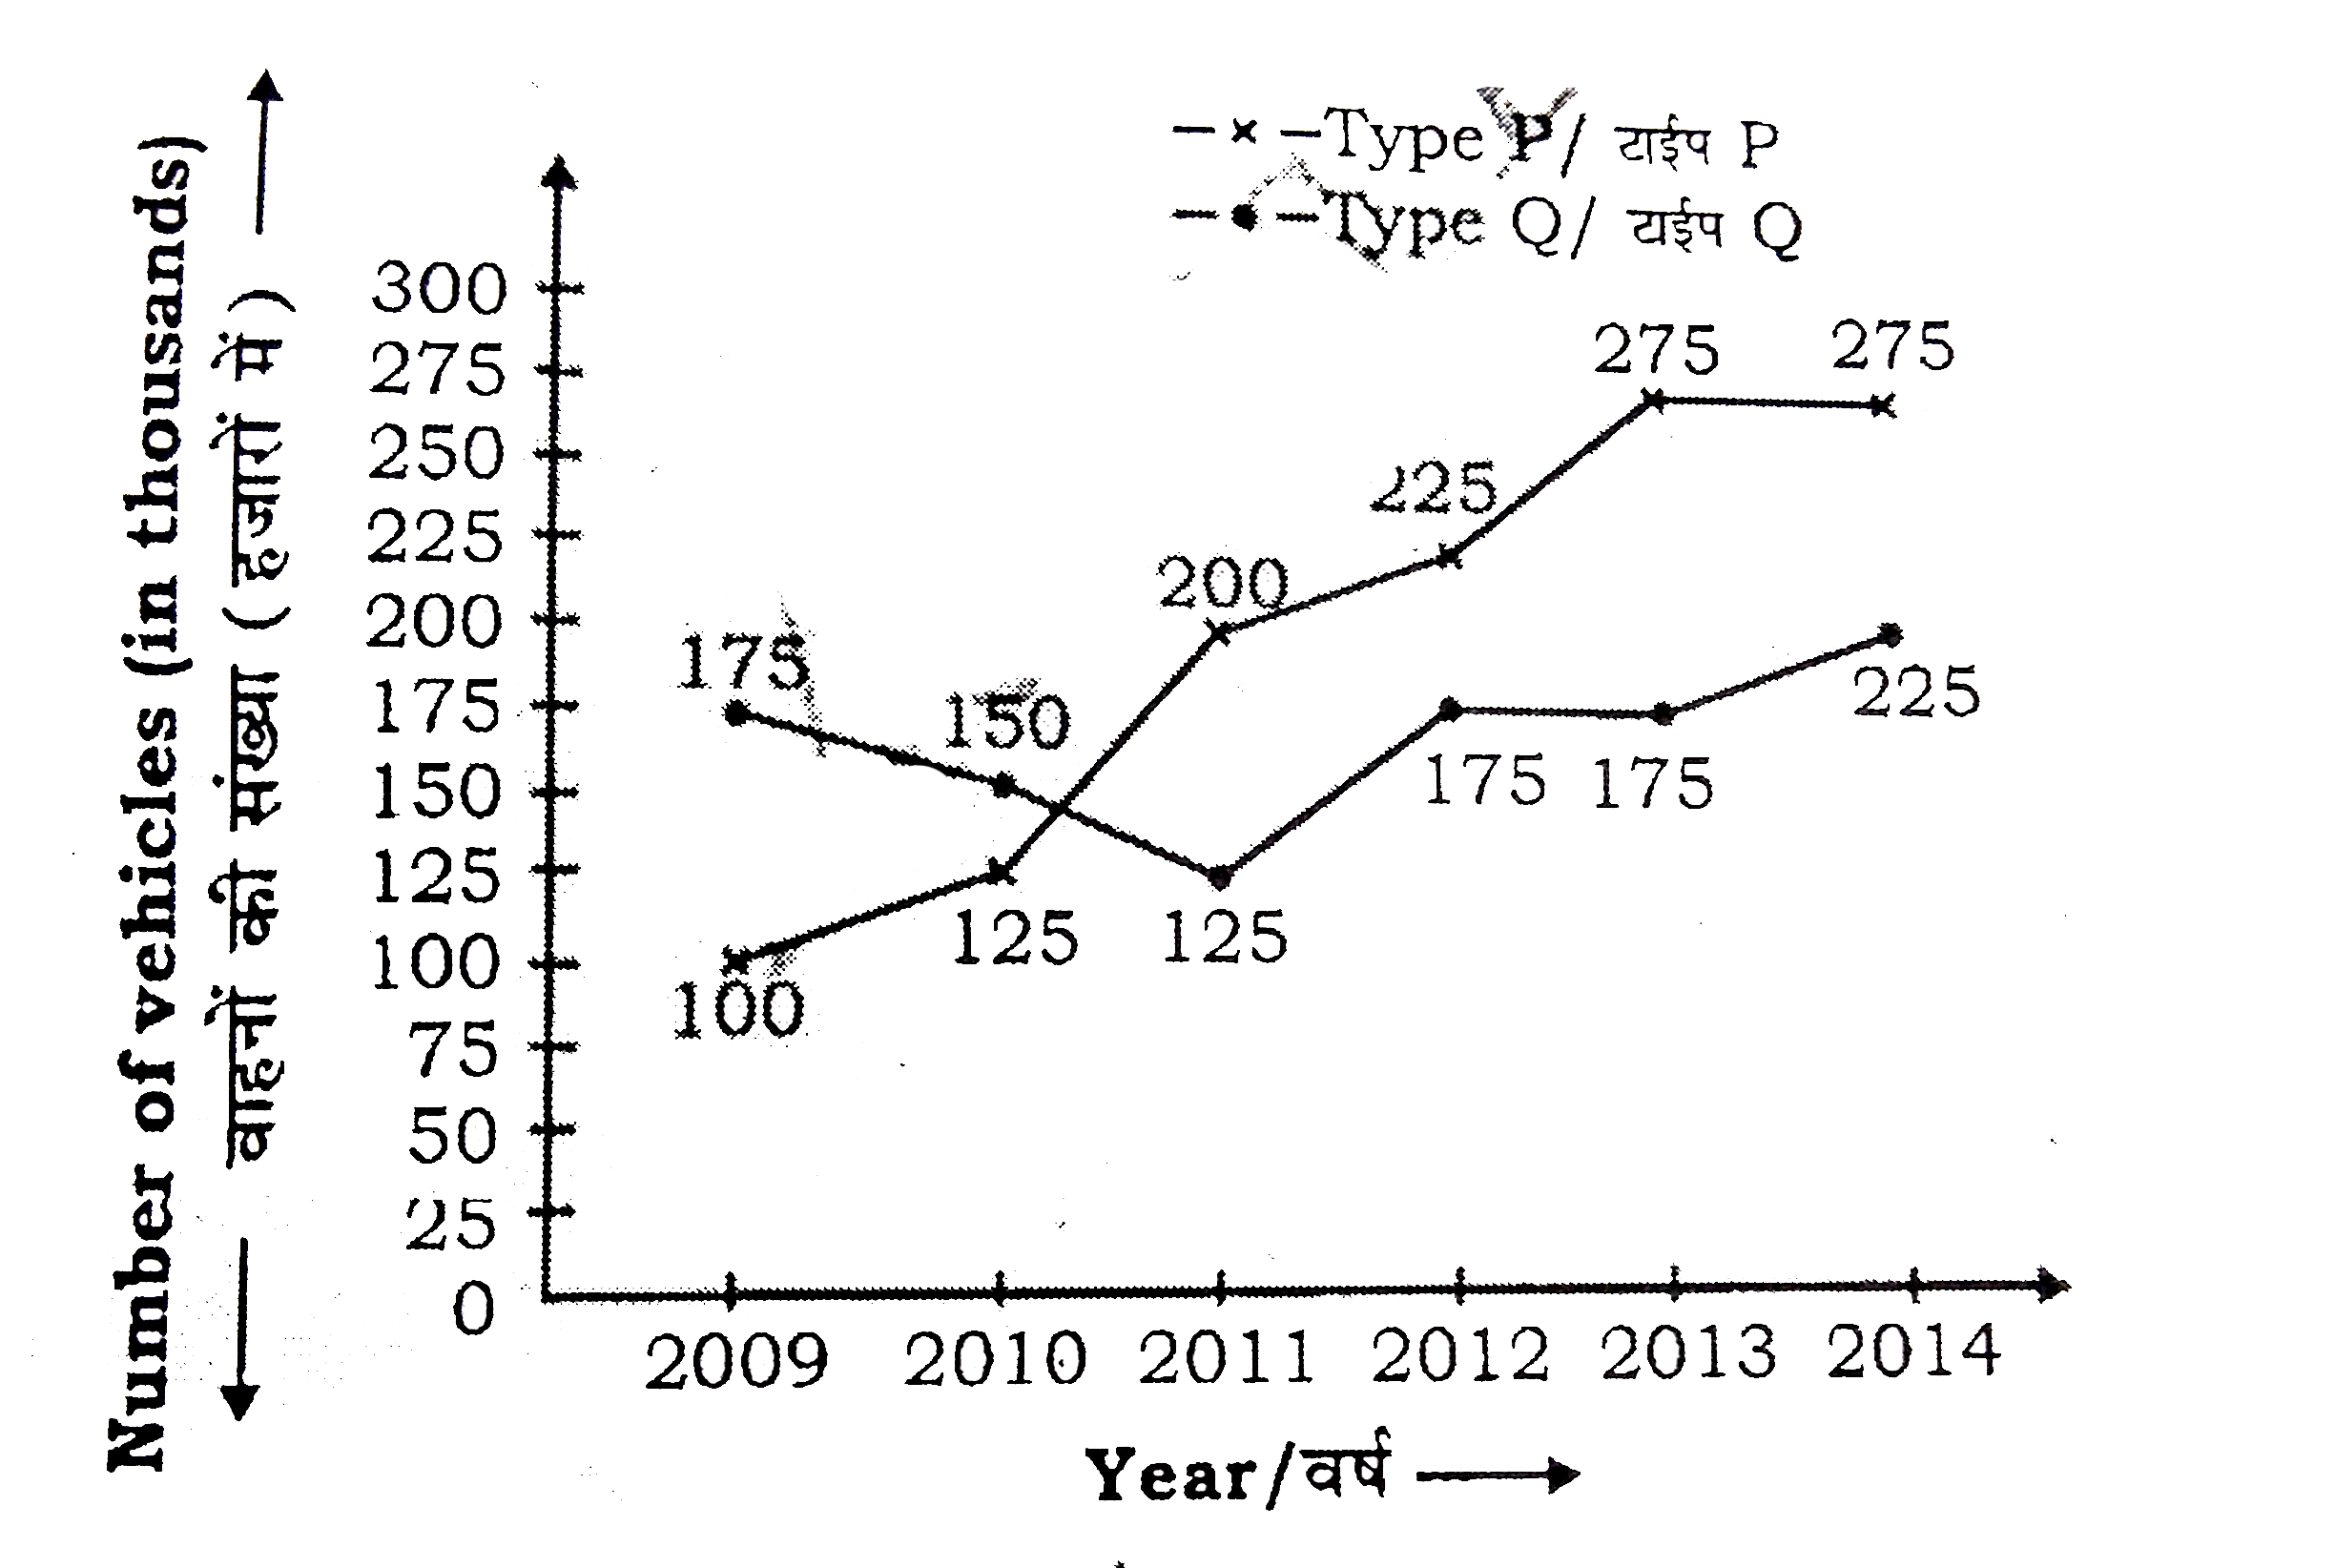
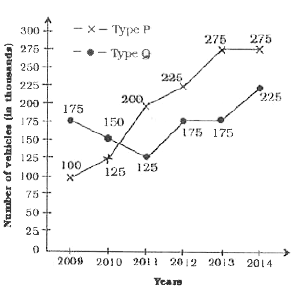
The following graph shows production (in thousands) of two types (P and Q) of vehicles by a factory over the years 2009 to 2014. Study the graph and answer the given questions.
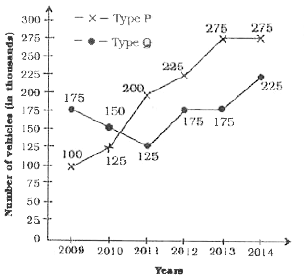
In how many of the given years, was the production of Type P vehicles of the comapny more than the average production of this type vehicles in the given years ?
2
4
5
3
Step by step video solution for The following graph shows production (in thousands) of two types (P and Q) of vehicles by a factory over the years 2009 to 2014. Study the graph and answer the given questions. In how many of the given years, was the production of Type P vehicles of the comapny more than the average production of this type vehicles in the given years ? by Maths experts to help you in doubts & scoring excellent marks in Class 14 exams.
Updated on:21/07/2023Topper's Solved these Questions
Similar Questions
If the product of two positive numbers be 1575 and their ratio is 7:9, then the greater number is
यदि दो धनात्मक संख्याओं का गुणनफल 1575 है तथा उनका अनुपात 7:9 है, तो बड़ी संख्या को ज्ञात करें?
View SolutionTwenty one times of a positive numer is less than its square by 100. The value of the positive number is
View Solutionनिर्देश :- निम्नलिखित ग्राफ में एक फैक्ट्री द्वारा वर्ष तक वाहन के दो प्रकार (एवं )के उत्पादन को (हज़ार में ) दर्शाया गया है ग्राफ का अध्ययन कीजिये और नीचे दिए गए पांच प्रश्नो का उत्तर दीजिये :
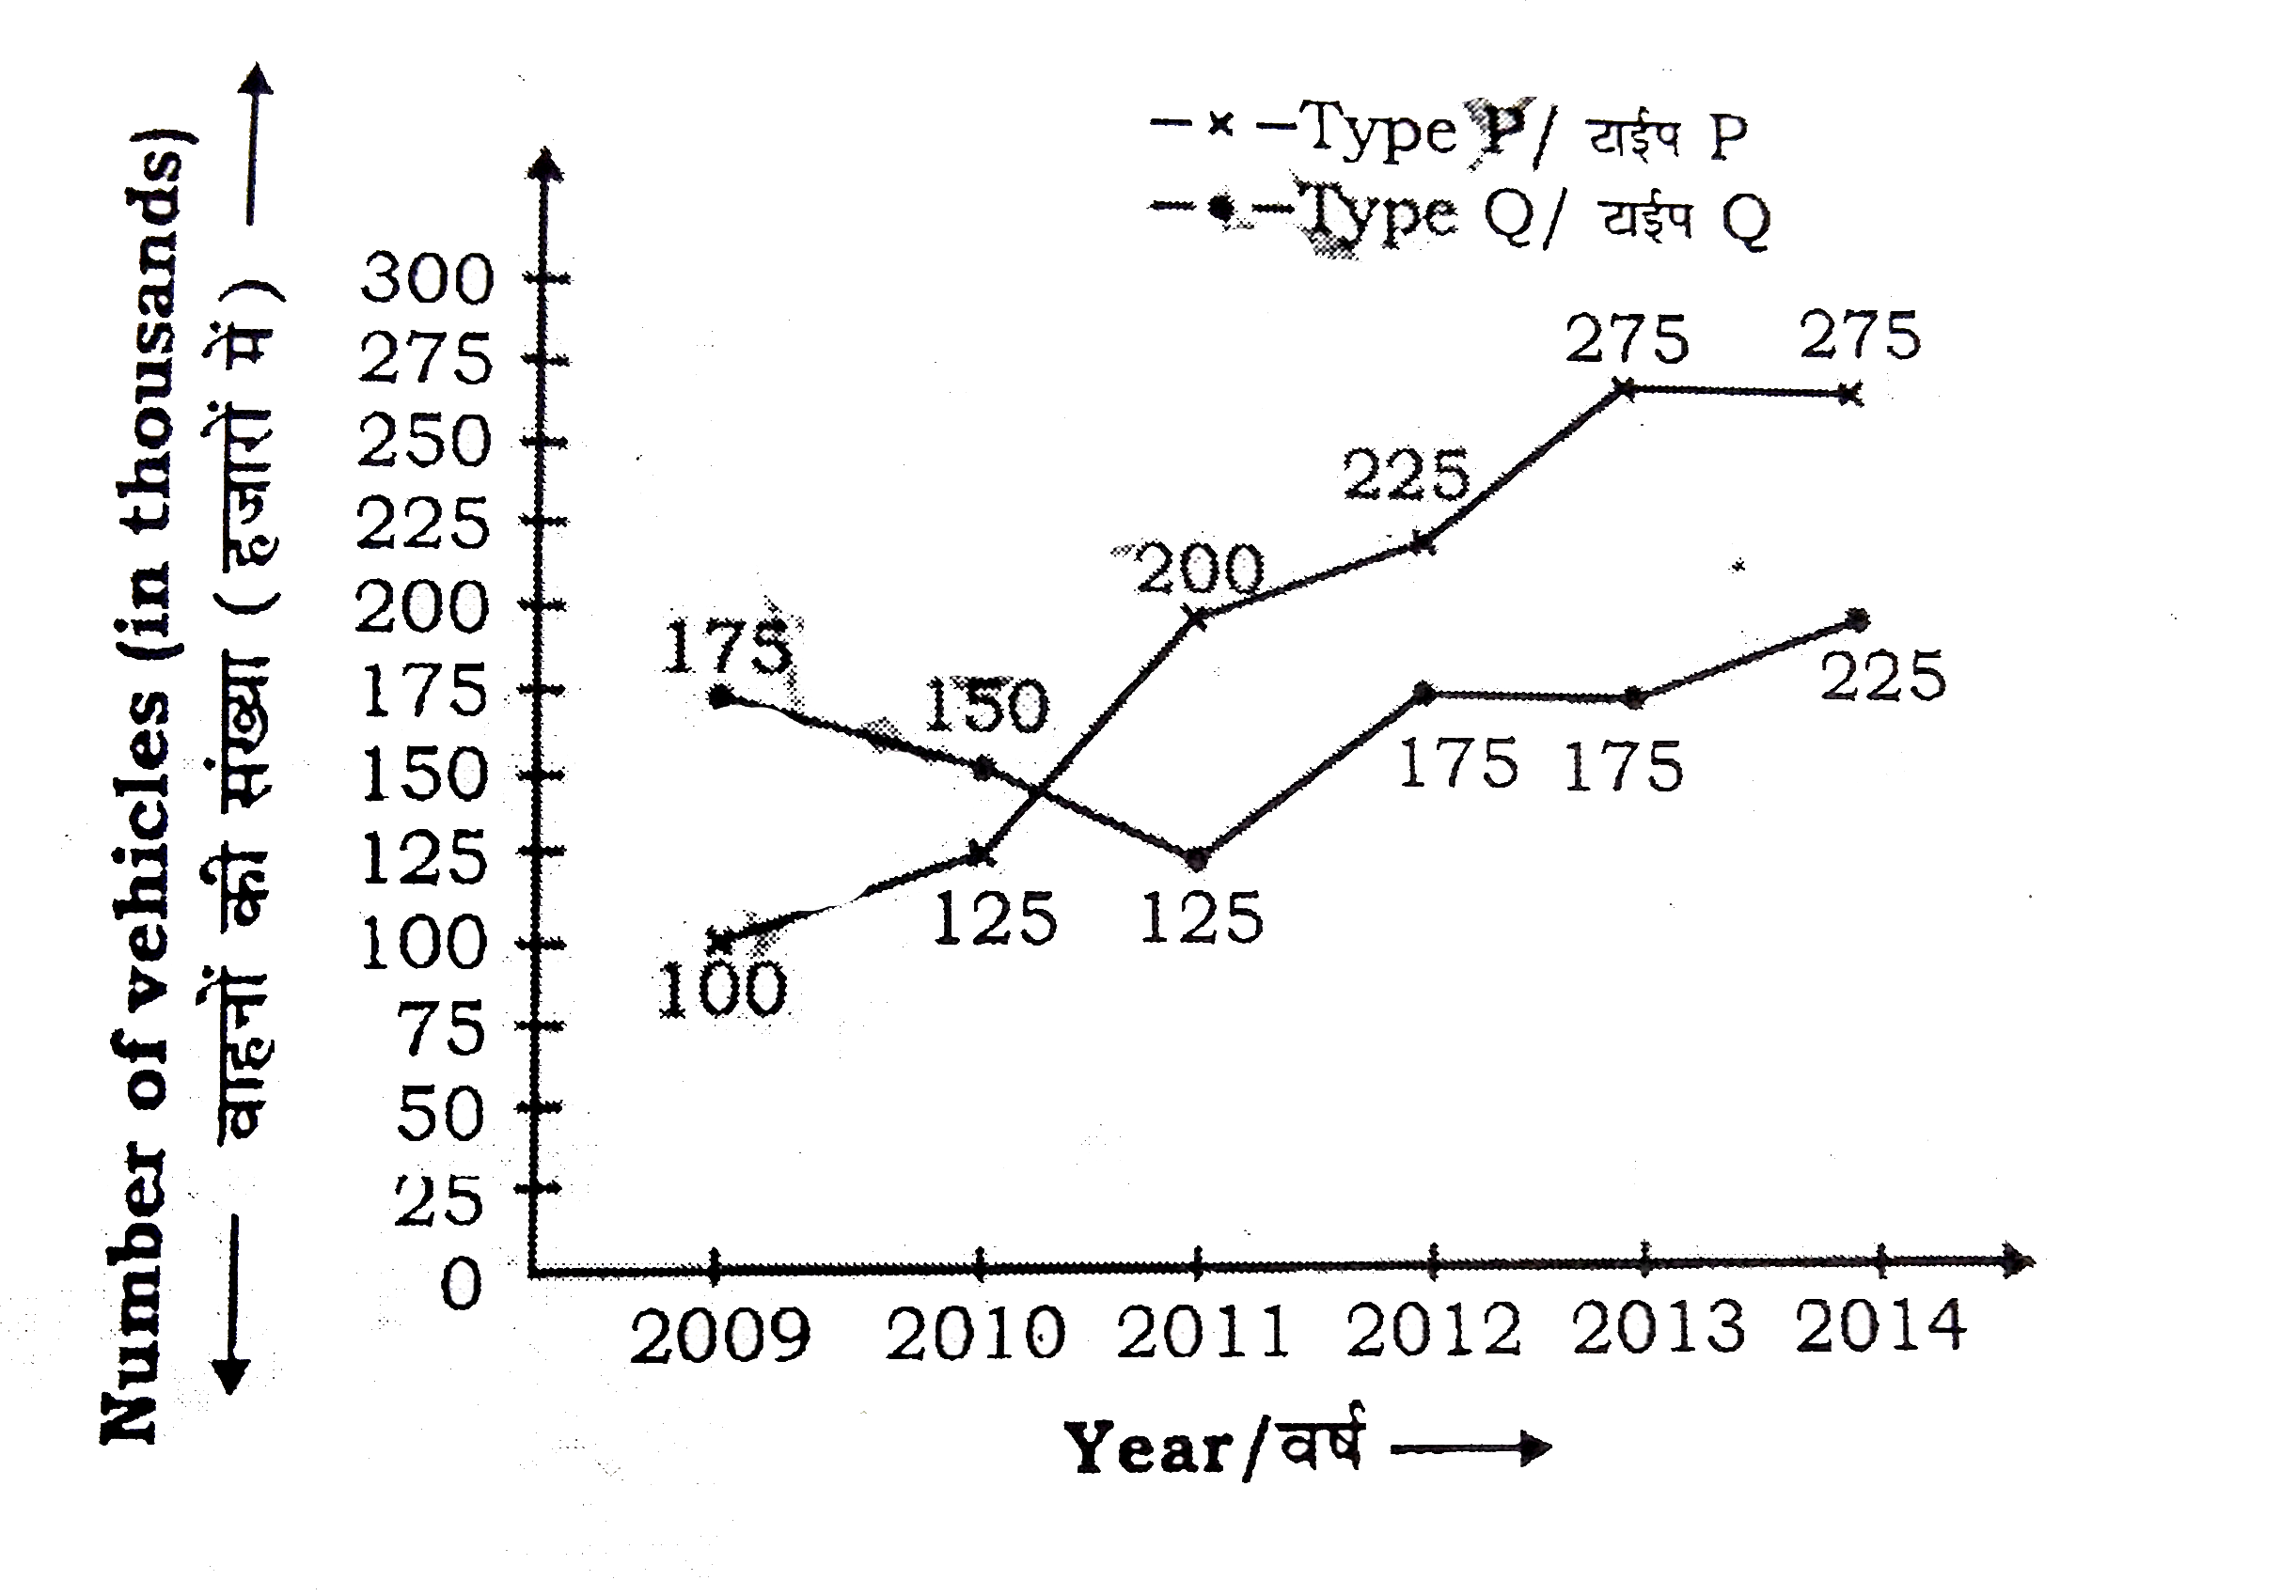
वर्ष 2010 से 2011 तक टाइप Q वाहनों के उत्पादन में लगभग कितने प्रतिशत कमी आई ?
View Solutionनिर्देश :- निम्नलिखित ग्राफ में एक फैक्ट्री द्वारा वर्ष तक वाहन के दो प्रकार (एवं )के उत्पादन को (हज़ार में ) दर्शाया गया है ग्राफ का अध्ययन कीजिये और नीचे दिए गए पांच प्रश्नो का उत्तर दीजिये :
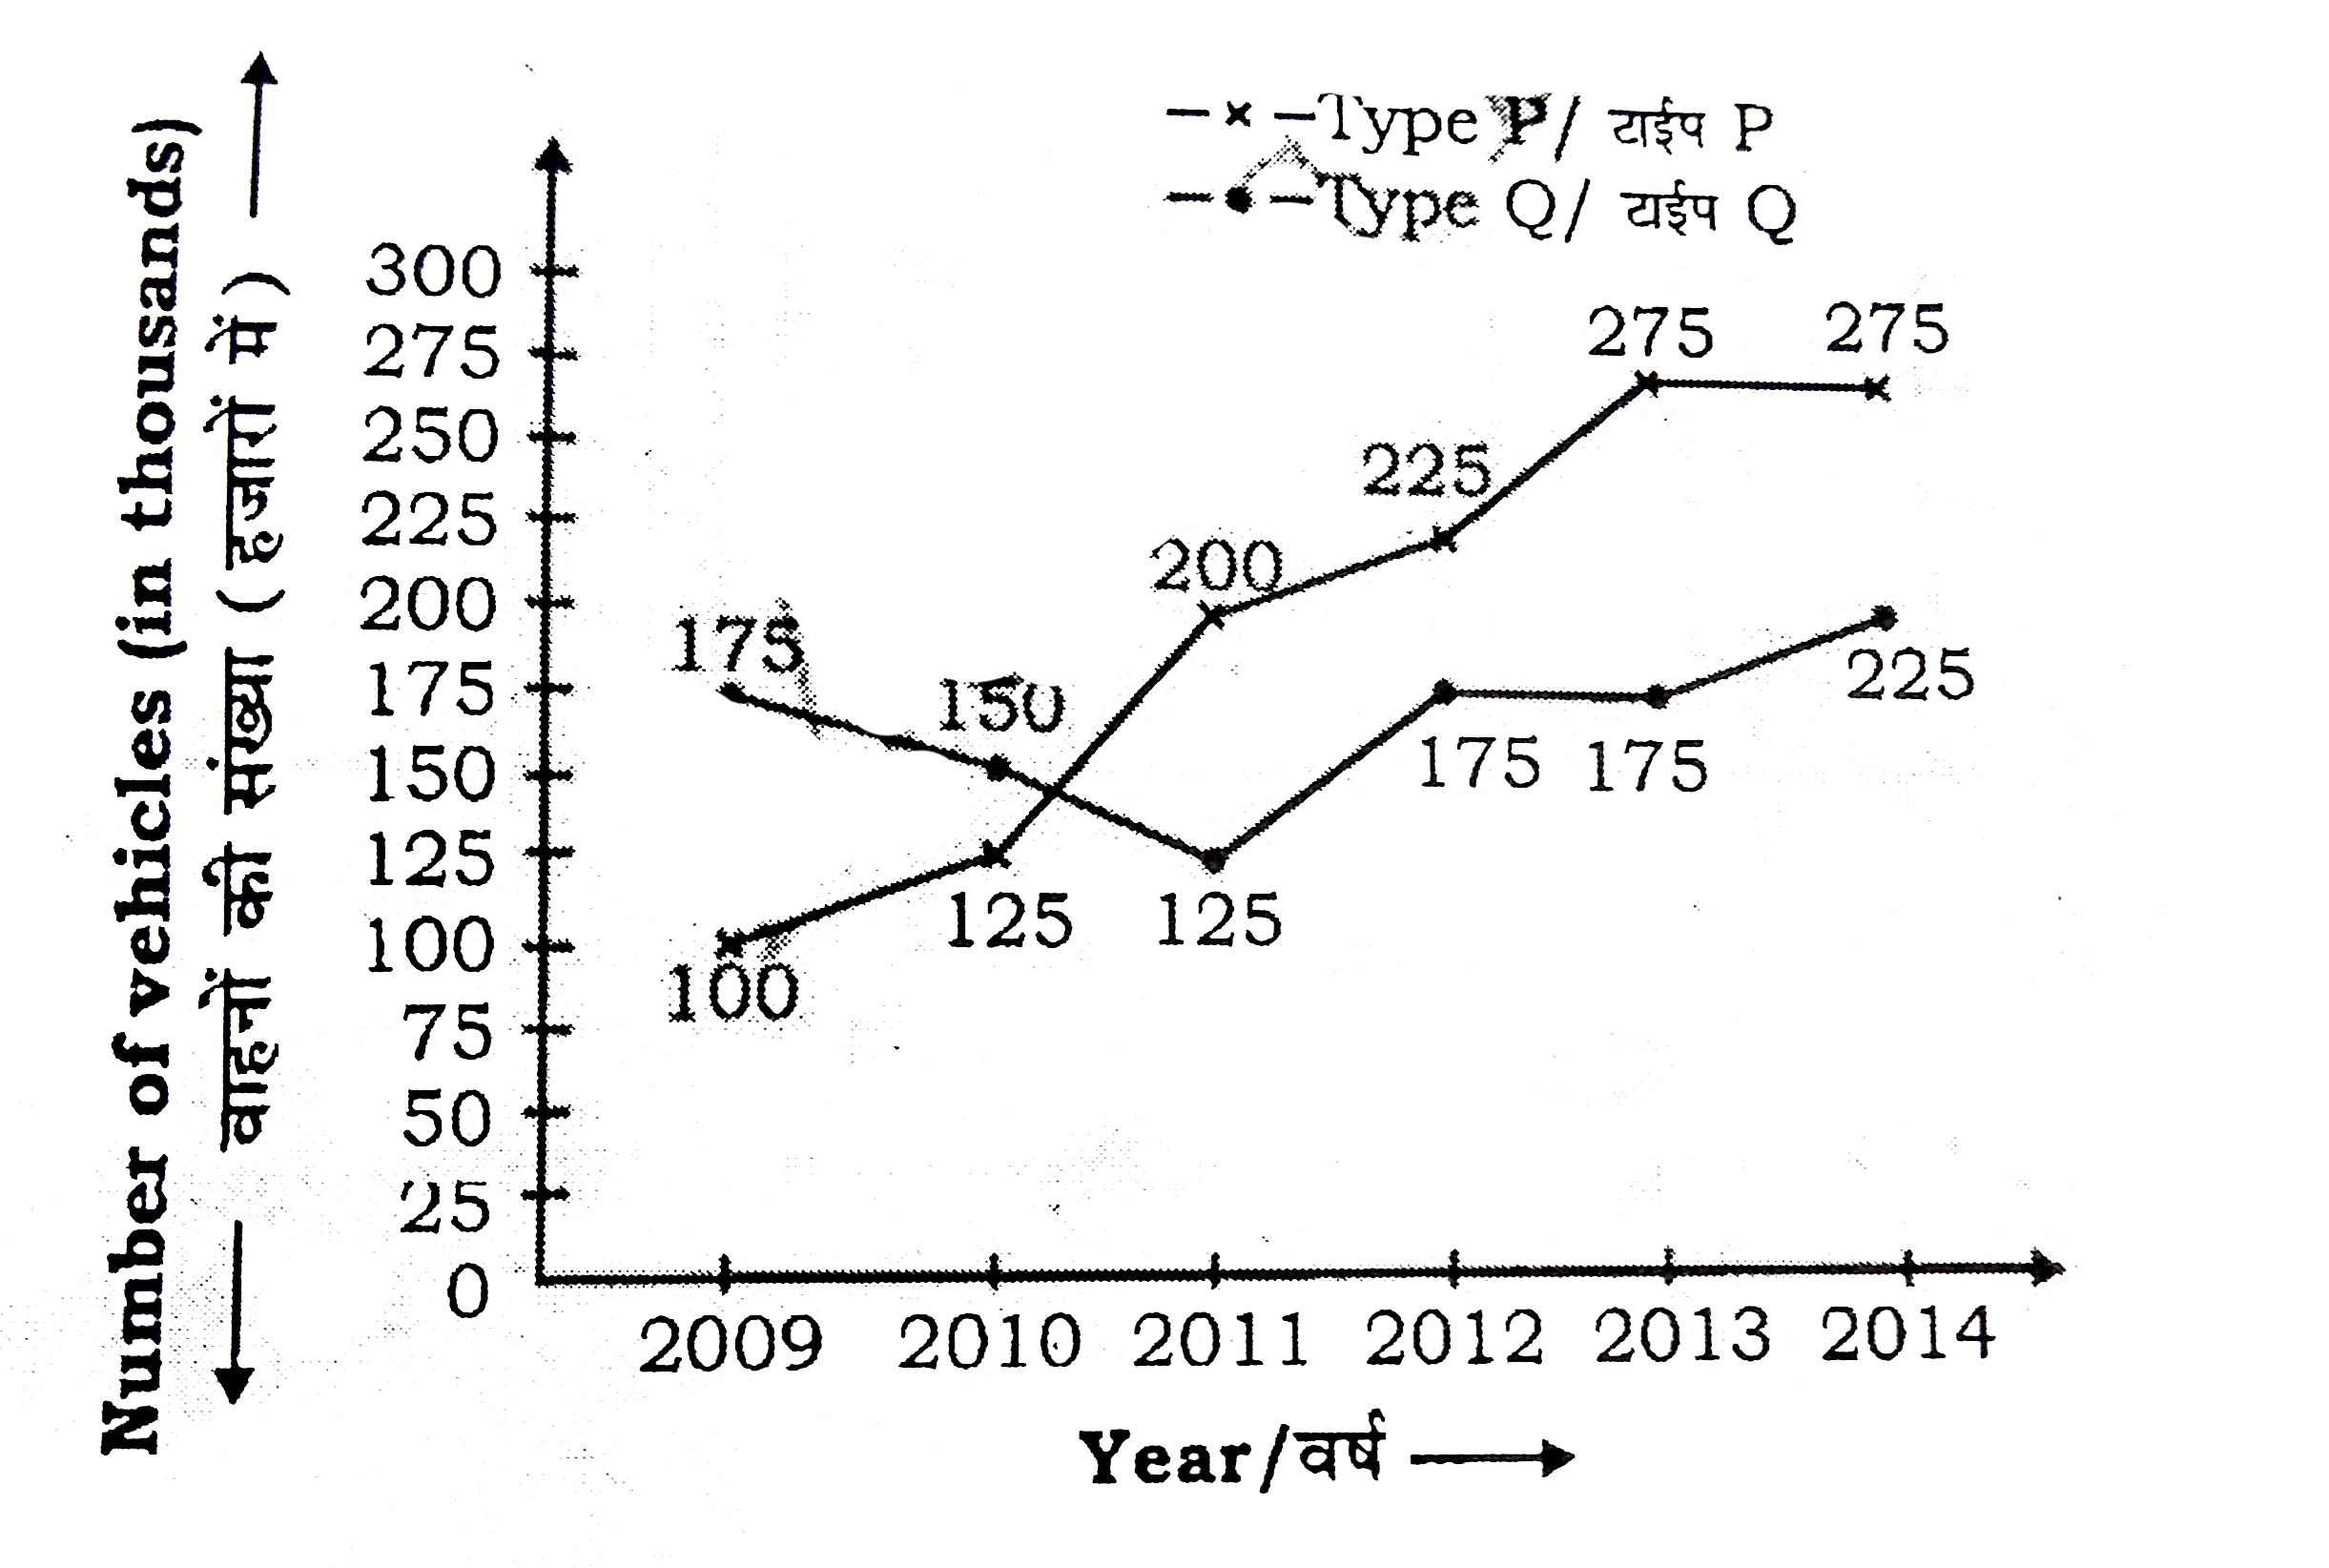
दिए गए वर्षो में टाइप P वाहनों के कुल उत्पादन और टाइप Q वाहनों के कुल उत्पादन का अनुपात क्या है ?
View Solutionनिर्देश :- निम्नलिखित ग्राफ में एक फैक्ट्री द्वारा वर्ष तक वाहन के दो प्रकार (एवं )के उत्पादन को (हज़ार में ) दर्शाया गया है ग्राफ का अध्ययन कीजिये और नीचे दिए गए पांच प्रश्नो का उत्तर दीजिये :
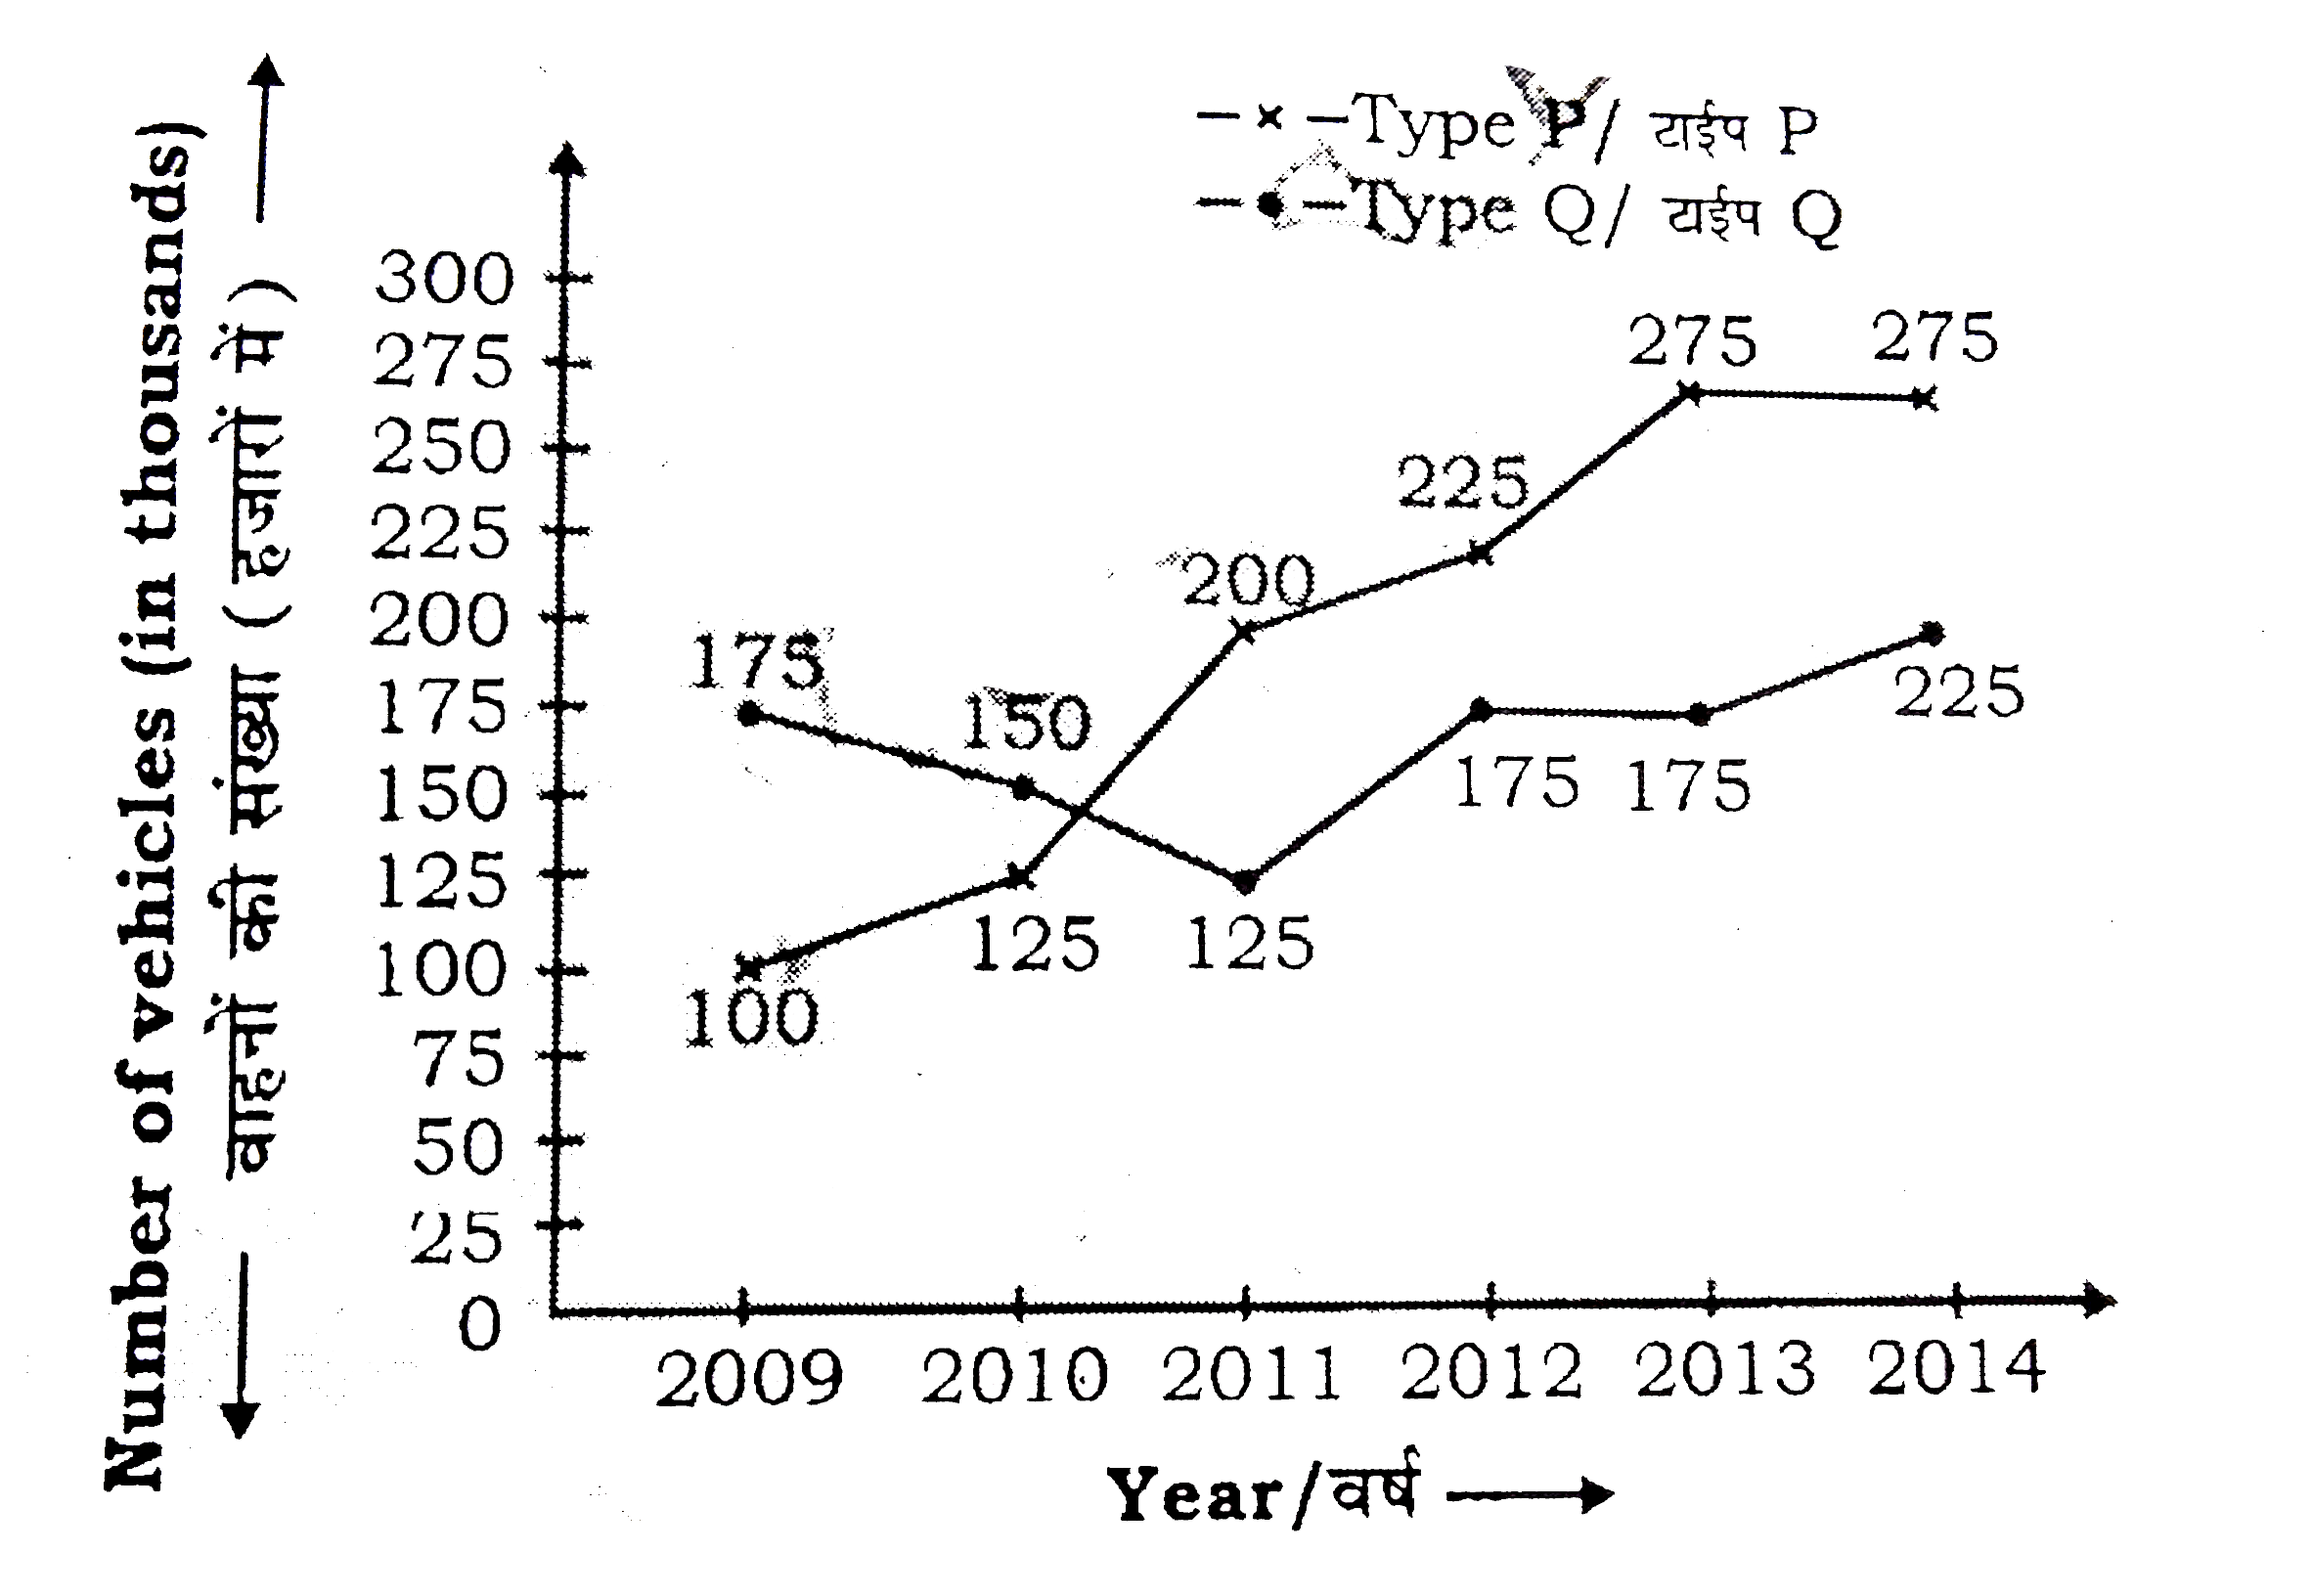
2010 में Q टाइप वाहनों का उत्पादन 2014 में टाइप P के उत्पादन का कितना प्रतिशत था ?
View Solutionनिर्देश :- निम्नलिखित ग्राफ में एक फैक्ट्री द्वारा वर्ष तक वाहन के दो प्रकार (एवं )के उत्पादन को (हज़ार में ) दर्शाया गया है ग्राफ का अध्ययन कीजिये और नीचे दिए गए पांच प्रश्नो का उत्तर दीजिये :
दिए गए कितने वर्षो में कंपनी की टाइप P वाहनों का उत्पादन दिए गए वर्षो में इस टाइप के वाहनों के औसत उत्पादन से कितना अधिक था ?
View Solutionनिर्देश :- निम्नलिखित ग्राफ में एक फैक्ट्री द्वारा वर्ष तक वाहन के दो प्रकार (एवं )के उत्पादन को (हज़ार में ) दर्शाया गया है ग्राफ का अध्ययन कीजिये और नीचे दिए गए पांच प्रश्नो का उत्तर दीजिये :
वर्ष 2009 और में टाइप P वाहनों का कुल उत्पादन 2010 और 2014 में टाइप Q के कुल उत्पादन का कितना प्रतिशत था ?
View SolutionThe inequation represented by the graph given below is :
View SolutionThe inequation that best describes the graph given below is _________
View SolutionThe inequation that best describes the following graph is _________
View SolutionStudy the following graph and answer the questions given below it. In how many of the given years was the production of salt more than the average production of the given years?
View SolutionThe following graph shows production (in thousands) of two types (P and Q) of vehicles by a factory over the years 2009 to 2014. Study the graph and answer the given questions.

In how many of the given years, was the production of Type P vehicles of the comapny more than the average production of this type vehicles in the given years ?
View SolutionThe following graph shows production (in thousands) of two types (P and Q) of vehicles by a factory over the years 2009 to 2014. Study the graph and answer the given questions.
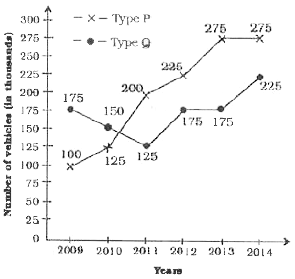
Approximate percentage decrease in production of Type Q vehicles from 2010 to 2011 is
View SolutionThe following graph shows production (in thousands) of two types (P and Q) of vehicles by a factory over the years 2009 to 2014. Study the graph and answer the given questions.
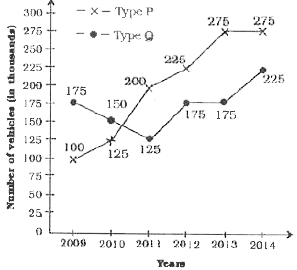
the total production of Type P vehicles in the years 2009 and 2011 is what percent of total production of Type Q vehicles in 2010 and 2014?
View SolutionThe following graph shows production (in thousands) of two types (P and Q) of vehicles by a factory over the years 2009 to 2014. Study the graph and answer the given questions.
The ratio of total production of Type P vehicles to total production of type Q vehicles over the years is
View SolutionThe following graph shows production (in thousands) of two types (P and Q) of vehicles by a factory over the years 2009 to 2014. Study the graph and answer the given questions.
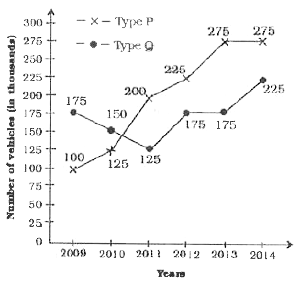
The production of type Q vehicles in 2010 was approximately what percent of Type P vehicles in 2014?
View Solution
