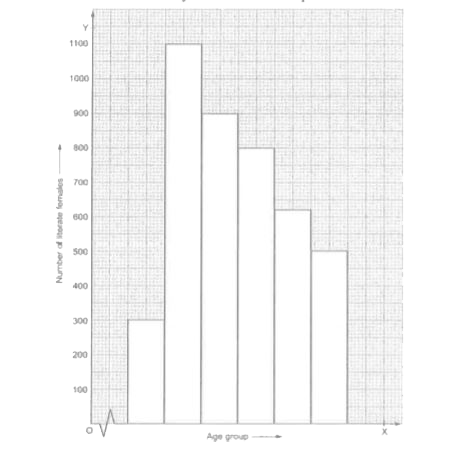
The histogram given below shows the number of literate females iin the age group of 10 to 40 years. Study the histogram carefully and answer the questions that follow.

(i) Write the classes, assuming that all the classes are of equal width.
(ii) What is the class width?
(iii) In which age group are the literate females the least?
(iv) In which age group is the number of literate females the highest?
Step by step video solution for The histogram given below shows the number of literate females iin the age group of 10 to 40 years. Study the histogram carefully and answer the questions that follow. (i) Write the classes, assuming that all the classes are of equal width. (ii) What is the class width? (iii) In which age group are the literate females the least? (iv) In which age group is the number of literate females the highest? by Maths experts to help you in doubts & scoring excellent marks in Class 8 exams.
Updated on:21/07/2023Topper's Solved these Questions
- DATA HANDLINGBook:NCERT EXEMPLARChapter:DATA HANDLINGExercise:EXERCISE (True or False)
Explore 23 Videos
- COMPARING QUANTITIESBook:NCERT EXEMPLARChapter:COMPARING QUANTITIESExercise:Think and Discuss
Explore 2 Videos
- DIRECT AND INVERSE PROPORTIONS Book:NCERT EXEMPLARChapter:DIRECT AND INVERSE PROPORTIONS Exercise:THINK AND DISCUSS
Explore 2 Videos
Similar Questions
A type of graph in which a circle is divided into sectors such that each sector represents a proption of the whole is a
View SolutionLemons were bought at Rs 60 a dozen and sold at the rate of Rs 40 per 10. Find the gain or loss percent.
View SolutionIf 30 men can reap a field in 17 days, then 10 men reap the field in how many days?
View SolutionWhich of the following are correct chain isomers of butane ? (i)
View SolutionDetermine the point of symmetry of a regular hexagon.
View SolutionMatch the following Column A to Column B

View SolutionMatch the following Column A to Column B

View SolutionMatch the following Column A to Column B

View SolutionFind the area of the figure given below.

View SolutionThe inequation represented by the graph given below is :
View SolutionThe inequation that best describes the graph given below is _________
View SolutionThe inequation that best describes the following graph is _________
View SolutionWhich inequations represent the shaded region in the given figure
View SolutionIn the given figure, PQRS is a parallelogram. A and B are the mid-point of ¯¯¯¯¯¯PQ and ¯¯¯¯¯SR respectively. If PS=BR, then the quadrilateral ADBC is a…………………… ,
ltimg src="https://d10lpgp6xz60nq.cloudfront.net/physics_images/PS_MATH_IX_C12_E05_020_Q01.png" width="80%"gt
View SolutionMatch the followings (column I with column II)
ltimg src="https://d10lpgp6xz60nq.cloudfront.net/physics_images/NCERT_BIO_XI_C03_E01_011_Q01.png" width="80%"gt
View SolutionThe histogram given below shows the number of literate females iin the age group of 10 to 40 years. Study the histogram carefully and answer the questions that follow.

(i) Write the classes, assuming that all the classes are of equal width.
(ii) What is the class width?
(iii) In which age group are the literate females the least?
(iv) In which age group is the number of literate females the highest?
View Solution