The Pie Chart shows the angular representation of five different Employment sectors. The total number of employees in these five sectors is 7,20,000.
यह पाई-चार्ट पांच अलग-अलग रोज़गार क्षेत्रों के कोणीय प्रतिनिधित्व को दर्शाता है | इन पांच क्षेत्रों में
कर्मचारियों की कुल संख्या 7,20,000 है|
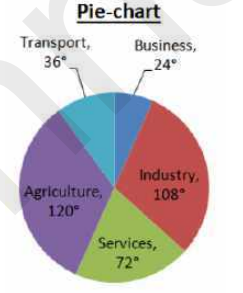 How much percent employees are in Service Sector?
कितने प्रतिशत कर्मचारी सैवा क्षेत्र में है?
0.72
0.36
0.2
0.25
Step by step video solution for The Pie Chart shows the angular representation of five different Employment sectors. The total number of employees in these five sectors is 7,20,000. यह पाई-चार्ट पांच अलग-अलग रोज़गार क्षेत्रों के कोणीय प्रतिनिधित्व को दर्शाता है | इन पांच क्षेत्रों में कर्मचारियों की कुल संख्या 7,20,000 है| How much percent employees are in Service Sector? कितने प्रतिशत कर्मचारी सैवा क्षेत्र में है? by Maths experts to help you in doubts & scoring excellent marks in Class 14 exams.
Updated on:21/07/2023Topper's Solved these Questions
Similar Questions
The Pie Chart shows the angular representation of five different Employment sectors. The total number of employees in these five sectors is 7,20,000.
यह पाई-चार्ट पांच अलग-अलग रोज़गार क्षेत्रों के कोणीय प्रतिनिधित्व को दर्शाता है | इन पांच क्षेत्रों में कर्मचारियों की कुल संख्या 7,20,000 है|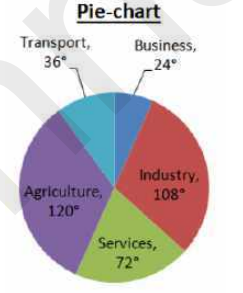 How many more employees are engaged in Industry than Business?
उद्योग में व्यवसाय की तुलना में कितने अधिक कर्मचारी संततग्न हैं ?
View SolutionThe Pie Chart shows the angular representation of five different Employment sectors. The total number of employees in these five sectors is 7,20,000.
यह पाई-चार्ट पांच अलग-अलग रोज़गार क्षेत्रों के कोणीय प्रतिनिधित्व को दर्शाता है | इन पांच क्षेत्रों में कर्मचारियों की कुल संख्या 7,20,000 है|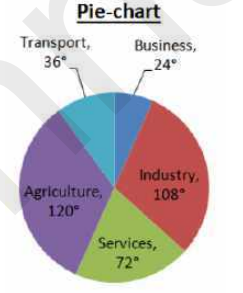 How many total employees are engaged in Agriculture, Business and Transport?
कृषि, व्यवसाय और परिवहन में कुल कितने कर्मचारी संलग्न हैं?
View Solution
Knowledge Check
The Pie Chart shows the angular representation of five different Empolyment sectors. The total number of employees in these five sectors is 7,20,000.
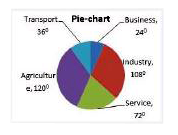
How many total employees are engaged in Agriculture, Business and Transport?A3,60,000B5,00,000C2,60,000D4,80,000
The following pie chart shows the percentage-wise distribution of the number of students in five different schools P, Q, R, S and T. The total number of students in all five schools together is 8400.
निम्नलिखित पाई चार्ट पांच अलग-अलग स्कूलों P, Q, R, S और T में छात्रों की संख्या के प्रतिशत को दर्शाता है। सभी पाँच स्कूलों में कुल छात्रों की संख्या 8400 है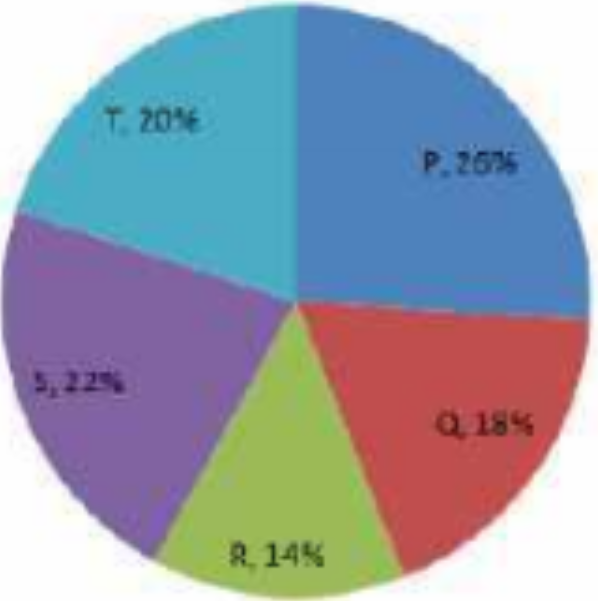 Find the average number of students in schools R and S together.
स्कूलों R और S में एक साथ छात्रों की औसत संख्या ज्ञात कीजिए।
View SolutionThe following pie chart shows the percentage wise distribution of the number of students in five different schools, P, Q, R, S and T. Total number of students in all five schools together is 8400.
निम्नलेखित पाई चार्ट पाँच अलग-अलग स्कूलों, P, Q, R, Sऔर T में छात्रों की संख्या का प्रतिशत वार वितरण दर्शाता है। सभी पाँच स्कूलों में कुल छात्रों की संख्या 8400 है। The number of students in school T is what percentage of the total number of students in school Q and S together.
स्कूल T में छात्रों की संख्या, स्कूल Q और S में कुल छात्रों की संख्या का कितना प्रतिशत है?
View SolutionThe bar graph given below shows the number of cars parked in a parking area during ten different days. What is the total number of cars parked in the parking area for all 10 days ?
नीचे दिया गया दंड आरेख किसी पार्किंग क्षेत्र में दस अलग-अलग दिनों में खड़ी कारों की संख्या को दर्शाता है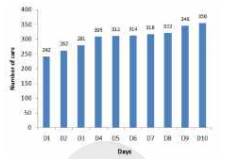 पार्किंग क्षेत्र में सभी 10 दिनों में खड़ी कारों की कुल संख्या कितनी है ?
View SolutionThe given pie-chart depicts the percentage of students coming to school using different modes of transport. Total number of students=1300
दिया गया पाई चार्ट परिवहन के विभिन्न साधनों का प्रयोग करके विद्यालय आने वाले छात्रों का प्रतिशत दर्शाता है | छात्रों की कुल संख्या =1300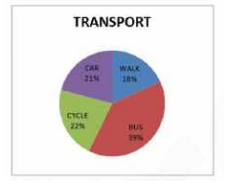 In the given pie-chart, if 234 students used to walk, then how many come by bus ? /
दिए गए पाई-चार्ट में, यदि 234 छात्र चलकर आते हैं, तो कितने छात्र बस से आते हैं?
View SolutionThe given table shows the number (in percent) of employees working in different depratments of an organization. The table also shows the ratio of males and females and the ratio of employees living in city Z and employees , living in city Y. The total number of employees in the organization 80,000.
दी गई तालिका में एक संगठन के विभिन्न विभागों में कार्य कर रहे कर्मचारियों की संख्या ( प्रतिशत में ) को दर्शाया गया है। यह तालिका पुरूषों तथा महिलाओं के अनुपाव को तथा शहर ,Z में रह रहे कर्मचारियों तथा शहर Y में रह रहे कर्मचारियों के अनुपात को भी दर्शाती है। संगठन रद में कुल कर्मचारियों की संख्या 80000 है।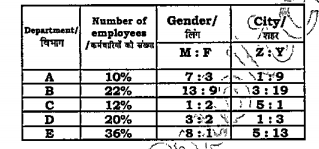 How many employees of department A and C together are living in city Z?
विभाग A तथा C के कितने कर्मचारी, शहर Z में साथ-मिलकर रह रहें है?
View SolutionThe given table shows the number (in percent) of employees working in different depratments of an organization. The table also shows the ratio of males and females and the ratio of employees living in city Z and employees , living in city Y. The total number of employees in the organization 80,000.
दी गई तालिका में एक संगठन के विभिन्न विभागों में कार्य कर रहे कर्मचारियों की संख्या ( प्रतिशत में ) को दर्शाया गया है। यह तालिका पुरूषों तथा महिलाओं के अनुपाव को तथा शहर ,Z में रह रहे कर्मचारियों तथा शहर Y में रह रहे कर्मचारियों के अनुपात को भी दर्शाती है। संगठन रद में कुल कर्मचारियों की संख्या 80000 है।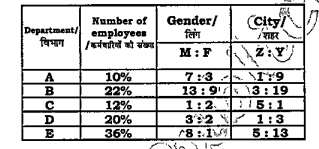 what are the total number of employee in department A and E together?
विभाग A तथा E में मिलाकर कुल कर्मचारियों की संख्या क्या है?
View SolutionThe given table shows the number (in percent) of employees working in different depratments of an organization. The table also shows the ratio of males and females and the ratio of employees living in city Z and employees , living in city Y. The total number of employees in the organization 80,000.
दी गई तालिका में एक संगठन के विभिन्न विभागों में कार्य कर रहे कर्मचारियों की संख्या ( प्रतिशत में ) को दर्शाया गया है। यह तालिका पुरूषों तथा महिलाओं के अनुपाव को तथा शहर ,Z में रह रहे कर्मचारियों तथा शहर Y में रह रहे कर्मचारियों के अनुपात को भी दर्शाती है। संगठन रद में कुल कर्मचारियों की संख्या 80000 है।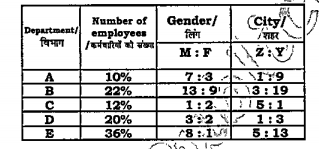 On an average how many residents of city Y are working in each department?
शहर Y के कितने निवासी औसतन एक विभाग में कार्य कर रहे है?
View Solution
