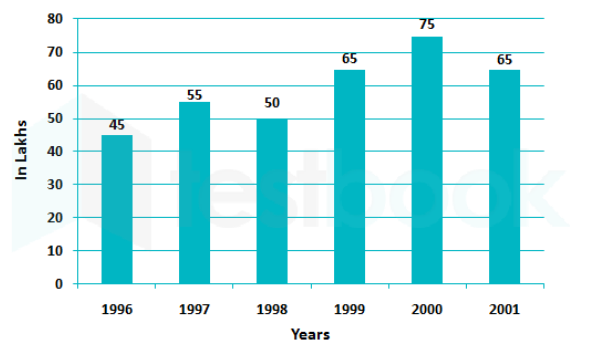
The following graph given the annual percent profit earned by a company during the period 1996-2001. Study the graph carefully and answer the questions that follow. %profit=Income−ExpenditureExpenditure×100 निम्नलिखित आरेख 1996-2001 की अवधि के दौरान एक कंपनी के द्वारा
अर्जित लाभ का वार्षिक प्रतिशत दर्शाता है। इस आरेख का ध्यानपूर्वक अध्ययन कीजिए और इसके बाद पूछे गए प्रश्नों का उत्तर दीजिए।
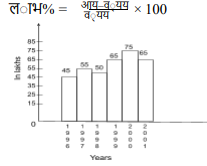 The period in which the profit of the company has increased fastest is:
वह अवधि जिसमें कंपनी का लाभ सबसे तेज़ी से बढ़ा है:
1996 - 1997
2000 - 2001
1998 - 1999
1997 - 1998
Step by step video solution for The following graph given the annual percent profit earned by a company during the period 1996-2001. Study the graph carefully and answer the questions that follow. % profit =(Income-Expenditure)/(Expenditure)xx100 निम्नलिखित आरेख 1996-2001 की अवधि के दौरान एक कंपनी के द्वारा अर्जित लाभ का वार्षिक प्रतिशत दर्शाता है। इस आरेख का ध्यानपूर्वक अध्ययन कीजिए और इसके बाद पूछे गए प्रश्नों का उत्तर दीजिए। The period in which the profit of the company has increased fastest is: वह अवधि जिसमें कंपनी का लाभ सबसे तेज़ी से बढ़ा है: by Maths experts to help you in doubts & scoring excellent marks in Class 14 exams.
Updated on:21/07/2023Topper's Solved these Questions
Similar Questions
The graphs of the equations 3x+y-5=0 and 2x-y-5=0 intersect at the point P(α,β). What is the value of (3α+β) ?
समीकरण 3x+y-5=0 तथा 2x-y-5=0 के आरेख एक बिंदु P(α,β) पर एक-दूसरे को काटते है (3α+β) का मान क्या है ?
View SolutionAfter giving two successive discounts, each of x%, on the marked price of an article, total discount is Rs. 259.20. If the marked price of the article is Rs. 720, then the value of x is :
View SolutionThe following line diagram represents the yearly sales figure of a company in the years 2001-2010. Examine the diagram and answer the question. निम्नलिखित रेखा आरेख किसी कंपनी की वर्ष 2007-2010 के दौरान वार्षिक बिक्री के आंकड़ों को दर्शाता है। आरेख का अध्ययन करें और नीचे दिए गए प्रश्नों के उत्तर दें- The ratio of sales in 2002 to that in 2007 is वर्ष 2002 में बिक्री का वर्ष 2007 में बिक्री के साथ अनुपात है-
View SolutionThe given graph represents the percentage distribution of the total expenditure of a company. Study the graph and answer the question that follows.
दिया गया आरेख एक कंपनी के कुल व्यय के प्रतिशत वितरण को दर्शाता है। आरेख का अध्ययन कीजिए और फिर पूछे गए प्रश्न का उत्तर दीजिए।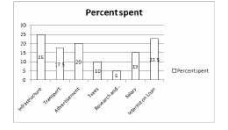 What is the ratio of the total expenditure on .Infrastructure. and .Transport. to the total expenditure on .Taxes. and .Interest on Loans.?
‘आधारभूत संरचना’(Infrastructure) तथा “परिवहन. (Transport) पर किये गए कुल व्यय और “करों (Taxes) तथा “ऋण पर ब्याज.(Interest on loans) पर किये गए कुल व्यय के बीच अनुपात ज्ञात कीजिए।
View SolutionThe given graph represents the percentage distribution of the total expenditure of a company. Study the graph and answer the question that follows.
दिया गया आरेख एक कंपनी के कुल व्यय के प्रतिशत वितरण को दर्शाता है। आरेख का अध्ययन कीजिए और फिर पूछे गए प्रश्न का उत्तर दीजिए।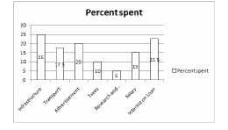 The total expenditure of the company is how many times the total expenditure on .Research
and Development. and .Salary.?
कंपनी का कुल व्यय .शोध तथा विकास (Reaserch and Development)’ और .वेतन.(Salary) पर किये गए कुल व्यय से कितना गुना है ?
View SolutionThe given graph represents the percentage distribution of the total expenditure of a company. Study the graph and answer the question that follows.
दिया गया आरेख एक कंपनी के कुल व्यय के प्रतिशत वितरण को दर्शाता है। आरेख का अध्ययन कीजिए और फिर पूछे गए प्रश्न का उत्तर दीजिए। The expenditure on .Interest on loans. is what percentage more than the expenditure on
.Transport.?
.ऋण पर ब्याज. (Interest on loans) में किया गया व्यय “परिवहन (Transport) पर किये गए व्यय से कितना प्रतिशत अधिक है ?
View SolutionIn the given bar graph, the Blue bar shows the income and the Red bar shows the expenditure of a company. Study the graph and answer the question that follows
दिए गए दंड आरेख में, नीला दंड एक कंपनी की आय दिखाता है और लाल दंड खर्च (लाख रुपये में) को दर्शाता है। आरेख का अध्ययन करें और उस प्रश्न का उत्तर दें जो नीचे पूछा गया है। The income in 2001 was equal to the expenditure in the year:
2001 में आय किस वर्ष के व्यय के बराबर है :
View SolutionIn the given bar graph, the Blue bar shows the income and the Red bar shows the expenditure of a company. Study the graph and answer the question that follows
दिए गए दंड आरेख में, नीला दंड एक कंपनी की आय दिखाता है और लाल दंड खर्च (लाख रुपये में) को दर्शाता है। आरेख का अध्ययन करें और उस प्रश्न का उत्तर दें जो नीचे पूछा गया है। The percentage decrease in the income of the company in 2002 as compared to that in 2001 is:
2001 की तुलना में 2002 में कंपनी की आय में कितने प्रतिशत में कमी आई है:
View SolutionThe following line-graph gives the annual profit percent earned by a Company during the period 1995-2000. Study the line-graph and answer the questions that are based on it. Profit Percent Earned by a Company Over the Years % " Profit " = (" Income -Expenditure ")/(" Expenditure ") xx 100 Find the difference between profit percent in 1998 and 1999.
View SolutionThe following line-graph gives the annual profit percent earned by a Company during the period 1995-2000. Study the line-graph and answer the questions that are based on it. Profit Percent Earned by a Company Over the Years % " Profit " = (" Income -Expenditure ")/(" Expenditure ") xx 100 Find the average profit percent earned in given years
View SolutionThe following graph given the annual percent profit earned by a company during the period 1996-2001. Study the graph carefully and answer the questions that follow. The expenditure of the company during the year 1996 was 30 crores. The income of the company in that year was (in crores ):
View SolutionThe following graph given the annual percent profit earned by a company during the period 1996-2001 . Study the graph carefully and answer the questions that follow
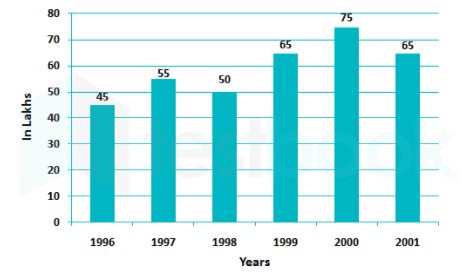
The period in which the profit of the company has increased fasted is:
View SolutionThe following graph represents the annual percentage profit earned by a company during the pe.riod 1996 - 2001. Study the graph carefully and answer the questions that follow . The profit earned by the company is maximum in the year:
View SolutionThe following graph given the annual percent profit earned by a company during the period 1996-2001. Study the graph carefully and answer the questions that follow. Profit=Income - Expenditure The expenditure of the company during the year 1996 was Rs 30 Lakhs. The income of the company in that year was (in Lakhs Rs):
View SolutionThe following graph given the annual percent profit earned by a comppany during the period 1996-2001. Study the graph carefully and answer the questions that follow.
The period in which the profit of the company has increased faster is :
View Solution