The following bar graph shows the data of the production of an item (in thousand tonnes) from four different companies A, B, C and D during the year mentioned.
निम्नलिखित दंड आरेख में उल्लिखित वर्षों के दौरान चार अलग-अलग कंपनियों A, B, C और D के द्वारा एक वस्तु (हजार टन में) के उत्पादन का आंकड़ा दिखाया गया है।
 In the five years given, the average production is highest in company _______ and lowest in company _______, respectively.
दिए गए पांच वर्षों में, औसत उत्पादन कंपनी______में सबसे अधिक है और कंपनी________ में सबसे कम है।
C, A
D, A
A, B
B, C
Step by step video solution for The following bar graph shows the data of the production of an item (in thousand tonnes) from four different companies A, B, C and D during the year mentioned. निम्नलिखित दंड आरेख में उल्लिखित वर्षों के दौरान चार अलग-अलग कंपनियों A, B, C और D के द्वारा एक वस्तु (हजार टन में) के उत्पादन का आंकड़ा दिखाया गया है। In the five years given, the average production is highest in company _______ and lowest in company _______, respectively. दिए गए पांच वर्षों में, औसत उत्पादन कंपनी______में सबसे अधिक है और कंपनी________ में सबसे कम है। by Maths experts to help you in doubts & scoring excellent marks in Class 14 exams.
Updated on:21/07/2023Topper's Solved these Questions
Similar Questions
The following bar graph shows the data of the production of an item (in thousand tonnes) from four different companies A, B, C and D during the years mentioned.
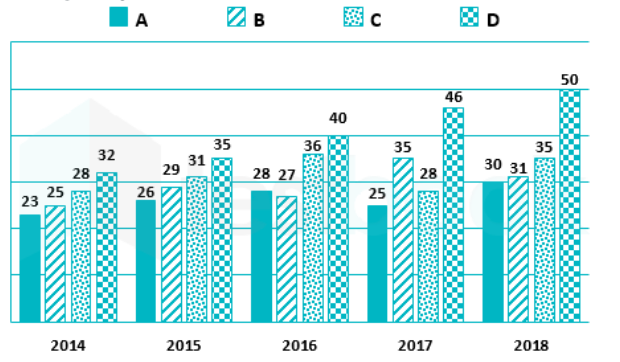
In the five years given, the average production is highest in company _____ and lower in company _______ respectively.
View SolutionThe table given below presents the figures of the production (in thousands) of different types of vehicles by a company during the year 2013-18.
नीचे दी गयी तालिका वर्ष 2013-18 के दौरान एक कंपनी के द्वारा विभिन्न प्रकार के वाहनों के उत्पादन ( हज़ार में)के आंकड़ों को प्रस्तुत करती है |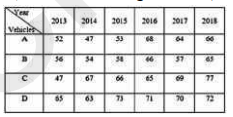 In how many years is the production of type C vehicles, below the average production of type D vehicles over six years?
कितने वर्ष C प्रकार के वाहनों का उत्पादन इन छः वर्षों में D प्रकार के वाहनों के औसत उत्पादन से कम रहा है ?
View SolutionThe table given below presents the figures of the production (in thousands) of different types of vehicles by a company during the year 2013-18.
नीचे दी गयी तालिका वर्ष 2013-18 के दौरान एक कंपनी के द्वारा विभिन्न प्रकार के वाहनों के उत्पादन ( हज़ार में)के आंकड़ों को प्रस्तुत करती है |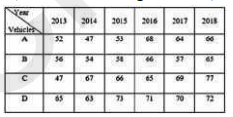 The total production of all types of vehicles in 2018 is what percent more than the total production of all types of vehicles in 2015?
2018 में सभी प्रकार के वाहनों का कुल उत्पादन 2015 में सभी प्रकार के वाहनों के कुल उत्पादन से कितना प्रतिशत अधिक है ?
View SolutionThe following graph shows the sales of cars (in thousands) in four cities in 4 years. Study the graph and answer the questions.
निम्नलिखित आरेख 4 वर्षों में चार शहरों में कारों की बिक्री (हज़ार में) को दर्शाता है। इस आरेख का अध्ययन कीजिए तथा प्रश्नों के उत्तर दीजिए। In 2019, what is the average number of sales among all the four cities?
2019 में, सभी चार शहरों में औसत बिक्री कितनी रही है?
View SolutionThe given Bar Graph presents the Imports and Exports of an item (in tonnes) manufactured by a company for the five financial years, 2013-2014 to 2017-2018.
दिया गया दंड आरेख (बार ग्राफ) 5 वित्त वर्षों, 2013-2014 से 2011-2018 के दौरान एक कंपनी द्वारा निर्मित किसी वस्तु (टन में) के आयात और निर्यात को दर्शाता है |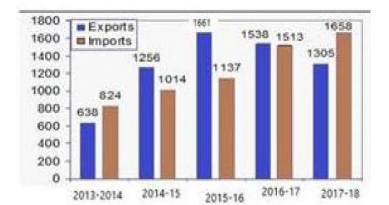 What is the average of Export (in tonnes) during the five financial years?
5 वित्त वर्षों के दौरान निर्यात (टन में] का औसत कितना है?
View SolutionThe given Bar Graph present the Imports and Exports of an item (in tonnes) manufactured by a company for the five financial years, 2013-2014 to 2017-2018.
दिया गया दंड आरेख (बार ग्राफ) पांच वित्त वर्षों, 2013-2014 से 2017-2018, के दौरान किसी कंपनी दवारा निर्यात किसी वस्तु (टन में] के आयात और निर्यात को दर्शाता है|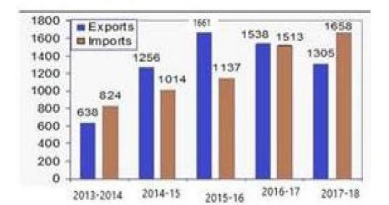
What is the average of total Import and Export (in tonnes) during five financial years?
पांच वित्त वर्षो के दौरान कुल आयात और निर्यात (टन में) का औसत क्या है?
View SolutionThe given Bar Graph presents the Imports and Exports of an item (in tonnes) manufactured by a company for the five financial years, 2013-2014 to 2017-2018.
दिया गया दंड आरेख पांच वित्तीय वर्षो अर्थत 2013-2014 से 2017-2018 तक एक कंपनी के द्वारा निर्मित किसी वस्तु के आयात और निर्यात ( टन में ) को दर्शाता है | What is the average of total Import and Export (in tonnes) during the five financial year?
पांच वित्तीय वर्षों के दौरान कुल आयात एवं निर्यात का औसत ( टन में)क्या है ?
View SolutionThe given bar graph shows the production and sale of mobile handsets of six different companies A, B, C, D, E, & F during the period of one month. With respect to production, the sale percentage of which company is highest ?
दंड आरेख विभिन्न कंपनियों A, B, C, D, E & F की एक माह में मोबाइल हैंडसेट के उत्पादन और बिक्री को दर्शाता है |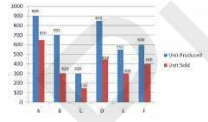
किस कंपनी की बिक्री का प्रतिशत, उसके उत्पादन के संदर्भ में, सबसे अधिक है ?
View SolutionThe given Bar Graph presents the Imports and Exports of an item (in tonnes) manufactured by a company for the five financial years, 2013-2014 to 2017-2018.
दिया गया दंड आरेख (बार ग्राफ) 5 वित्त वर्षों, 2013-2014 से 2011-2018 के दौरान एक कंपनी द्वारा निर्मित किसी वस्तु (टन में) के आयात और निर्यात को दर्शाता है |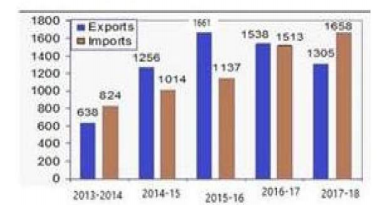 What is the ratio of total Imports to total Exports during the five financial years?
पांचों वित्त वर्षों के दौरान कुल आयात और कुल निर्यात का अनुपात क्या है?
View SolutionThe given Bar Graph presents the Imports and Exports of an item (in tonnes) manufactured by a company for the five financial years, 2013-2014 to 2017-2018.
दिया गया दंड आरेख (बार ग्राफ) 5 वित्त वर्षों, 2013-2014 से 2011-2018 के दौरान एक कंपनी द्वारा निर्मित किसी वस्तु (टन में) के आयात और निर्यात को दर्शाता है |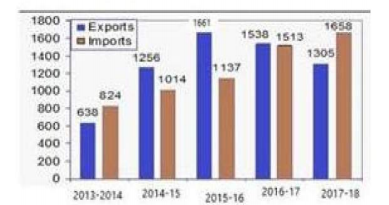 In which financial year, total of Exports and Imports is the highest?
किस वित्त वर्ष में नियात और आयात का योगफल सर्वाधिक है?
View Solution
