Study the given graph and answer the question that follows:
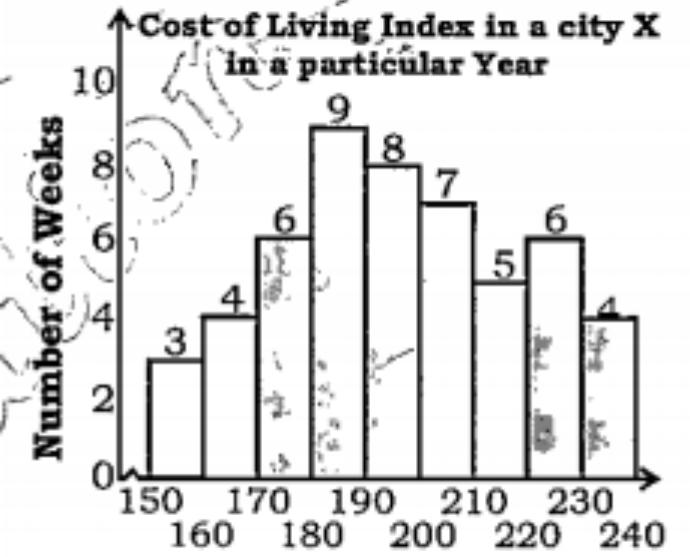
The number of weeks, iin which the cost of living index was 160 or more but less than 190, is approximately what percent more than the number of weeks in which the cost of livinig index was 200 or more but less than 220 (correct to one decimal place)?
दिए गए ग्राफ का अध्ययन करें और उस प्रश्न का उत्तर दें जो निम्न है:

सप्ताह की संख्या, iin जो लिविंग इंडेक्स की लागत 160 या उससे अधिक है, लेकिन 190 से कम है, लगभग यही है। उन सप्ताहों की तुलना में प्रतिशत अधिक है जिनमें लिविन्ग इंडेक्स की लागत 200 या उससे अधिक थी लेकिन 220 से कम (एक दशमलव स्थान के लिए सही)?
44.4
36.8
58.3
60.6
Step by step video solution for Study the given graph and answer the question that follows:The number of weeks, iin which the cost of living index was 160 or more but less than 190, is approximately what percent more than the number of weeks in which the cost of livinig index was 200 or more but less than 220 (correct to one decimal place)? दिए गए ग्राफ का अध्ययन करें और उस प्रश्न का उत्तर दें जो निम्न है: सप्ताह की संख्या, iin जो लिविंग इंडेक्स की लागत 160 या उससे अधिक है, लेकिन 190 से कम है, लगभग यही है। उन सप्ताहों की तुलना में प्रतिशत अधिक है जिनमें लिविन्ग इंडेक्स की लागत 200 या उससे अधिक थी लेकिन 220 से कम (एक दशमलव स्थान के लिए सही)? by Maths experts to help you in doubts & scoring excellent marks in Class 14 exams.
Updated on:21/07/2023Topper's Solved these Questions
Similar Questions
Study the given graph and answer the question that follows.
The number of weeks, in which the cost of living index was 160 or more but less than 190, is approximately what percent more than the number of weeks in which the cost of living index was 200 or more but less than 220 (correct to one decimal place)?
View SolutionStudy the given graph and answer the question that follows
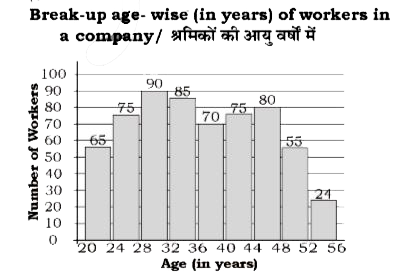
the number of workers whose age is 32 years or more but less than 44 years is:
View Solution
Knowledge Check
Study the given graph and answer the question that follows.
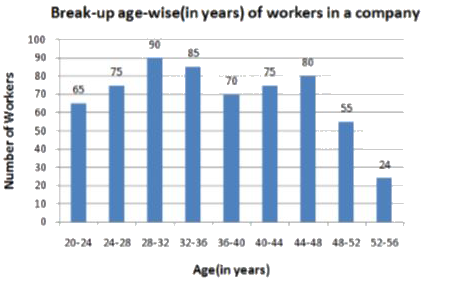
The number of workers whose age is 32 years or more but less than 44 years is:AA. 220BB. 215CC. 225DD. 230Study the given graph and answer the question that follows .
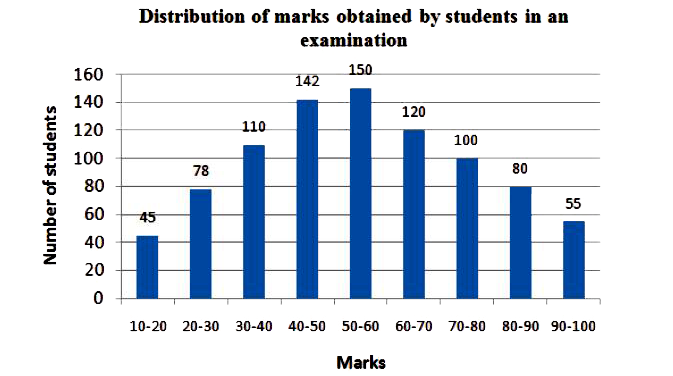
The number of students who obtained 20 marks or more but less than 60 marks is :A402B600C480D522
Study the graph and answer the question
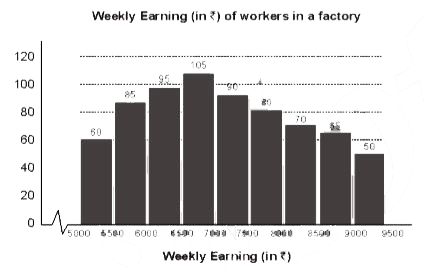
the number of workers in the factory whose weekly earnings are below Rs 5500 or more but less than Rs 7500 is
View SolutionStudy the graph and answer the question.
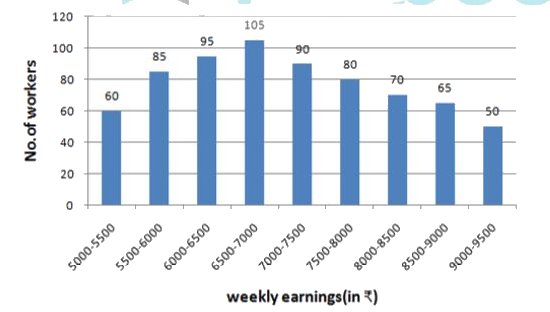
The number of workers in the factory whose weekly earnings are ₹5,500 or more but less than Rs.7,500 is:
View SolutionStudy the graph and answer the question
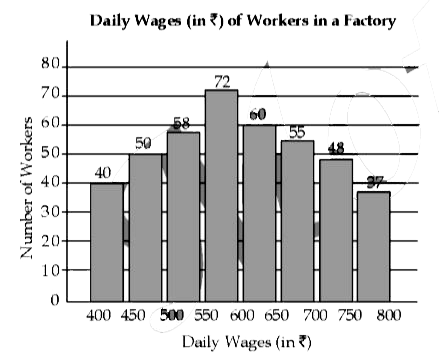
The number of workers in the factory whose daily wages are Rs 450 or more but less than Rs 600 is
View SolutionStudy the graph and answer the question
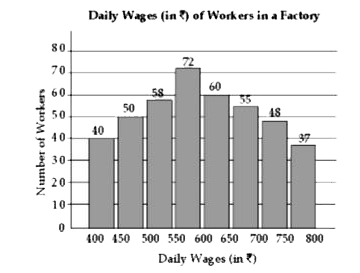
The number of workers in the factory whose daily wages are Rs 500 or more but less than Rs 650 is what percentage more than the number of workers whose daily wages are Rs 650 or more but less than Rs 750
View SolutionStudy the graph and answer the question
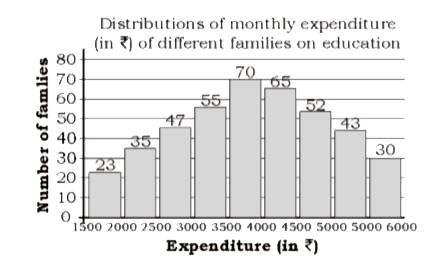
The number of families whose montly expenditures on education are Rs 2000 or more but less than Rs 4000 is
View SolutionStudy the given graph and answer the question that follows
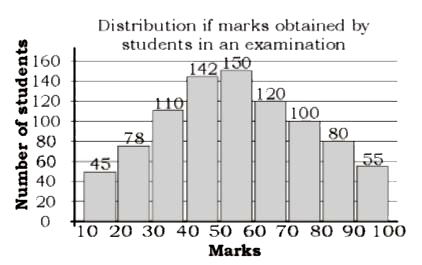
The total marks of students obtaining less than 50 marks is what percentage more than the total number of students obtaining 60 marks or more
View Solution
