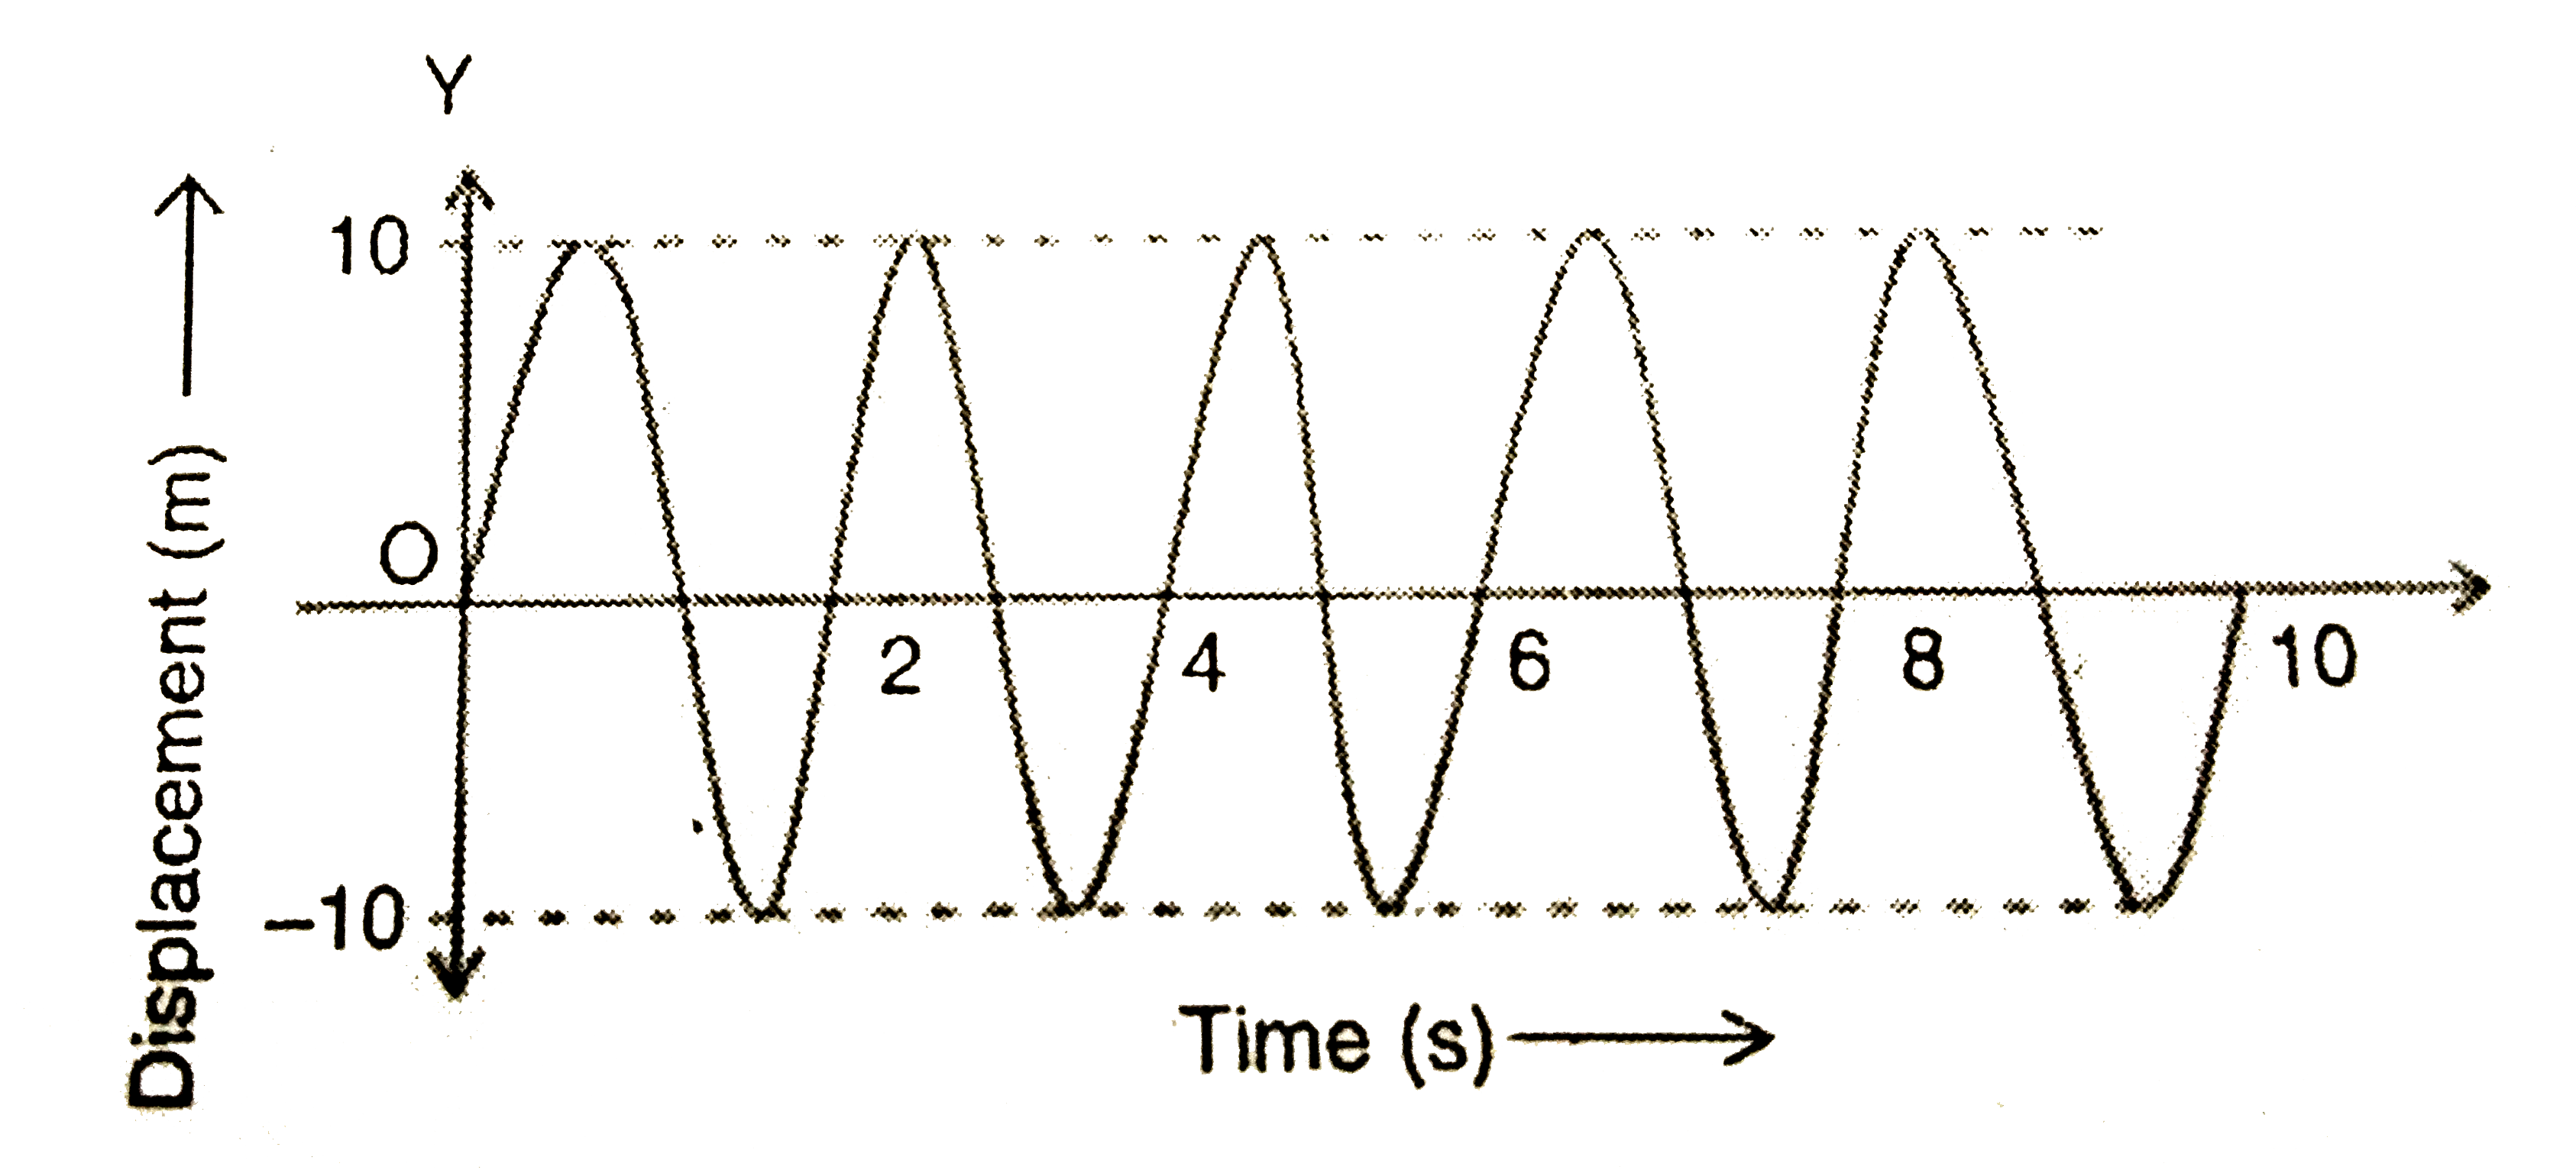
A graph is drawn between the displacement and time taken for the oscillations of a simple pendulum.find the no of oscillation?

2
1
0.5
0.25
The correct Answer is:B
As the time period of the oscillation, (T) = 2 s,
T=2π√lg
T2=4π2lg
l=gT24π2=10×44×10=1m.
Topper's Solved these Questions
- KINEMATICSBOOK - PEARSON IIT JEE FOUNDATIONCHAPTER - KINEMATICSEXERCISE - ASSESSMENT TEST (TEST 1 (SELECT THE CORRECT ALTERNATIVE)
14 Videos
- HEAT BOOK - PEARSON IIT JEE FOUNDATIONCHAPTER - HEAT EXERCISE - Test 2
14 Videos
- LIGHTBOOK - PEARSON IIT JEE FOUNDATIONCHAPTER - LIGHTEXERCISE - ASSESSMENT TEST (TEST 2 (SELECT THE CORRECT ALTERNATIVE))
15 Videos
Similar Questions
Choose the correct statement.
View SolutionArrange the following steps in a sequential order to demonstrate the expansion of gases
(a) Heat the test tube and observe the position of coloured drop in the narrow galss tube
(b) Take a drop of coloured liquid in to naroorw galss tube
(c ) Take an empty test tube fit its mouth wiht one holed cork stopper
(d) Fit the narrow glass tube through the cork os that the level of the coloured drop is just above the cork
(e ) The ari in the tube expands and pushes the colured drop in the narrow tube upwards
View SolutionA ray of light is incident on a plane mirror, making an angle 'q' with the surface of the mirror. Arrange the following steps in sequential order to calculate the angle between the incident light ray and the reflected light ray.
(A) Draw a normal line on the plane mirror at the point of incidence of the light ray.
(B) Note down the angle between the plane mirror and the incident light ray.
(C) The sum of the angle of incidence and the angle between the plane mirror and the incident ray is 90∘.Determine the angle of incidence.
(D) From the laws of reflection, the angle of incidence is equal to the angle of reflection. Then the sum of the angle of incidence and the angle of reflection gives the angle between the incident light ray and the reflected light ray.
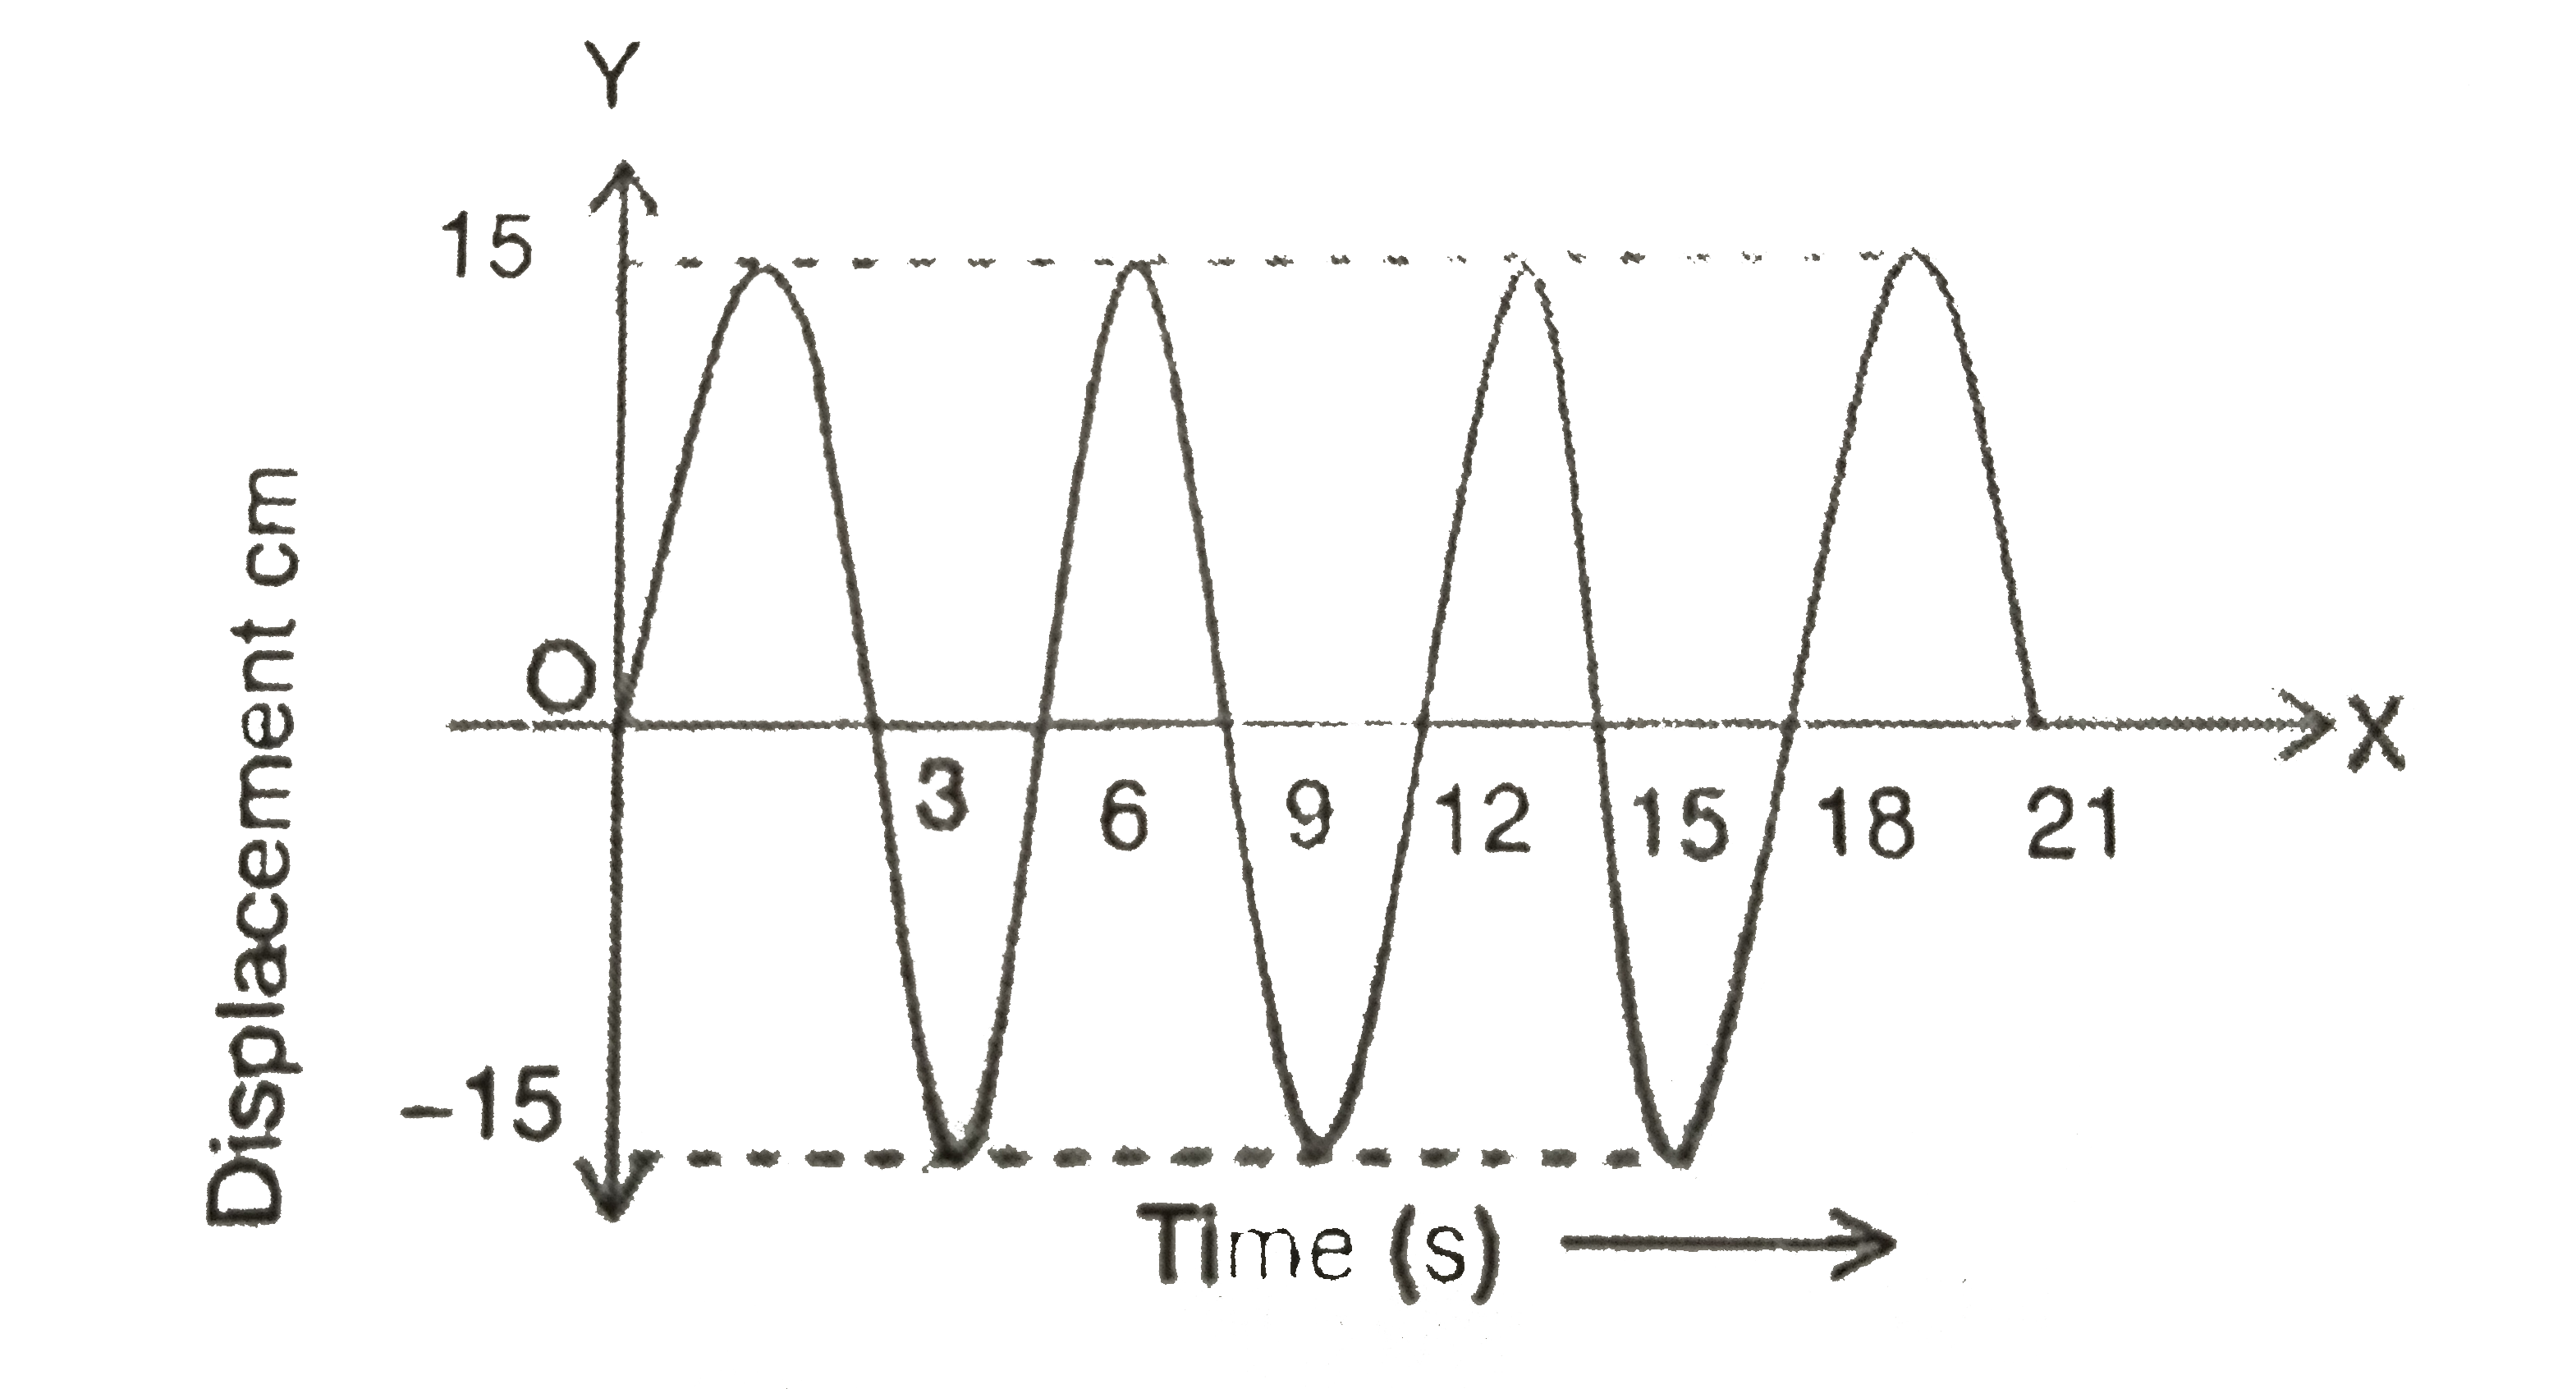
View SolutionIn the case of a simple pedulum a fraoh is drawn between th displacement and time taken for its oscillations as shown in the figure then. Time period of the pendulum bob is ______
View SolutionA graph is drawn between the displacement and time taken for the oscillations of a simple pendulum. The length of the penddulum is _______ m ( if g = 10 s^(-2) and pi^(2) =10 )
View SolutionIn the case of a simple pendulum, a graph is drawn between the displacement and time taken for its oscillations as shown in the figure . Then
From the given figure, the number of oscillation performed by the bob at the end of 21 s is ________

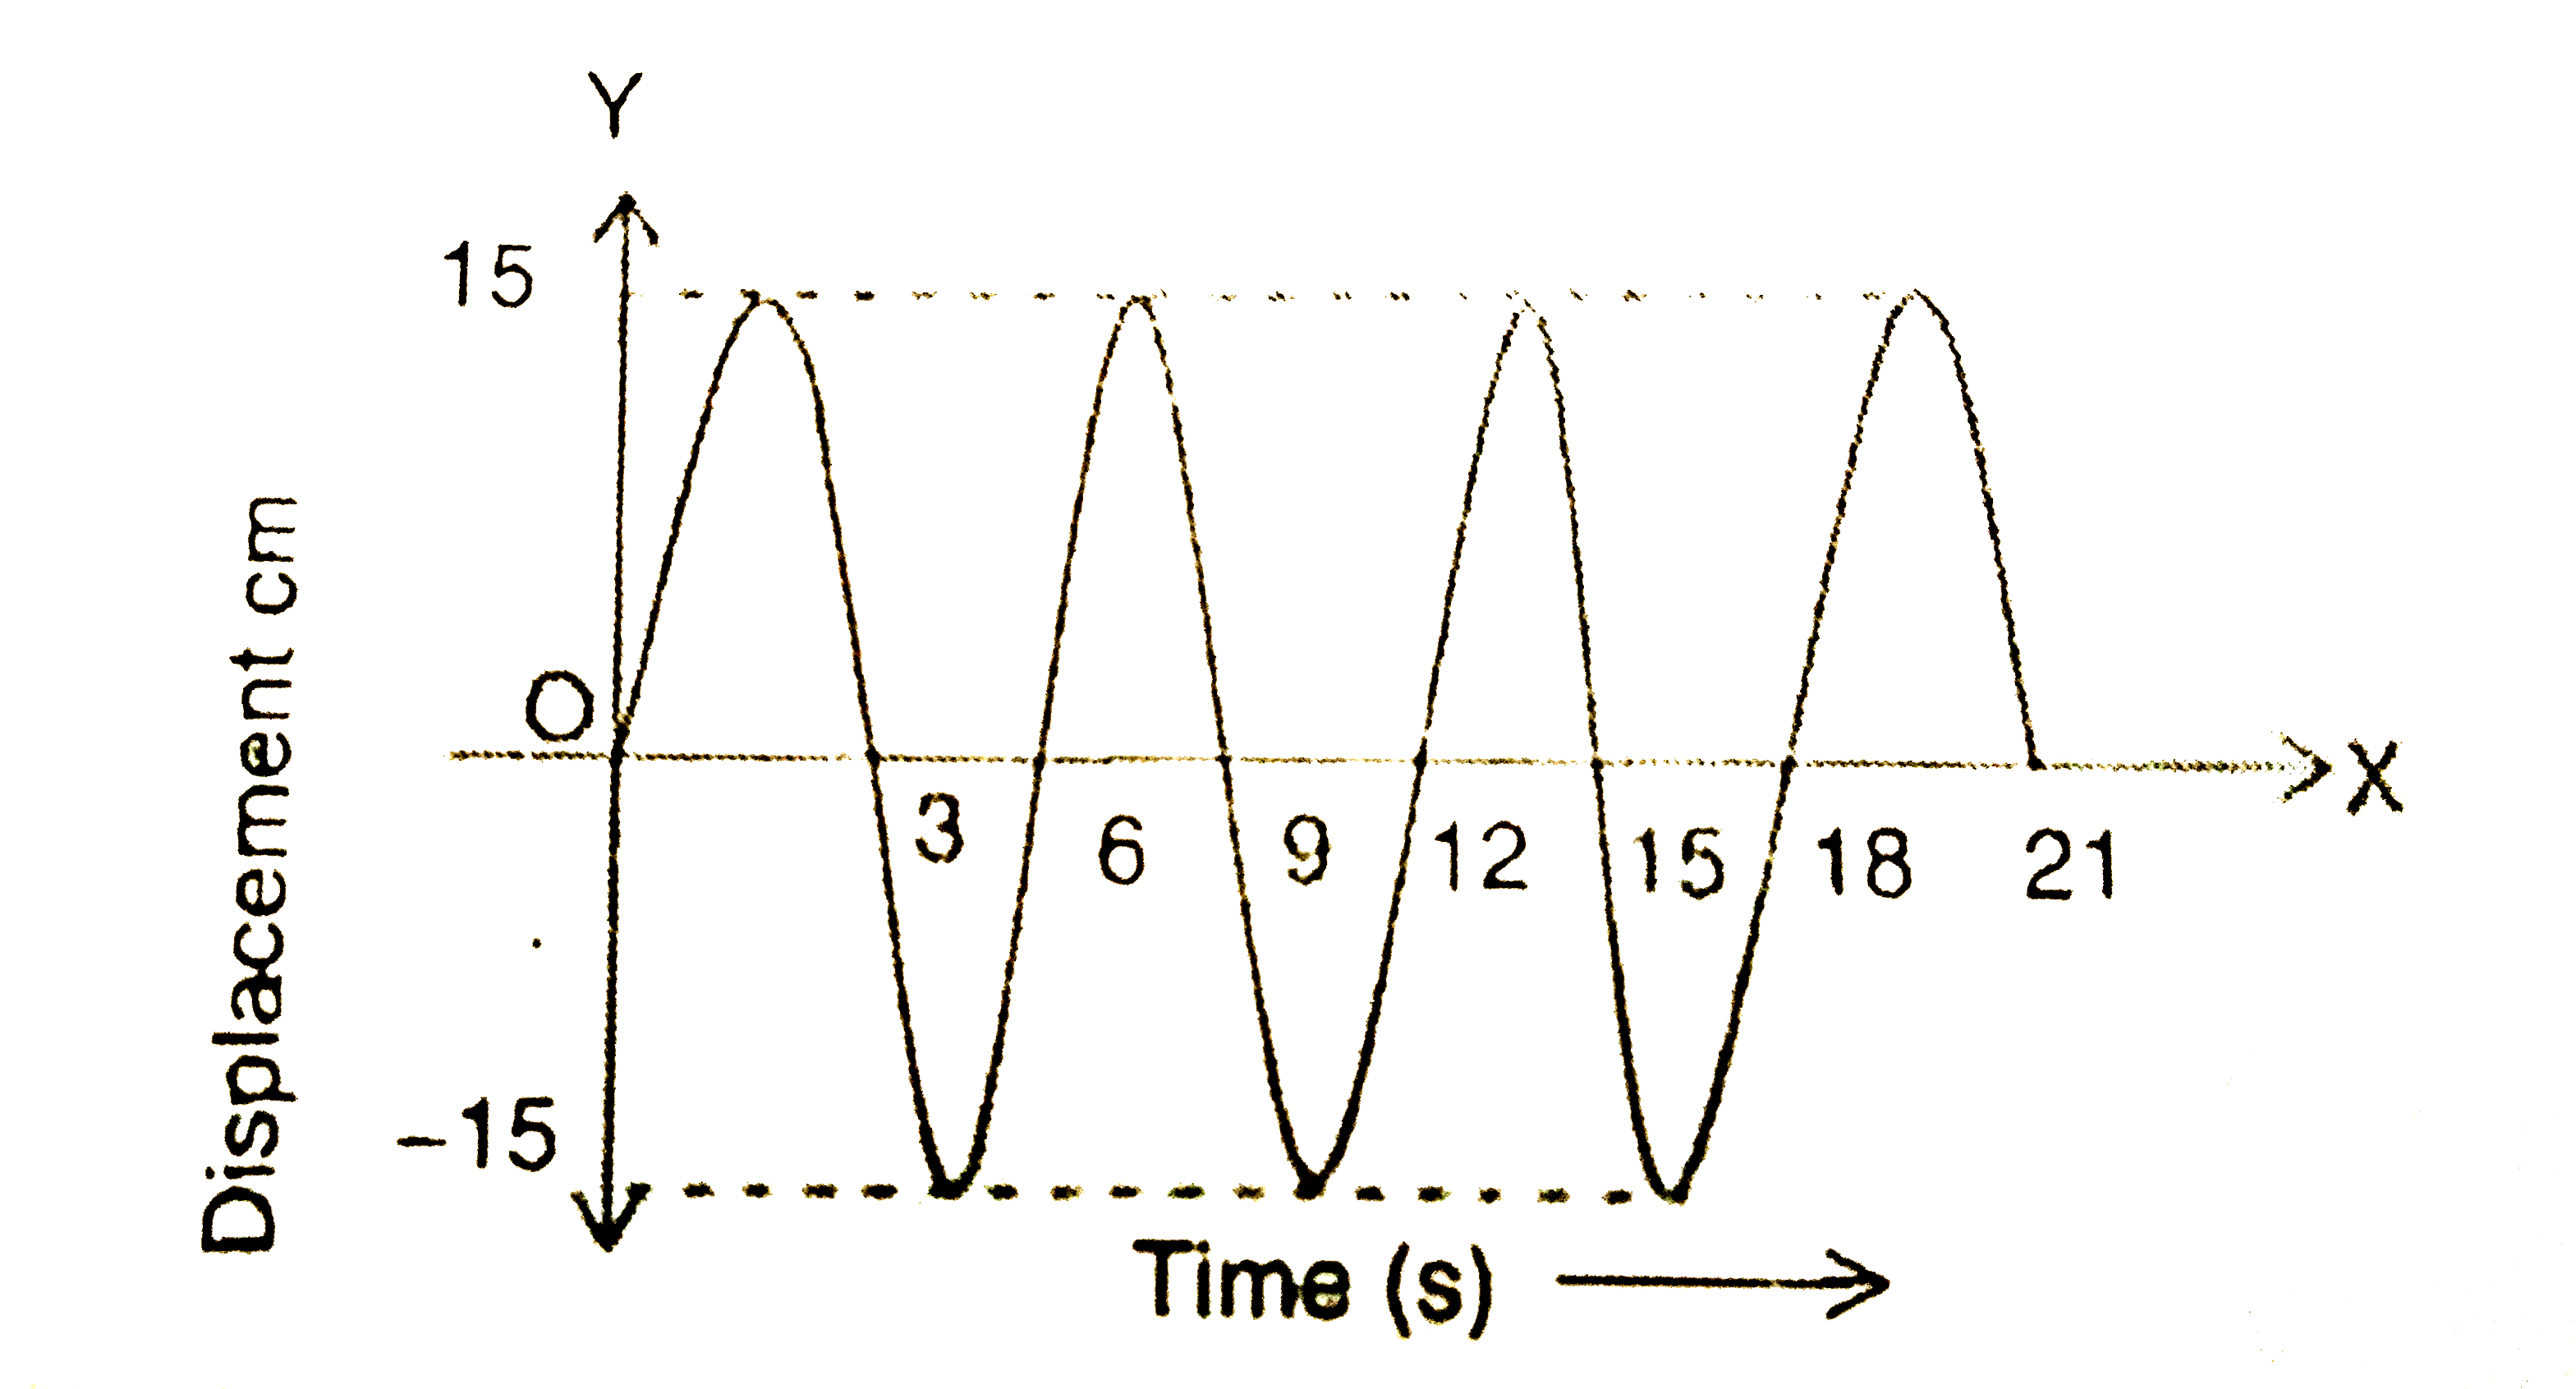
View SolutionIn the case of a simple pendulum, a graph is drawn between the displacement and time taken for its oscillations as shown in the figure . Then
The amplitude of oscillation of the pendulum of the bob is ____ cm .
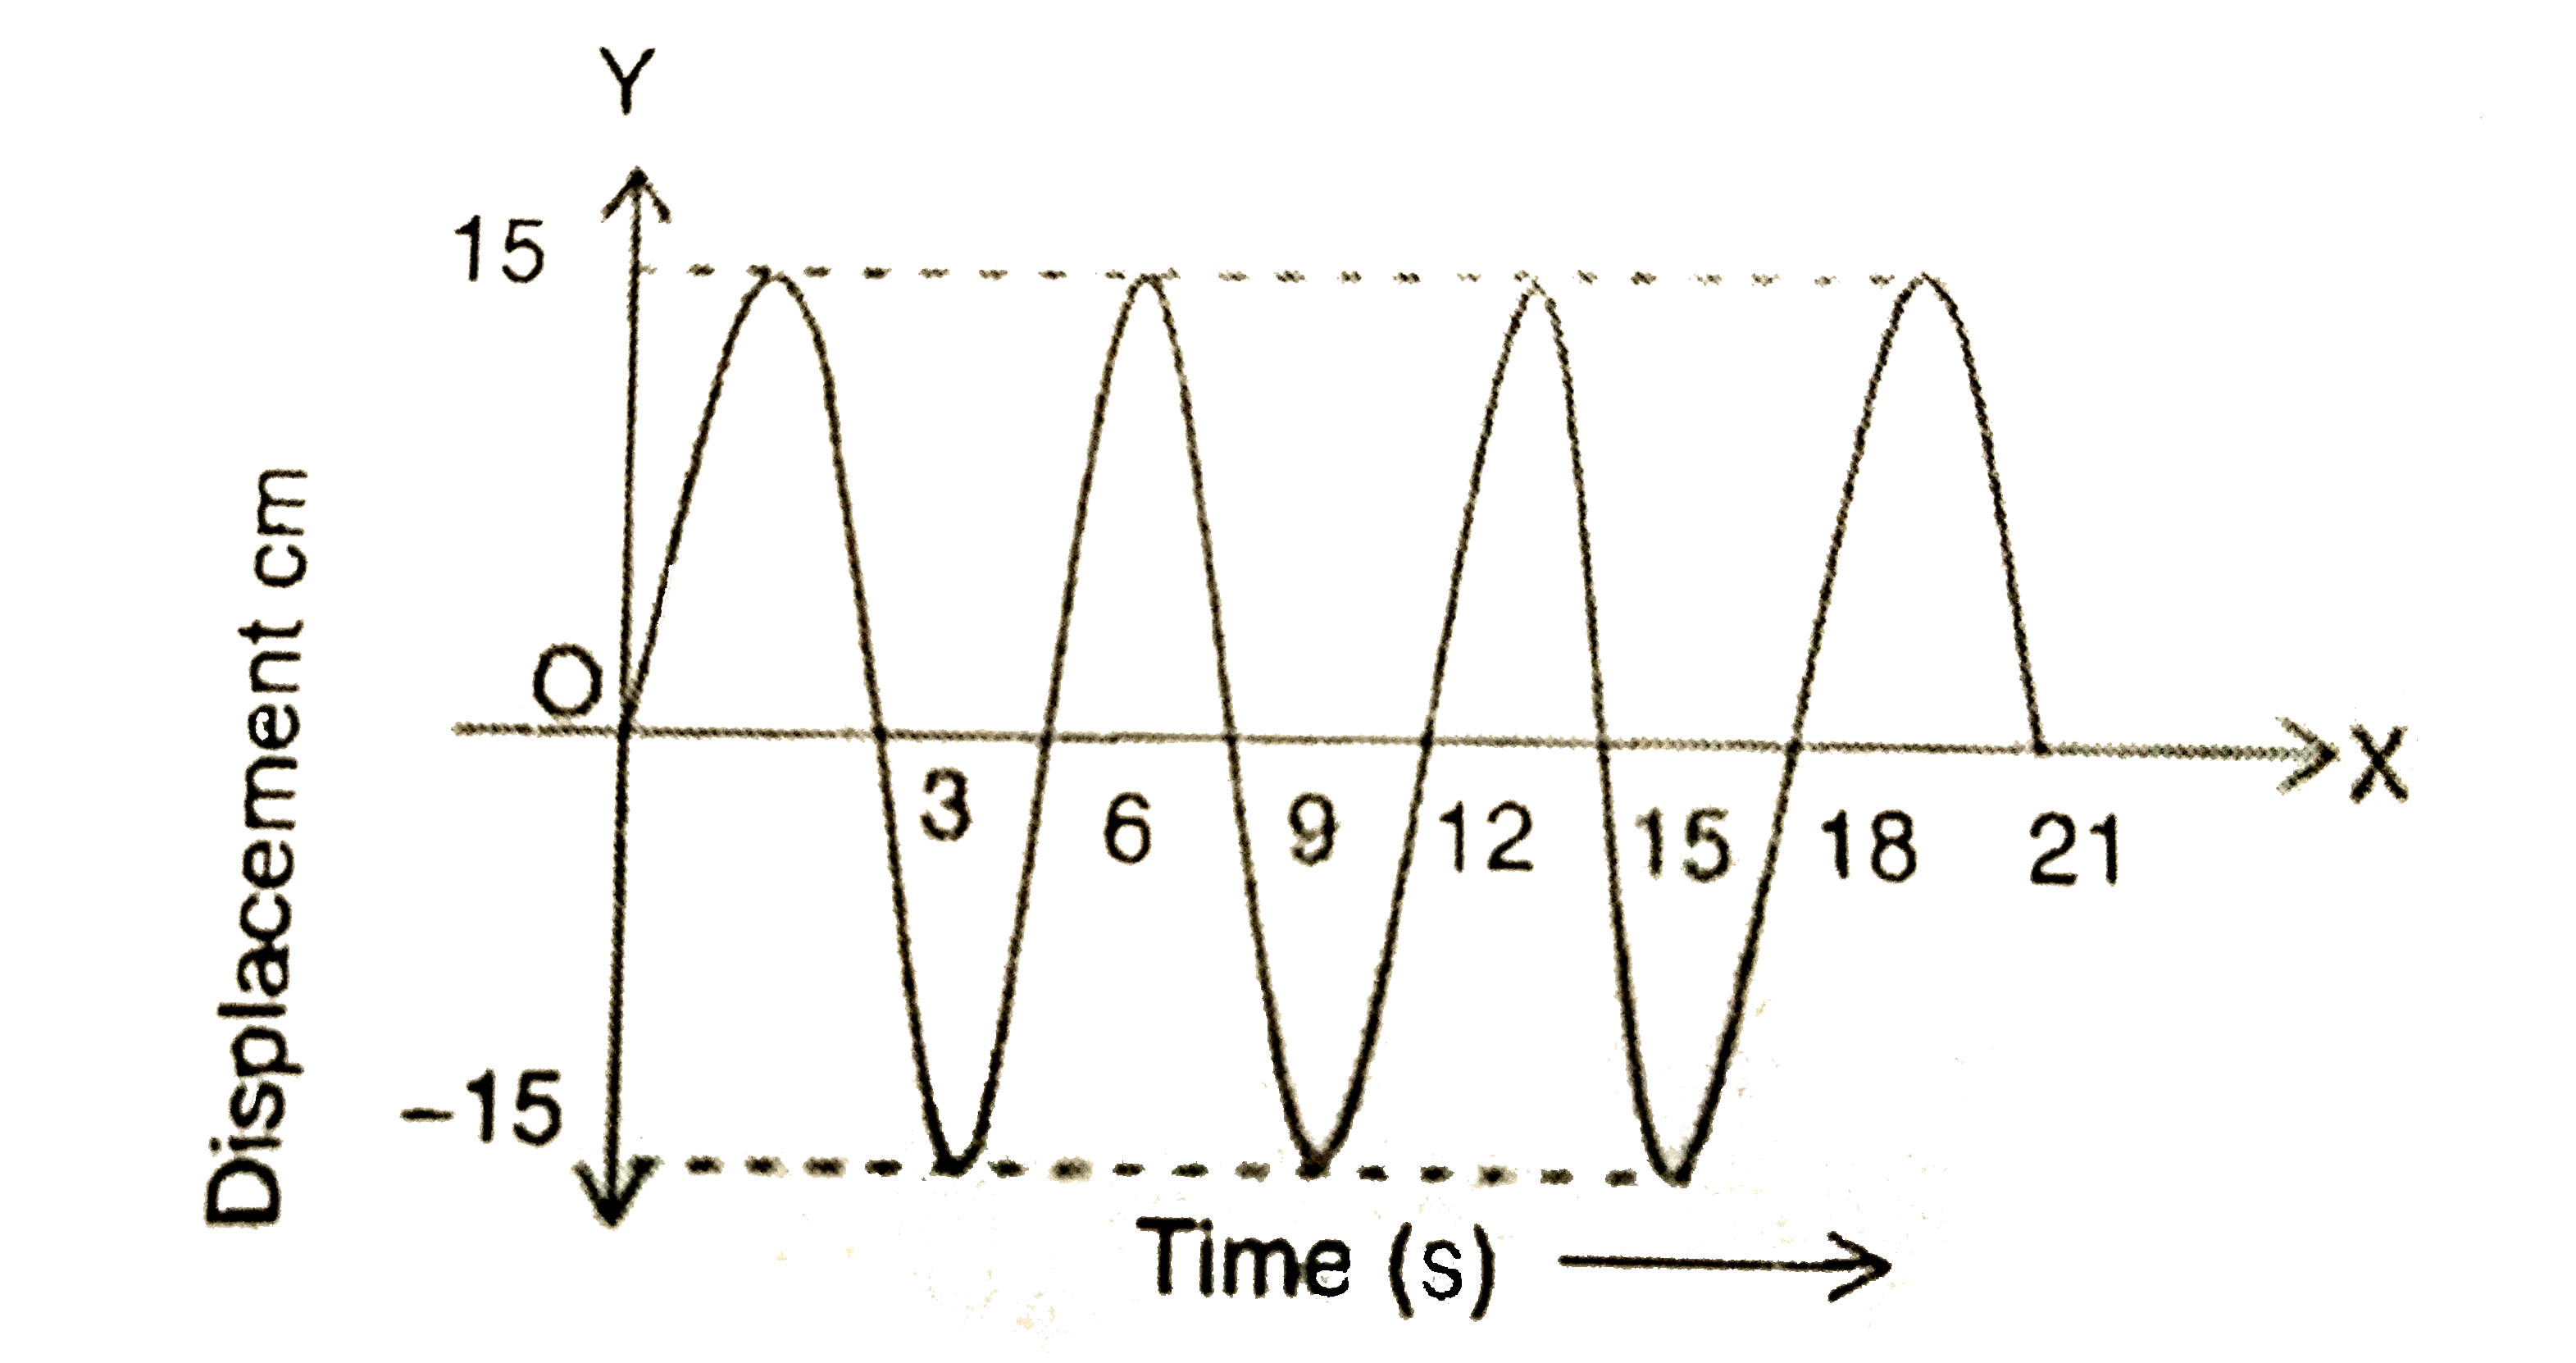
View SolutionIn the case of a simple pendulum, a graph is drawn between the displacement and time taken for its oscillations as shown in the figure . Then
The number of oscillations completed by the bob in one second is _____ .
View SolutionA graph is drawn between the displacement and time taken for the oscillations of a simple pendulum.

View SolutionIn the case of a simple pendulum, a graph is drawn between the displacement and time taken for its oscillations as shown in the figure. Then Time period of the pendulum bob is ______ s.
View SolutionIn the case of a simple pendulum, a graph is drawn between the displacement and time taken for its oscillations as shown in the figure. Then The number of oscillations completed by the bob in one second is ______.
View SolutionIn the case of a simple pendulum, a graph is drawn between the displacement and time taken for its oscillations as shown in the figure. Then The amplitude of oscillation of the pendulum bob is _____ cm.
View SolutionIn the case of a simple pendulum, a graph is drawn between the displacement and time taken for its oscillations as shown in the figure. Then From the given figure the number of oscillations per-formed by the bob at the end of 21 s is ______.
View SolutionA graph is drawn between the displacement and time taken for the oscillations of a simple pendulum. The frequency of oscillation is ________ HZ.
View SolutionA graph is drawn between the displacement and time taken for the oscillations of a simple pendulum. The number of oscillations performed by the bob at the end of 10 s is _________.
View SolutionA graph is drawn between the displacement and time taken for the oscillations of a simple pendulum. The time taken to complete 100 oscillations is ________ s.
View Solution
