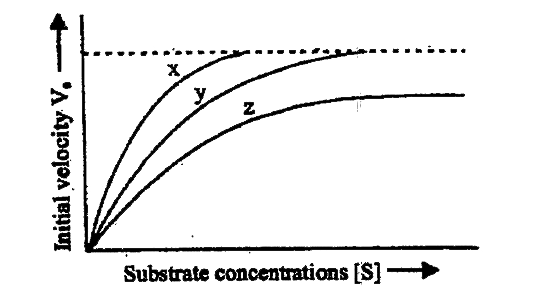
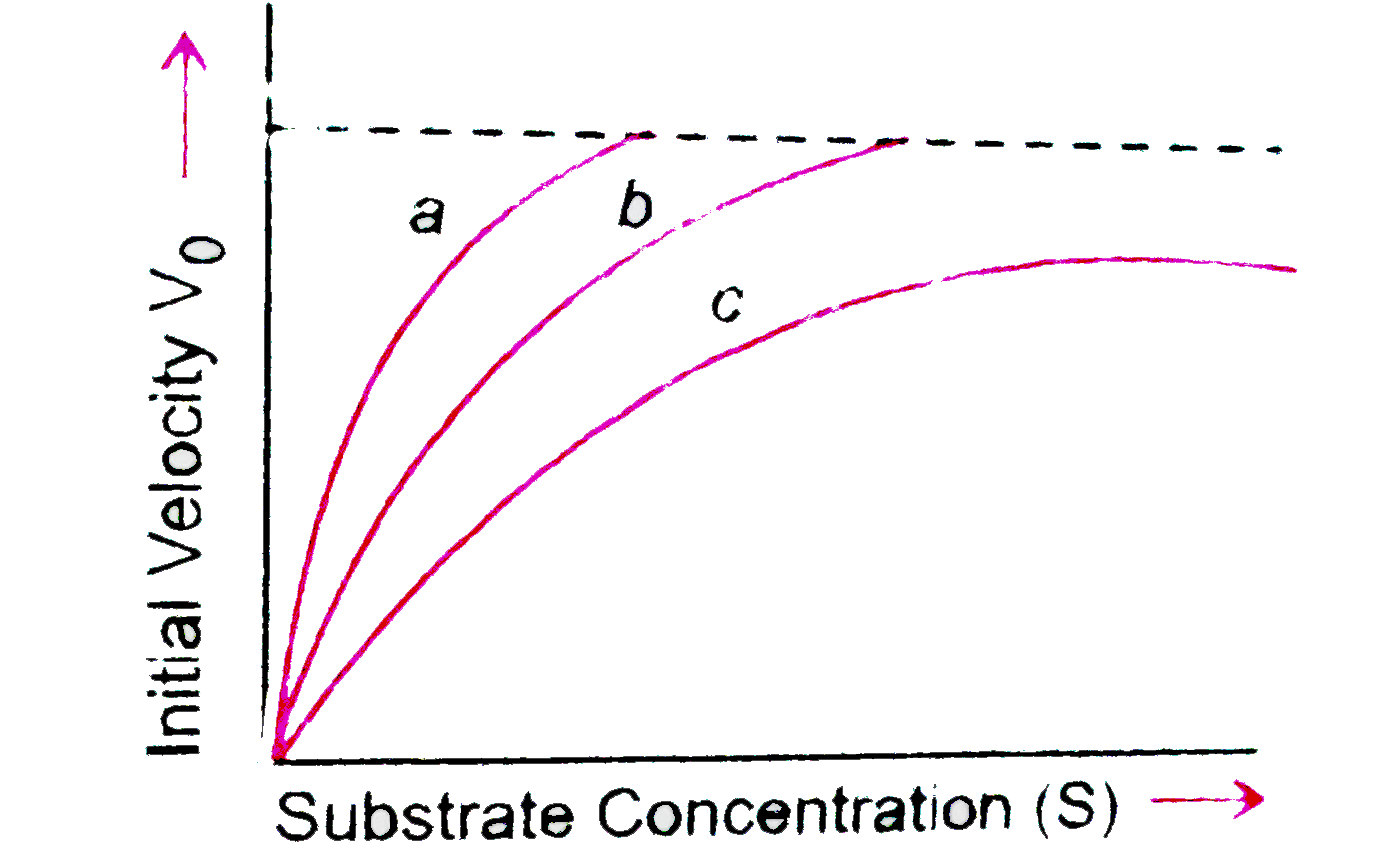
The figure given below shows three velocity substrate concentration curves for an enzyme reaction . What do the curves A , B and C depict respectively ?
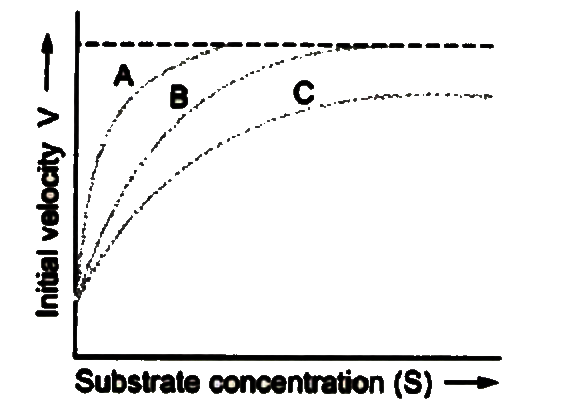
a-normal enzymes action, b-competitive inhibition,c-noncompetitive inhibition
a-enzyme with an allosteric modulator added, b-normal enzyme activity, c-competitive inhibition
a-enzyme with an allosteric stimulator,b-competitive inhibition added, c-normal enzyme reaction
a-normal enzyme reaction, b-non-competitive enhibition added c-allosteric inhibitor add.
The correct Answer is:A
Step by step video solution for The figure given below shows three velocity substrate concentration curves for an enzyme reaction . What do the curves A , B and C depict respectively ? by Biology experts to help you in doubts & scoring excellent marks in Class 12 exams.
Updated on:21/07/2023Topper's Solved these Questions
- MOLECULES OF THE CELLBOOK - DINESH PUBLICATION ENGLISHCHAPTER - MOLECULES OF THE CELLEXERCISE - CYG
43 Videos
- MOLECULES OF THE CELLBOOK - DINESH PUBLICATION ENGLISHCHAPTER - MOLECULES OF THE CELLEXERCISE - CYG
43 Videos
- MICROBES IN HUMAN WELFAREBOOK - DINESH PUBLICATION ENGLISHCHAPTER - MICROBES IN HUMAN WELFAREEXERCISE - Brain Teasers-VIII
60 Videos
- MOLLUSCABOOK - DINESH PUBLICATION ENGLISHCHAPTER - MOLLUSCAEXERCISE - CYG
10 Videos
Similar Questions
Immediate source of energy is
View SolutionImmediate source of energy is
View SolutionHuman society started use of bronze/copper
View SolutionSiphuncle or living tube occurs in
View SolutionFigure given below shows three velocity-substrate concentration curves for an enzyme reaxtion. What do the curves for an enzyme reaction. What do the curves depict
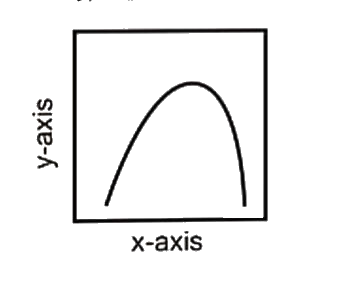
View Solutionthe curve given below shows wnzymatic acitvity with relation to three conditions (pH , temperature and substrate concentration ).
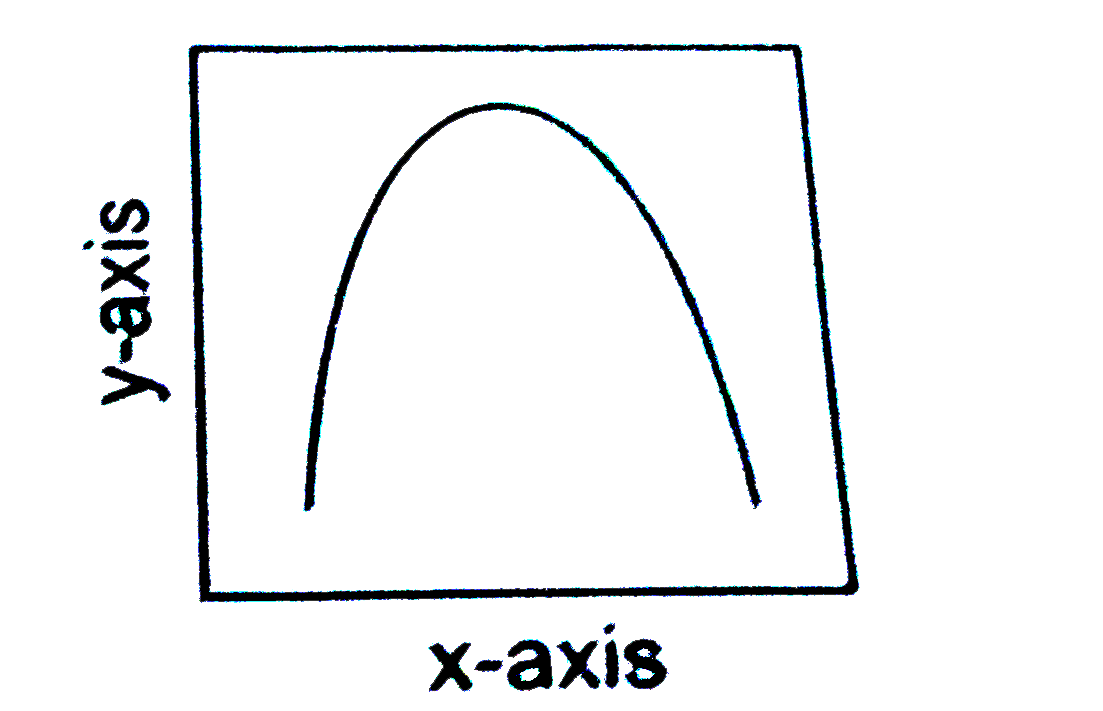
what do the two axes ( x and y) represent ?
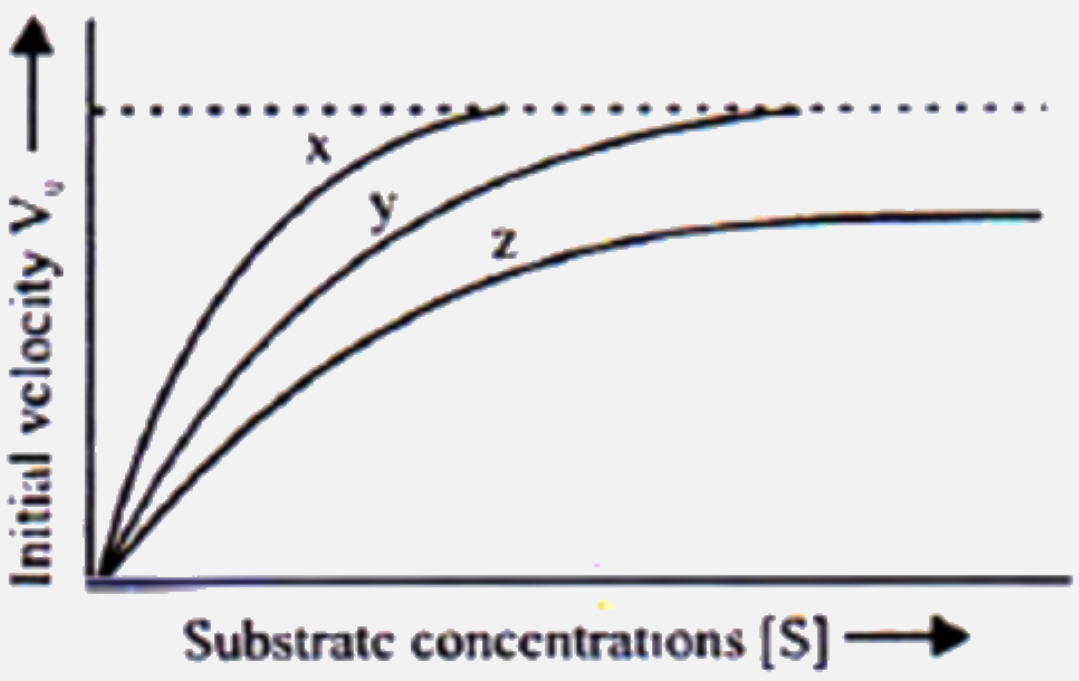
View SolutionThe Given figure shows three velocity-substrate concentration curves of an enzyme reaction. What do the curves X Y and Z depict respectively ?
View SolutionThree velocity base concentrations are given in the figure below for an enzyme reaction. What is known from the curves a, b and c respectively
View SolutionThe shape of the curve obtained when substrate concentration is plotted against velocity of reaction
View Solutionनीचे दिखाये गये वक्र में तीन दशाओं (pH, तापमान तथा क्रियाधार सांद्रण) के संबंध के साथ एंजाइम-क्रिया दर्शायी गयी है। इसमें दो अक्षा (x तथा y) क्या दर्शाते हैं ?
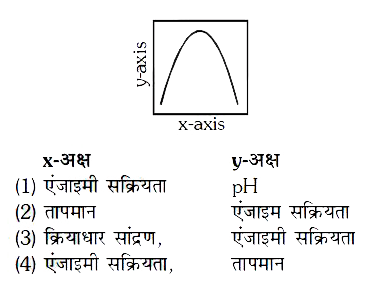
View SolutionThe curve given below show enzymatic activity with relation to three conditions (pH, temperature and substrate concentration)
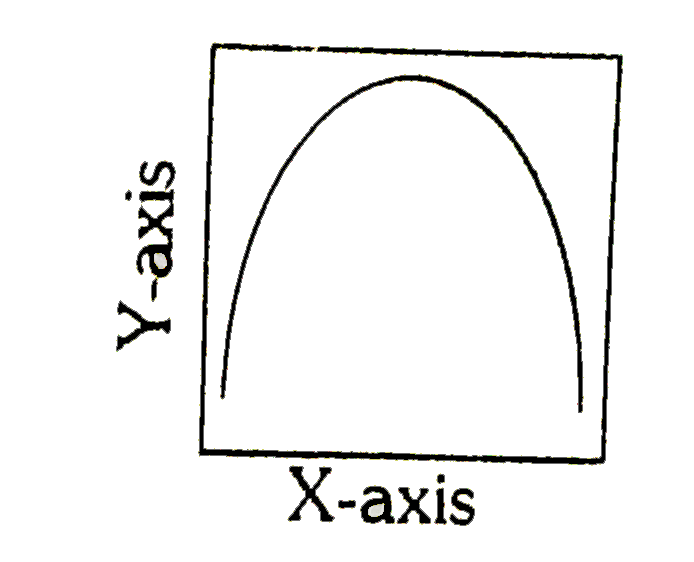
What do the two axises (x and y) represent
View Solutionthe curve given below shows wnzymatic acitvity with relation to three conditions (pH , temperature and substrate concentration ).

what do the two axes ( x and y) represent ?
View SolutionThe given figure shows three velocity-substrate concentration curves for an enzyme reaction. What do the curves x, y and z depict respectively?
View SolutionFigure given below shows three velocity-substrate concentration curves for an enzyme reaxtion. What do the curves for an enzyme reaction. What do the curves depict
View SolutionThe Given figure shows three velocity-substrate concentration curves of an enzyme reaction. What do the curves X Y and Z depict respectively ?
View SolutionThe curve given below shows enzymatic activity with relation to three conditions (pH, temperature and substrate concentration). What does the two axis (x and y) represent ?
View Solution

