The table shows the number of cars sold by three showrooms over a period of six year.
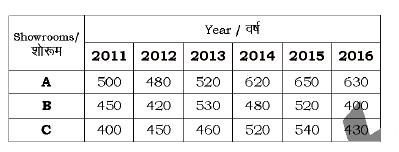
The total number of cars sold by all three showrooms over the years is represented as a pie chart, what is the central angle of the sector representing the total number of cars sold in the year 2013
58∘
62∘
60∘
56∘
The correct Answer is:C
Step by step video & text solution for The table shows the number of cars sold by three showrooms over a period of six year. The total number of cars sold by all three showrooms over the years is represented as a pie chart, what is the central angle of the sector representing the total number of cars sold in the year 2013 by Maths experts to help you in doubts & scoring excellent marks in Class 14 exams.
Updated on:21/07/2023Topper's Solved these Questions
Similar Questions
Find the simple interest and compound interest on Rs 10000 for 2 years at the rate of 10%?
View SolutionIn triangle PQR, the internal bisector of ∠Q and ∠R meets at 0. If ∠QPR=70∘, then what is the value (in degrees) of ∠QOR?
View SolutionThe table shows the number of cars sold by three showrooms over a period of six years. यह तालिका तीन शोरूम द्वारा छः वर्षों की अवधि में बेची गयी कारों की संख्या दर्शाती है | If the total number of cars sold by all three showrooms over the years is represented as a pie-chart, what is the central angle of the sector representing the total number of cars sold in the year 2013 (to the nearest whole number)? यदि तीनों शोरुम द्वारा इन वर्षों के दौरान बेची गयी कारों की कुल संख्या को एक पाई-चार्ट में प्रस्तुत किया जाए, तो वर्ष 2013 में बेची गयी कारों की कुल संख्या को दर्शाने वाले त्रिज्यखंड का केंद्रीय कोण क्या होगा? ( निकटतम पूर्ण संख्या में )
View SolutionThe table shows the number of cars sold by three showrooms over a period of six year.

What is the ratio of the total cars sold by showrooms B during the years 2014 and 2016 and the total cars sold by showrooms C during 2015 and 2016?
View SolutionThe table shows the number of cars sold by three showrooms over a period of six years.
यह तालिका तीन शोरूम द्वारा छः वर्षों की अवधि में बेची गयी कारों की संख्या दर्शाती है |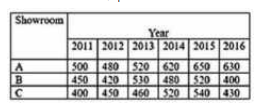 By what percent did the total number of cars sold by all three showrooms decrease during the year 2016, as compared to that in the year 2015 (nearest to one decimal place)?
वर्ष 2015 की तुलना में वर्ष 2016 में तीनों शोरूम के द्वारा बेची गयी कारों की कुल संख्या में कितने प्रतिशत की कमी आयी है ? (एक दशमलव स्थान के निकटतम )
View SolutionThe table shows the number of cars sold by three showrooms over a period of six years.
यह तालिका तीन शोरूम द्वारा छः वर्षों की अवधि में बेची गयी कारों की संख्या दर्शाती है |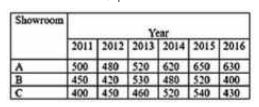 What is the average number of cars sold by showroom A over the given six years (nearest to one decimal place)?
दिए गए छः वर्षों में शोरूम A द्वारा बेची गयी कारों की औसत संख्या कितनी है ? (एक दशमलव स्थान के निकटतम )
View SolutionThe given pie chart represents the distribution of the percentage of sales of a particular brand of car from five showrooms A B C D and E during 2018 The total number of cars sold during that year from the five showsrooms in 5000.
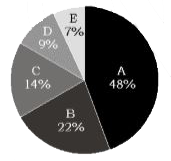
What is the total number of cars sold from the showrooms B and D?
View SolutionThe given pie chart represents the distribution of the percentage of sales of a particular brand of car from five showrooms A B C D and E during 2018 The total number of cars sold during that year from the five showsrooms in 5000. What is the central angle of the sector corresponding to the sales from the showroom
View SolutionThis table shows the number of cars sold in different showrooms during the six years. If the total number of cars sold by all the three showrooms in six years is represented in the form of a pie-chart, then what is the central angle of the sector representing the total number of cars sold in the year 2013 ? (to the nearest whole number)
View SolutionBy what percent the total number of cars sold by all the showrooms in the year 2016 decreased (to the nearest one decimal place) to the total number of cars sold by all the showrooms in the year 2015?
View SolutionWhat is the average number of cars (up to one decimal place) sold by Showroom A during the given six years?
View SolutionThe given pie-chart shows the distribution of sales of a specific brand of car from five showrooms A, B, C, D and E during the year 2018. The total number of cars sold from all the five showrooms during that year is 5000. Find the central angle (closest to the numerator) of the segment corresponding to sales in showroom C.
View SolutionThe given pie-chart shows the distribution (in degrees) of cars sold of difference models by a company in 2015-16.
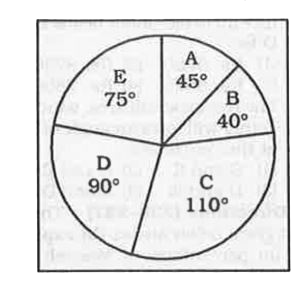
If 5% of the total number of cars sold of model E is 750, then what is the average number of cars sold of all the models ?
View Solutionthis table 6 Shows the number of cars sold in different showrooms during the year. If the total number of cars sold by all the three showrooms in six years is shown in the form of a pie-chart, then the year 2013 What is the central angle of the sector representing the total number of cars sold in India?
View Solutionthis table 6 Shows the number of cars sold in different showrooms during the year. Year 2014 And 2016 Total number of cars sold by showroom B in year and year 2015 And 2016 What is the ratio of the total number of cars sold by C in
View Solution
