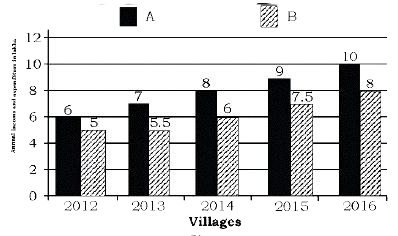
The given bar graph presents the data of annual income and annual expenditure of an IT officier in a multinational company during the years 2012 to 2016.

What was his average montly savings in 2015 and 2016. taken together
A. 14506.33
B. 14967.67
C. 13687.67
D. 14583.33
The correct Answer is:D
Step by step video & text solution for The given bar graph presents the data of annual income and annual expenditure of an IT officier in a multinational company during the years 2012 to 2016. What was his average montly savings in 2015 and 2016. taken together by Maths experts to help you in doubts & scoring excellent marks in Class 14 exams.
Updated on:21/07/2023Topper's Solved these Questions
Similar Questions
Find the simple interest and compound interest on Rs 10000 for 2 years at the rate of 10%?
View SolutionIn triangle PQR, the internal bisector of ∠Q and ∠R meets at 0. If ∠QPR=70∘, then what is the value (in degrees) of ∠QOR?
View SolutionFollowing information is available for the year 2016-17, calculate gross profit ratio:
View SolutionDetermine the point of symmetry of a regular hexagon.
View SolutionDtermine the images of the following figure about the given line :
View SolutionMatch the following Column A to Column B

View SolutionMatch the following Column A to Column B

View SolutionMatch the following Column A to Column B

View SolutionThe inequation represented by the graph given below is :
View SolutionThe inequation that best describes the graph given below is _________
View SolutionThe inequation that best describes the following graph is _________
View SolutionWhich inequations represent the shaded region in the given figure
View SolutionThe given bar graph presents the data of annual income and annual expenditure of an IT officier in a multinational company during the years 2012 to 2016. For which pair of years, the ratio of savings to expenditure is equal.
View SolutionThe given column graph (bar graph) presents the figures of annual income (A) and annual expenditure (B) of an IT officer in a multi-national company during the years 2012 to 2016. For which year-combination, the ratio of expenditure and savings is same?
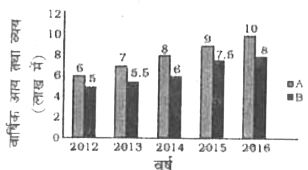
View Solutionदिया गया स्तंभ आरेख (बार ग्राफ) वर्ष 2012 से 2016 के दौरान एक बहु-राष्ट्रीय कंपनी में एक आईटी अधिकारी की वार्षिक आय (A) और वार्षिक व्यय (B) के आँकड़े प्रस्तुत करता है।

2015 और 2016 में उस अधिकारी की औसत मासिक बचत (रुपए में ), कुल मिलाकर (दशमलव के दो स्थानों तक सही ) कितनी थी ?
View Solution