The given graph shows the marks obtained by students in an examination
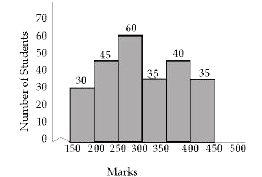
The number of students who obtained less than 300 marks is what percent more than the number of students who obtained 350 or more marks
0.8
0.28
0.444
0.227
The correct Answer is:A
Step by step video solution for The given graph shows the marks obtained by students in an examination The number of students who obtained less than 300 marks is what percent more than the number of students who obtained 350 or more marks by Maths experts to help you in doubts & scoring excellent marks in Class 14 exams.
Updated on:21/07/2023Topper's Solved these Questions
Similar Questions
Find the simple interest and compound interest on Rs 10000 for 2 years at the rate of 10%?
View SolutionIn triangle PQR, the internal bisector of ∠Q and ∠R meets at 0. If ∠QPR=70∘, then what is the value (in degrees) of ∠QOR?
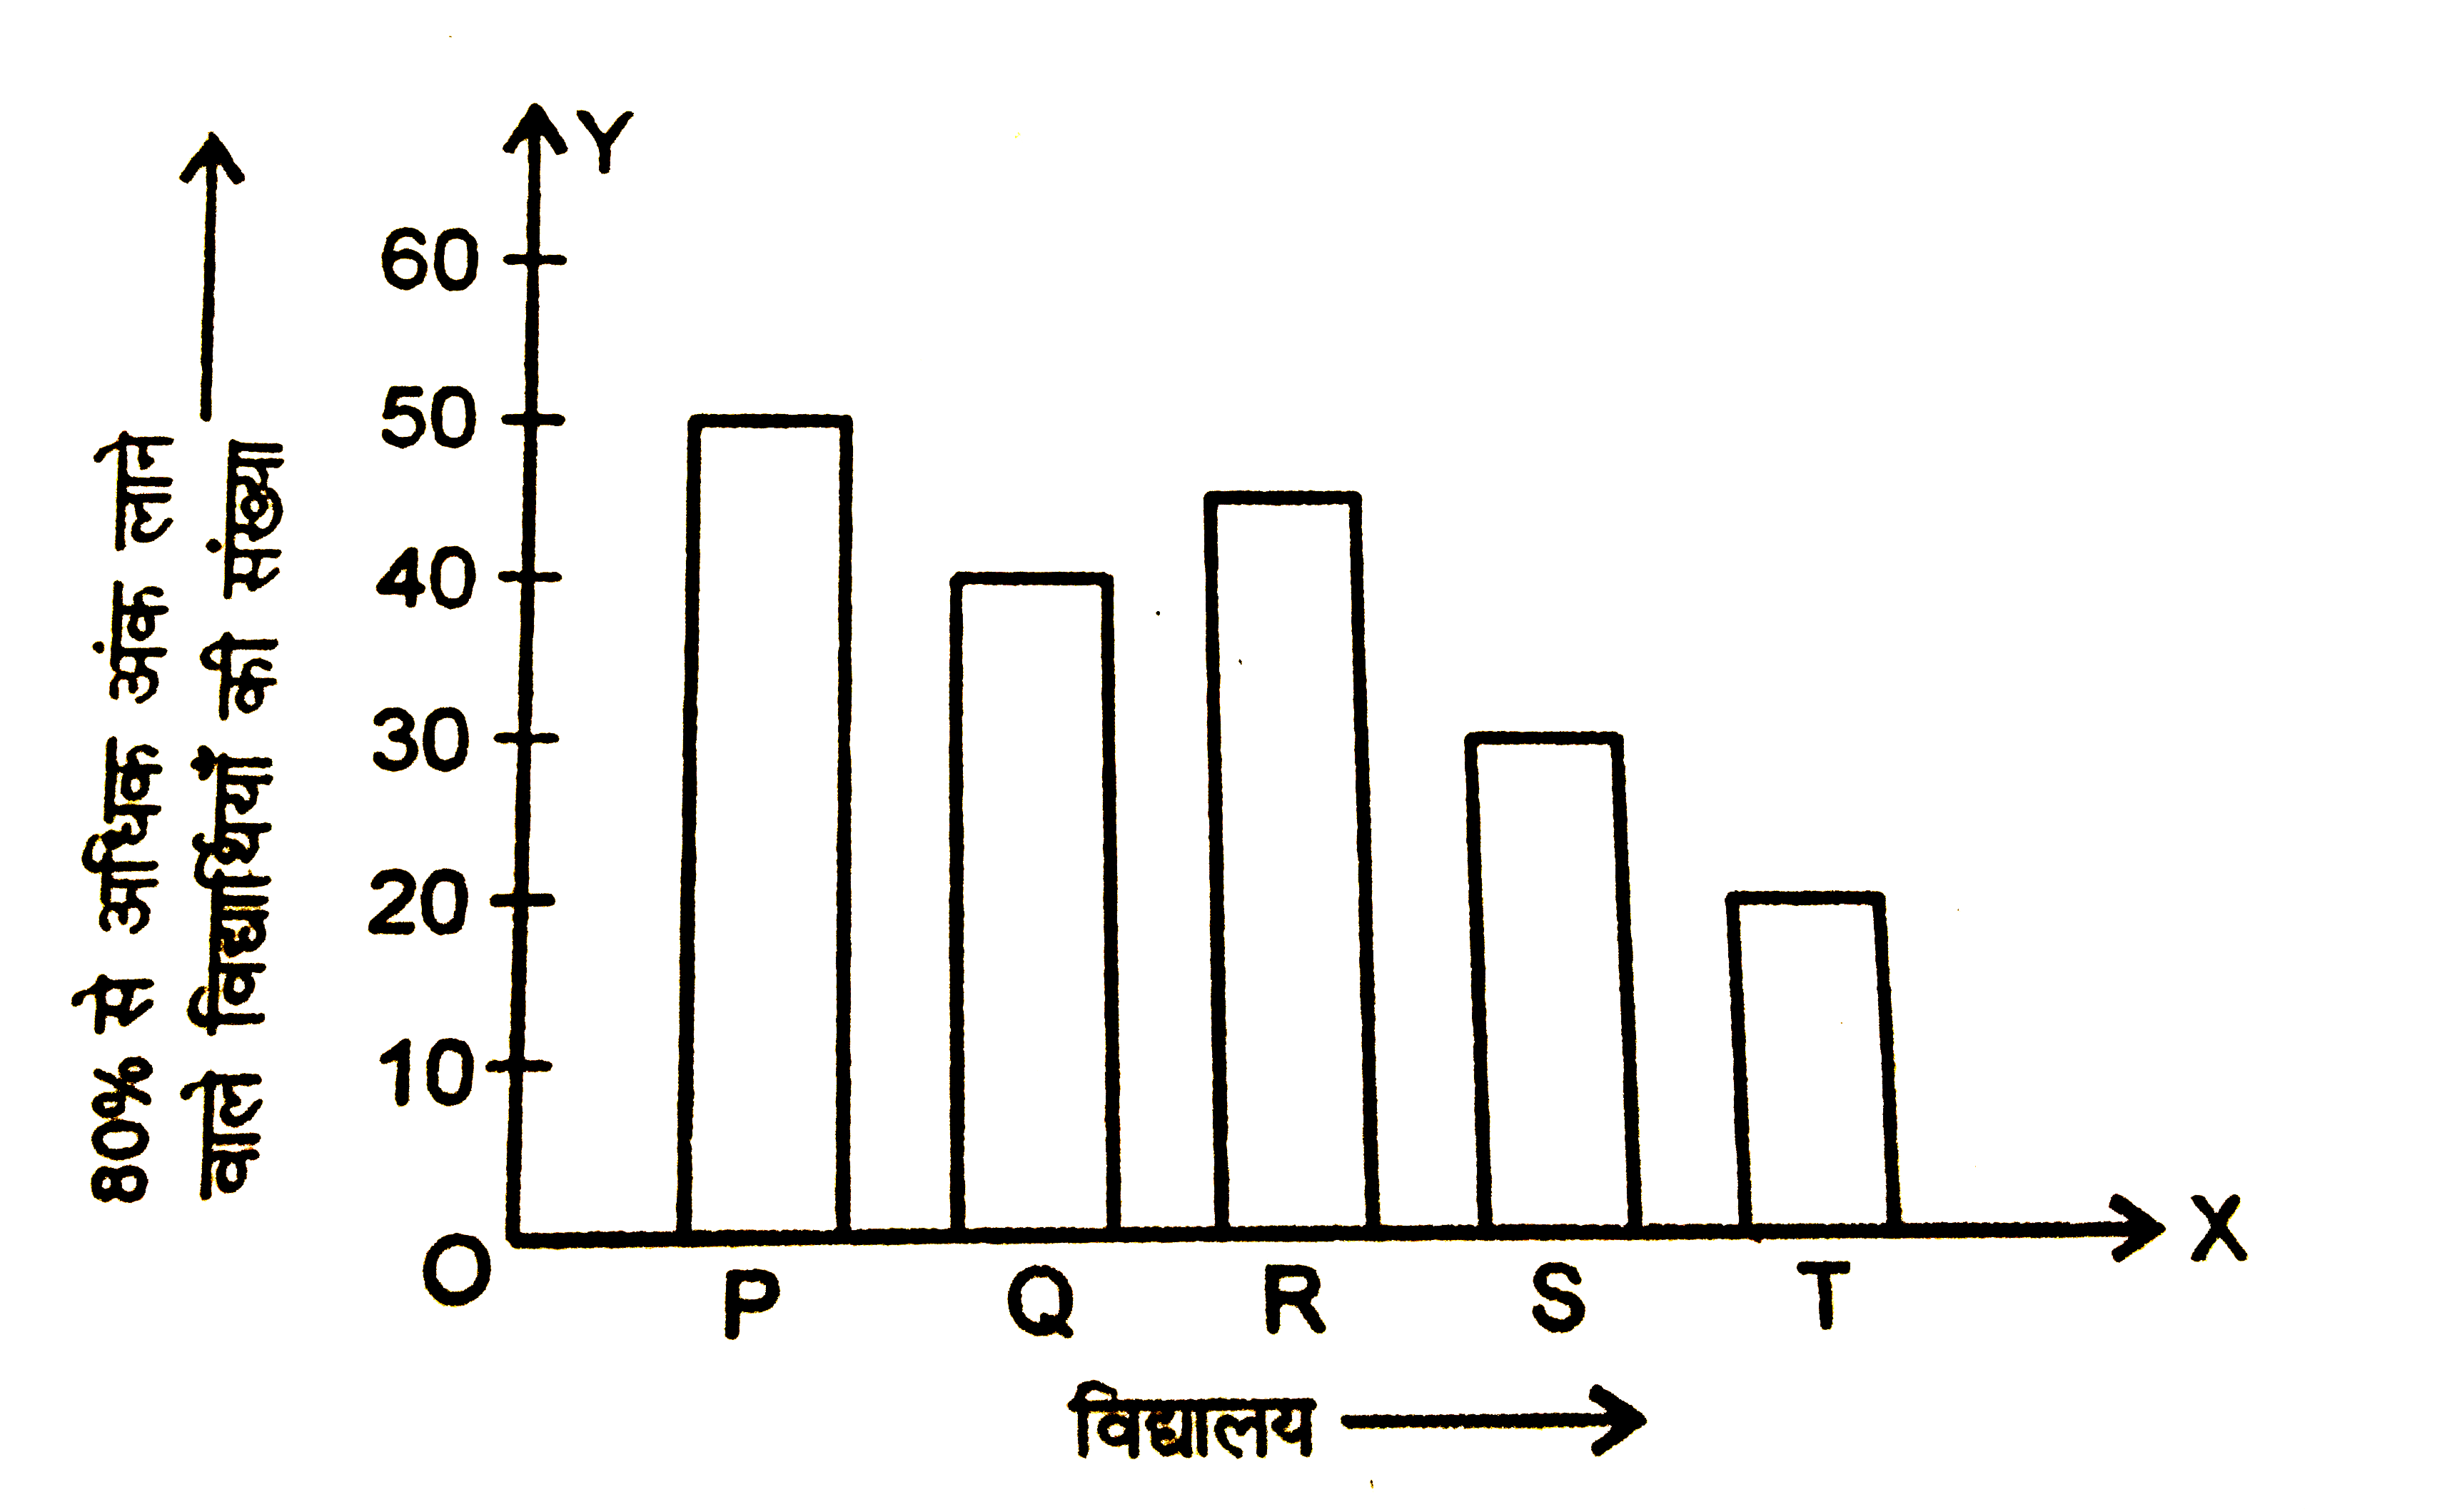
View Solutionदिए गए चित्र में पाँच विद्यालयों में वर्ग 9 की परीक्षा में 80% से अधिक अंक लाने वाले विद्यार्थियों की संख्या का दंड आलेख दिखाया गया है। विद्यलय Q में 80% से अधिक अंक लाने वाले विद्यार्थियों की संख्या है
View Solutionमासिक इकाई परीक्षा में, एक विद्यार्थी द्वारा प्राप्त अंकों का प्रतिशत नीचे दिया गया है

प्रायिकता ज्ञात कीजिए कि विद्यार्थी प्राप्त करता है (i) 70% से अधिक अंक (ii) 70% से कम अंक (iii) 75% से अधिक
View SolutionThe given graph shows the marks obtained by students in an examination.
दिया गया आरेख किसी परीक्षा में छात्रों के प्राप्तांक दर्शाता है | The number of students who obtained less than 300 marks is what percent more than the number of students who obtained 350 or more marks?
300 अंक से कम प्राप्त करने वाले छात्रों की संख्या 350 या इससे अधिक अंक प्राप्त करने वाले छात्रों की संख्या से कितना प्रतिशत अधिक है ?
View SolutionStudy the given graph and answer the question that follows
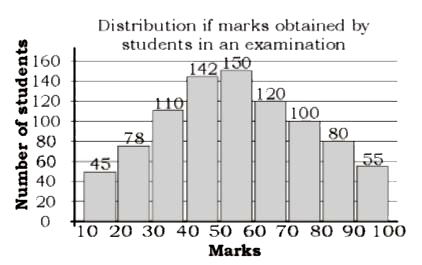
The total marks of students obtaining less than 50 marks is what percentage more than the total number of students obtaining 60 marks or more
View SolutionThe given graph shows the marks obtained by the students in an examination. The number of students who got less than 300 marks is what percent more than the number of students who got 350 or more marks?
View SolutionIn each of the following questions, the following histogram shows the relationship between the marks obtained by the students and the number of students in an examination. Study the histogram and answer the questions.
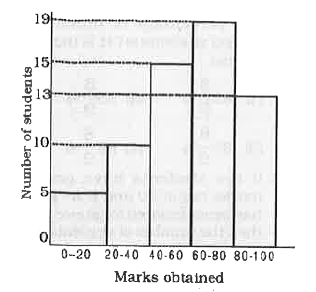
The ratio of the number of students who obtained 60 or more marks to that of students who obtained 60 or less marks is
View SolutionDistribution of marks of students in an examination 50 Total number of students who got marks less than 60 What is the percentage more than the total number of students who got marks or more?
View Solutionदिए गए ग्राफ में एक परीक्षा में विद्यार्थियों द्वारा प्राप्त अंकों को दर्शाया गया है। ग्राफ का अध्ययन . करें एवं दिए गए प्रश्न के उत्तर दें।
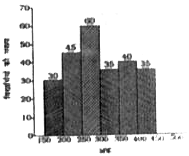
300 से कम अंक प्राप्त करने वाले विद्यार्थियों की संख्या 350 या उससे अधिक अंक प्राप्त करने वाले विद्यार्थियों की संख्या से कितन प्रतिशत अधिक है?
View SolutionThe given graph shows the marks obtained by the students in an examination. study of graphs. and answer the given question. The number of students who got less than 300 marks is what percent more than the number of students who got 350 or more marks?
View SolutionAdjoining histogram of marks obtained in an examination of total marks 1000 and minimum passing marks is 300.The number of students who got more than or equal to 80% of marks are
View SolutionThe histogram shows the number of students and the range of marks scored by them
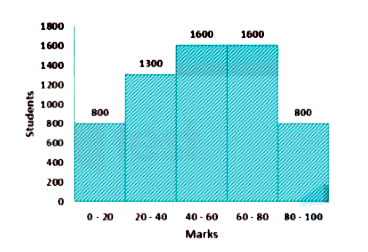
Find the ratio of students who scored marks less than 40 and the students who scored marks greater than 60?
View SolutionStudy the given histogram that shows the marks obtained by students in an examination and answer the question that follows .
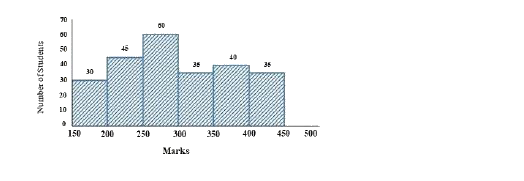
The number of students who obtained less than 250 marks is :
View SolutionThe table given below shows the marks obtained by six students in 5 different subjects.
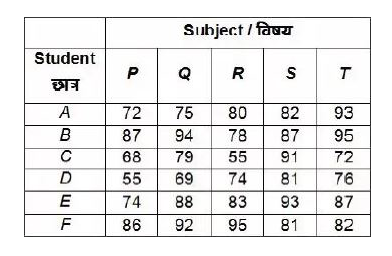
Maximum marks for each subject is 100.
Marks obtained by student B is how much percent more than the marks obtained by A?
View SolutionThe given pie chart shows the marks obtained (in degrees) by a student in different subjects . The total marks obtained by the student in the examination is 432.
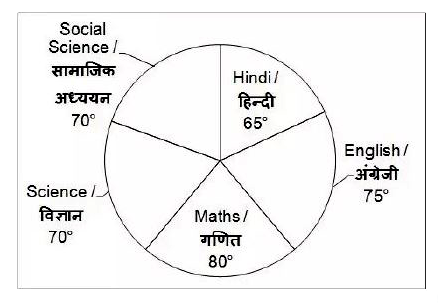
The marks obtained in Maths is how much percent more than the marks obtained in Science?
View Solution